
Estimating timelines and schedules is one of the hardest things that you will have to do as a manager or project manager. A big part of this is that you will be torn by two conflicting impulses:
- Technical people are optimists by nature. When we think about how long it takes to do something, we imagine how long it will take if everyone leaves us alone, and if everything goes as planned. (Optimism is a wonderful thing, but it is not usually a good projection of what is going to happen.)
- Because we don’t want to be the one who delivers something late, we dramatically overestimate how long it will take.
It is good practice to underpromise and overdeliver, but sometimes underpromising leads to a management decision that prevents the company from taking advantage of a new opportunity. Estimates need to be reasonably accurate in order to be useful.
PERT analysis is a discipline that tries to estimate timelines while taking uncertainty into account. A short estimate and a long estimate are used to try to provide an accurate estimate.
Project management software (such as Microsoft Project or GanttProject: see Appendix A) makes it much easier to estimate timelines using PERT and Gantt charts built into the software.
Gantt Charts
Figure B-1 shows a Gantt chart for a simple project. To use a Gantt chart for estimates, you need to have a few elements in place:
- The tasks need to be entered.
- The duration estimates for the tests need to be registered.
- Dependency relationships need to be established.
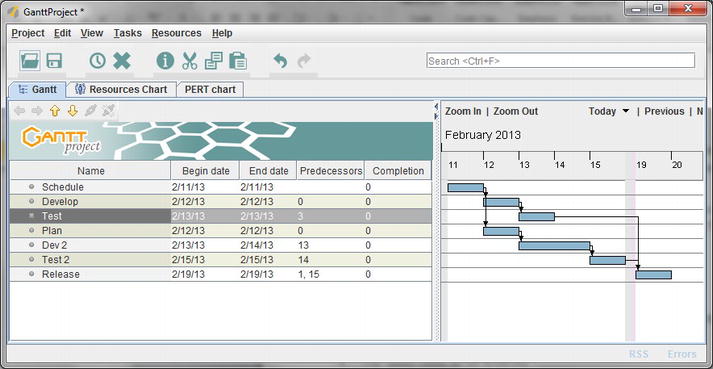
Figure B-1. Gantt chart
Once this information has been entered, the Gantt chart can be examined to identify the critical path.
Remember that the critical path is the shortest possible path through the project. If any of the tasks on the critical path becomes longer, it will increase the amount of time it takes to get through the project. In this case, looking at Figure B-1 and B-2, we see that the critical path is:
Schedule ![]() Plan
Plan ![]() Dev 2
Dev 2 ![]() Test 2
Test 2 ![]() Release
Release
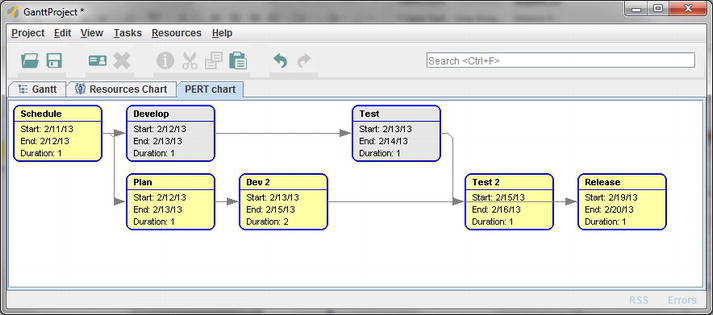
Figure B-2. GanttProject PERT view of a critical path
If any of these tasks takes longer than planned, the release date will slip. In converse, if we can reduce the amount of time spent on these tasks (perhaps by assigning more people to one of the tasks, or finding a way to reschedule it), it may be possible to pull the release date in.
Gantt charts are exactly as useful as the quality of estimates underlying them. If the estimates are reasonably good, they are very helpful to a project manager who is trying to decide which tasks need additional attention in order to keep the project on schedule.
The GanttProject PERT view (see next section) for this project highlights the critical path (Figure B-2). This is useful, especially for a nontrivial project. But the diagram is only as good as the quality of the duration estimates.
PERT Duration Estimates
PERT stands for “Program Evaluation and Review Technique.” It represents a methodology for managing the timeline risks in a project.
In PERT, you would measure the duration by getting three different estimates for each task:
- An optimistic, “best-case” estimate.
- A “most-likely” estimate.
- A pessimistic, “worst-case” estimate.
Once you have these three estimates, enter the duration of each task as being:
[( optimistic time ) + ( 4 × most likely time ) + ( pessimistic time )] / 6.
This weighted average provides a decent time estimate that takes into account the risk that something could go really badly during implementation. People are able to provide three different estimates, and can mentally shift gears to provide each number. This takes some of the pressure off of the technical team, since they can provide estimates based on their experience of what can go wrong while not padding the project schedule so far that the project is abandoned.
But like any other estimation method, garbage in will result in garbage out. Emphasize to the team that they have the responsibility to provide you with their best technical judgment for each of these numbers.
Summary
Gantt and PERT analysis are common tools for providing high-quality duration estimates. Especially when used along with the resource-scheduling features of the project software, they provide a time-efficient way to provide high-quality schedule estimates for a project.