
Chapter 19
Best of Both Worlds: The Integrated-Reasoning Section
IN THIS CHAPTER
![]() Discovering what to expect from the integrated-reasoning section
Discovering what to expect from the integrated-reasoning section
![]() Understanding how the integrated-reasoning section is scored
Understanding how the integrated-reasoning section is scored
![]() Planning how to use your time wisely to answer questions
Planning how to use your time wisely to answer questions
![]() Working through the four integrated-reasoning question types
Working through the four integrated-reasoning question types
Integrated-reasoning (IR) questions appear right after the analytical-writing section. The IR section throws you something completely different from the five-answer multiple-choice questions you’re probably used to. The 12 questions in the integrated-reasoning section are formatted in a variety of ways and include tables and graphs to test how well you apply reasoning skills to different scenarios. A lot goes on at once in this section, and this chapter gives you the information you need to manage it all successfully within the 30-minute time limit.
Understanding What the IR Section Is All About
True to its name, the integrated-reasoning section combines the critical-reasoning skills tested in the verbal-reasoning section with some of the math skills you use to solve quantitative-reasoning questions. Therefore, if you’re well prepared for the GMAT’s math and verbal sections, you should do well in the IR section, too. We explain the details of the IR section and the purpose behind it in the next two sections.
Skills tested
The most common math computations in the IR section involve these areas:
- Basic statistics, such as average, median, mode, and range
- Percentages
- Rate and distance
- Functions
- Geometry formulas
You’ll need to apply these essentials of critical reasoning:
- Basic elements of logical arguments: premises, conclusions, and assumptions
- How to strengthen and weaken an argument
- Argument types: cause and effect, analogy, and statistical
You can review the necessary math concepts in Chapters 12, 13, and 14. Read more about evaluating logical arguments in Chapter 6.
Question format
The IR section presents you with 12 questions, one question at a time, and you have 30 minutes to answer them. Almost every question has multiple parts. To get credit for answering a question correctly, you have to answer all its parts correctly. You don’t receive partial credit for getting one part of the question correct. Unlike the verbal- and quantitative-reasoning sections, the IR section isn’t computer adaptive. So the order in which you receive questions is preordained and not based on your performance.
Your IR score is based on your answers to four types of questions. On average, you can expect to come across about three of each question type on the GMAT, but the actual number of questions of each type and the order in which they appear may vary. So count on seeing at least a couple of each of these four question types crop up on your test:
- Table analysis: This three-part IR question offers you a spreadsheet of values that you can order in different ways by clicking the heading of each column. You use the data to make judgments about three pieces of information; each of your judgments has to be correct to get credit for the question.
- Two-part analysis: Based on a short written explanation of a phenomenon, situation, or mathematical problem, you come up with the proper assertions or mathematical expressions that meet the two interrelated criteria presented in the question.
- Graphics interpretation: A graph or chart gives you all the data you need to complete the two missing pieces of information in one or two statements. You choose from a pull-down menu of several answer options to record your answers.
- Multi-source reasoning: These properly named questions present you with several sources of information, such as short passages, graphs and charts, and business documents, from which you draw logical conclusions to answer questions in either of two formats: standard five-answer multiple-choice questions and three-part questions that ask you to evaluate statements.
We cover the steps to answering each question type in the section “Approaching Each Question Type,” later in this chapter.
To assist you with the mathematical computations you may need to make for some of the IR questions, the GMAT software provides you with a simple calculator. Whenever you need it, you click the box labeled Calculator and something that looks like Figure 19-1 appears. You select its functions by using your mouse. Don’t get too attached to it, though; the calculator is available only for IR questions, so you won’t be able to use it in the quantitative-reasoning section. If you want more information on the calculator’s features, see the nearby sidebar “Using the GMAT calculator.”

© John Wiley & Sons, Inc.
FIGURE 19-1: The GMAT calculator.
 Because using a computer calculator can be awkward, you’ll likely answer most IR questions more quickly by using estimation or working out calculations by hand on your noteboard. Save the calculator for only the most complex or precise computations.
Figuring Out How the IR Section Is Scored
Like the score you receive for the analytical-writing section, your integrated-reasoning score has no influence on your overall GMAT score, which consists of the combination of only your quantitative-reasoning and verbal-reasoning scores. Based on your performance in the IR section, your raw score is converted to a scaled score that ranges in whole numbers from 1 to 8 and is recorded separately from all the other scores.
MBA programs decide how they use your IR score and may choose to disregard it altogether. So your IR score is unlikely to make much of an impression unless it’s unusually low, in the 1 to 3 score range, or really high, such as the rare 7 or 8. A midrange score of 4, 5, or 6 likely won’t significantly hurt or help your chances of admission.
Making the Most of Your Time
If you’ve already calculated that answering 12 questions in 30 minutes gives you 2.5 minutes to answer each question, you may be celebrating the fact that that gives you even more time per question than you have for the quantitative- and verbal-reasoning sections. Don’t get too excited just yet. Almost every IR question has multiple parts, and you have to answer all parts of the question correctly to be credited with a correct answer. When you consider the average number of sub-questions contained within each of those 12 questions, the actual number of IR answers you have to come up with in 30 minutes may be as high as 30. Therefore, you have to use your time wisely as you move through the section.
You’ll likely feel the time crunch more fiercely in this section than the others. We provide some coping skills to help you through it:
- Conceal the timer. To maintain your sanity, refrain from constant clock-watching. Hide the timer on the computer by clicking on it. After you answer about three questions, reveal the timer by clicking on it again. It counts down from 30 minutes, so if you’re at 22 minutes, you’re cruising comfortably. If you’re at 21 or fewer, you may need to make some more calculated guesses to move through the section at a successful pace.
- Know when to move on. Discipline yourself to submit your best stab at an answer if you find yourself spending more than several minutes on any one question. You don’t want to sacrifice getting to an easy, less-time-consuming question because you’ve worked too long on a harder question. You can’t go back and revisit questions after you submitted your answers, so this practice may be difficult for you, especially if you tenaciously seek perfection. Take a deep breath, mark your best guess, and move on to what lies ahead.
- Write stuff down. Don’t be afraid to spend a little time upfront analyzing the loads of data in some IR questions. Unless you’re someone who can juggle a lot of details in your head, you should write on your noteboard as you think. A little note-taking may save you from reading information over again, which is a real time-waster.
- Whisper to yourself. Studies show that processing information is easier if you speak out loud. Don’t be afraid to whisper your way through some of the more complex problems the IR section throws at you. You’ll likely take the test in a cubicle-like setting, so if you speak quietly, you won’t disturb anyone.
Approaching Each Question Type
Each of the four IR question types tests your analytical ability in a slightly different way, so your approach depends on the question format. This section outlines the important considerations for handling each type.
Table analysis
Table-analysis questions present you with a table that contains several columns of data, similar to the one in Figure 19-2. As you can see, a little bit of explanatory material precedes the table, but don’t waste too much time reading those words. Usually, everything you need to answer the question appears in the data table.

© John Wiley & Sons, Inc.
FIGURE 19-2: Sample table-analysis format.
The Sort By feature at the top of the table allows you to organize the information by column heading, an element that comes in handy when you analyze the three statements that follow the table. When you click on Sort By, a drop-down menu of all column headings appears. Clicking on the column heading in the menu causes the table to rearrange its data by that category. So if you were to click on Cuisine Type in the drop-down menu in Figure 19-2, the table would rearrange the order of the rows alphabetically so that all the American restaurants would be listed first, followed by the Asian, Italian, Latin, Mexican, Steakhouse, and Seafood restaurants, respectively.
Using the information in the table, you decide whether the proper response to each statement is True or False, Inferable or Not Inferable, Yes or No, or some other similar either/or answer choice dictated by the specifications of the question. Then you indicate your choice by clicking on the circle next to the appropriate answer.
These questions require you to manipulate data and make observations and calculations. Some of the most common calculations are statistical ones, such as percentages, averages, medians, and ratios, so table-analysis questions can be some of the easiest questions to answer in the IR section. Here’s how to make sure you get them right:
- Jump to the question immediately. Most of the information you need appears in the table, so you rarely need to read the introductory paragraph that comes before the table. Glance at the column headings to get an idea of the type of information the table provides, and then move promptly to the question.
- Read the question carefully. You’re most likely to get tripped up on these questions simply because you haven’t read them carefully enough to figure out exactly what data they ask you to evaluate.
- Isolate the relevant column heading. Often, the key to answering a table-analysis question is ordering the data properly. Quickly figure out which column provides you with the best way to arrange the data and sort by that column. For example, if you were asked for the neighborhood on the list with the most participating restaurants, you’d sort by Neighborhood.
- Make accurate computations. Determine exactly what calculations the question requires and perform them accurately, either in your head or on the calculator. Based on Figure 19-2, for example, you could easily figure the restaurant with the greatest average daily number of meals sold by sorting by that column and glancing at the highest number. However, calculating which participating restaurant in the Downtown neighborhood brought in the greatest average daily gross revenue may require the calculator to multiply each restaurant’s price per meal by its average daily number of meals sold.
- Make use of your noteboard. Keep track of more complex calculations on your noteboard. As you calculate each Downtown restaurant’s average daily gross revenue, for example, record the results on your noteboard. Then you can easily compare the four values without having to memorize them.
You can apply these strategies to a sample question.
 For each of the following statements, select Yes if the statement is true based on the information provided in Figure 19-2. Otherwise, choose No.

Statement (A) references two columns, Price Per Meal and Neighborhood. Sorting by Neighborhood makes more sense because it lists all Downtown restaurants together so that you may better view and compare each Downtown restaurant’s price per meal. After you’ve sorted by Neighborhood, the table looks like this:
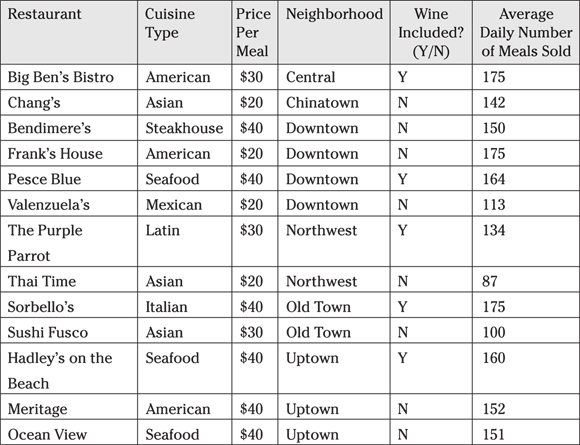
This arrangement allows you to see that two participating restaurants in the Downtown neighborhood charged $20 per meal and two charged $40 per meal. The number of $20 meals sold by both restaurants is 288, and the number of $40 meals sold at the two other restaurants is 314. To find the weighted average, multiply $20 by 288 and $40 by 314. Add the two products and divide by the total number of meals sold (602):
Because $30.43 is approximately $30, you can say that the average price of a Downtown meal was $30. The answer is Yes.
You’ve already figured out the second calculation for Statement (B). The average price per meal at a Downtown restaurant is about $30. You can write ![]() on your noteboard to remind you. All the Uptown restaurants charged $40 per meal, so the average price per meal in Uptown is greater than the average price in Downtown. Select No.
on your noteboard to remind you. All the Uptown restaurants charged $40 per meal, so the average price per meal in Uptown is greater than the average price in Downtown. Select No.
Statement (C) again focuses on one neighborhood, so you don’t have to resort to the table. The one restaurant that included wine in the meal price sold 160 meals on average per day, which is more than the 152 and 151 sold by the other two restaurants in the neighborhood. The answer is Yes.
 Table-analysis questions may not require that you use all the data provided. For example, you didn’t need to evaluate Cuisine Type for any of the question parts in the example question. Don’t worry if you don’t use the data in some columns at all. Part of the task in answering table-analysis questions is knowing what data is important and what’s irrelevant.
Two-part analysis
When you see a paragraph or two of information that sets you up to choose two pieces of information from a table with three columns, you know you’re dealing with a two-part analysis question. You select the answer for the first part of the question in the first column and the answer to the second part in the second column. The third column provides the set of possible answer choices for each part.
Reading the explanatory paragraph for these questions is absolutely essential. It provides the conditions you need to consider and clarifies what each part of the question asks for. Read each possibility in the third column carefully. Often, the differences among the options are subtle.
The GMAT usually uses the two-part analysis question to test mathematical skills (such as figuring functions and the properties of geometric shapes) and verbal logical reasoning abilities (such as strengthening and weakening arguments). Often the best way to figure out the answer for the math variety is to try each of the possible values to see which ones fulfill the requirements. Usually, the best way to answer the verbal type is by process of elimination.
The following two sample questions give you an example of a math two-part analysis and a verbal two-part analysis.
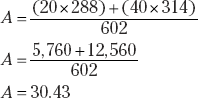
A set of expressions consists of a total of four expressions: these three expressions ![]() and one additional expression. From the following expressions, select the one that could be the fourth expression in the set and the one that could be the resulting arithmetic mean of the four expressions in the set. Make only one selection per column.
and one additional expression. From the following expressions, select the one that could be the fourth expression in the set and the one that could be the resulting arithmetic mean of the four expressions in the set. Make only one selection per column.

Approach this question by trying out the possible answer choices as potential fourth expressions to see which, when it’s included with other expressions in the set, results in an arithmetic mean that’s another of the possible answer choices.
First, evaluate the three provided expressions. All contain one-digit values that are multiplied by n and then have a one-digit value added or subtracted from that term. So evaluate similar expressions, such as Choices (B), (C), and (F) before you consider less similar expressions, such as Choices (A), (D), and (E).
If Choice (B), ![]() , were the fourth expression, the average mean of the set would be the result of applying the average formula:
, were the fourth expression, the average mean of the set would be the result of applying the average formula:
Because ![]() isn’t one of the answer choices, you know that
isn’t one of the answer choices, you know that ![]() can’t be the fourth expression.
can’t be the fourth expression.
Try Choice (C), ![]() . If you wrote your calculations for
. If you wrote your calculations for ![]() on your noteboard, you know that the first term of the average mean is the same because the 3n doesn’t change.
on your noteboard, you know that the first term of the average mean is the same because the 3n doesn’t change.

This value is a possible option. When the fourth expression in the set is ![]() , the average mean of the set is
, the average mean of the set is ![]() . Select Choice (C) for the first column and Choice (B) for the second. Only one possible set of answers exists, so if you’re confident about your calculations, you don’t have to consider the other expressions. Submit your answer and move on.
. Select Choice (C) for the first column and Choice (B) for the second. Only one possible set of answers exists, so if you’re confident about your calculations, you don’t have to consider the other expressions. Submit your answer and move on.
- Joseph: Health insurance premiums are growing at an alarming rate. This is, in part, because many hospitals and clinics bill for unnecessary diagnostics and tests that inflate the subsequent amount that insurers pay out to them. These expenses are then passed on to consumers in the form of increased insurance premiums. Therefore, reducing the number of unnecessary tests performed by hospitals and clinics will effectively curb the rise in health insurance premiums.
- Ronald: Often, the unnecessary diagnostics that you speak of are the result of decisions made by doctors on behalf of their patients. Doctors usually choose the diagnostics that allow them to bill insurers for more money but may not necessarily benefit the patient in a meaningful way or influence the course of treatment chosen. As a result, in order to succeed in reducing the number of unnecessary tests, patients should be allowed to decide which course of diagnostics they would like to undergo.
In the following table, identify the unique assumption upon which each argument depends. Make only one selection in each column: one in the first column for the best representation of Joseph’s assumption in his argument and one in the second column for the best representation of Ronald’s.

Whereas the sample math two-part analysis question required you to figure out the answers to both parts at the same time, this verbal-reasoning sample question is more easily handled one column at a time. First, consider the assumption that’s most likely part of Joseph’s argument. Then consider the one that pertains to Ronald’s.
The assumption is usually the statement that best links the premises of the argument to its conclusion. For details on evaluating arguments, see Chapter 6.
Following are the premises of Joseph’s argument:
- Hospitals and clinics are billing health insurance companies for unnecessary and expensive tests.
- This practice has caused health insurance companies to pay inflated rates to hospitals and clinics.
- The result is that health insurance companies are compensating by raising consumers’ health insurance premiums.
Based on these premises, Joseph concludes that reducing unnecessary tests will significantly control the rise in health insurance premiums.
To find the assumption that provides a link between the cessation of the unnecessary tests and a significant effect on increasing healthcare premiums, begin by narrowing your options. Joseph doesn’t mention doctors in his argument, so you can eliminate Choices (A) and (D). Choice (E) addresses healthcare premiums but not unnecessary tests, so it’s out. Choice (C) concerns other insurance industries, so it has nothing to do with Joseph’s argument about healthcare premiums. The best option for Joseph is the assumption that unnecessary tests make up a significant portion of insurance billing. If they make up just a small portion, eliminating tests wouldn’t have a significant impact on the rising cost of healthcare premiums. Mark Choice (B) in the column for Joseph.
Now evaluate Ronald’s argument. Here are his premises:
- Doctors order unnecessary tests to increase their earnings.
- Patients should be able to choose their tests.
- Putting the decision regarding diagnostics and tests in the patients’ control would reduce the number of unnecessary tests.
So you’re looking for the assumption that links patients’ decisions to fewer unnecessary tests.
Notice that Ronald doesn’t address healthcare premiums at all, so you can confidently eliminate Choice (E). Choice (B) is out because you’ve already attributed it to Joseph. Choice (C) doesn’t work for the same reason that it doesn’t work for Joseph. Ronald’s argument concerns only healthcare. Of the two remaining options (Choices [A] and [D]), only Choice (D) relates to patients’ decisions. Only if patients make decisions differently than doctors do would putting patients in control lessen the number of unnecessary tests. So you mark Choice (D) in the column for Ronald.
Graphics interpretation
Not surprisingly, graphics interpretation questions require you to interpret graphs. You may see line graphs, bar graphs, pie charts, Venn diagrams, and so on. Based on the information displayed in the graph, you fill in two separate blanks by selecting the best option from a drop-down menu for each blank. (In the example question later in this section, we include the answer options in parentheses.) You have to complete both blanks correctly to get credit for one graphics interpretation question.
The information you need to fill in the blanks comes primarily from the graph, so make sure you know how to read charts and graphs. Chapter 20 provides a review of the most common GMAT charts and graphs to refresh your memory.
Here are some other tips to help you efficiently move through graphics interpretation questions:
- Analyze the graph or chart to determine exactly what information it provides and how. Observe the labels and examine the numerical increments carefully.
- Click on Select One to view all the answer options. To see the possible answers in the drop-down menu for each blank, you have to click on the box that says Select One. Filling in the blank is much easier when you’re limited to just the several available choices. Don’t attempt to answer the question without seeing the answer choices first.
- Eliminate illogical answer choices. Approach the two parts of a graphics interpretation question much like you would a standard multiple-choice question. Eliminate obviously incorrect options and use your reasoning skills to select the best answer from the remaining choices.
- Make estimations. The data in charts and graphs are rarely precise, so most of your calculations are estimates or approximations that you can work out on your noteboard or in your head rather than on the calculator.
Here’s a sample graphics interpretation question to consider.
Scientists, health professionals, and life insurance agents are interested in examining the percentage of people in a population who will live to a certain age. One way to measure this information is to look at the percentage of the population who has died after a certain number of years. The following graph displays the results of such a study.

Approximately _____ (10, 40, 60, 80) percent of the population lives to at least 80 years of age. A person who was a member of the study population would still have an 80 percent chance of being alive at around a maximum age of _____ (15, 35, 55, 80) years.
Filling the first blank in the question tests your graph-reading skills. Find 80 years of age on the horizontal axis. Move your finger from the 80-year mark upward on the graph until you reach the plotted curve. Move your finger to the left to see that at 80 years, about 60 percent of people have died. Don’t stop there and choose 60 percent, however. The question asks for how many are alive at the 80-year mark. Subtract 60 from 100 to get that approximately 40 percent of the population lives to at least 80 years. The correct answer is 40 percent.
To complete the second blank, make sure you look at the answer choices first. Because the statement concerns the maximum value, consider higher ages first. The oldest option is 80, but it’s very unlikely that 80 percent of people are alive at age 80, so try the next highest age, 55. Move along the graph until you reach 55 years. At 55 years of age, 20 percent have died, leaving a maximum of 80 percent alive. Ages above 55 can’t be right, so 55 is the correct answer.
If you start with the first option of 15 years, you may be misled. Note that the graph shows you that at about 15 years of age, less than 5 percent of people have died, which means that more than 95 percent of the population are still alive. That’s more than 80 percent, but the statement regards the maximum age where 80 percent of the population is still kicking, so 15 can’t be correct.
Multi-source reasoning
The only IR question type with more than one question that pertains to a set of data is the multi-source reasoning question. For this question type, the GMAT presents different kinds of information in a series of two or three tabs. Each tab conveys a relevant aspect of a set of circumstances. The topics of the scenarios vary greatly. You may have information concerning a certain scientific phenomenon, such as black holes or plant photosynthesis, or you may be asked to apply data that relates to business situations, such as hiring decisions or event planning.
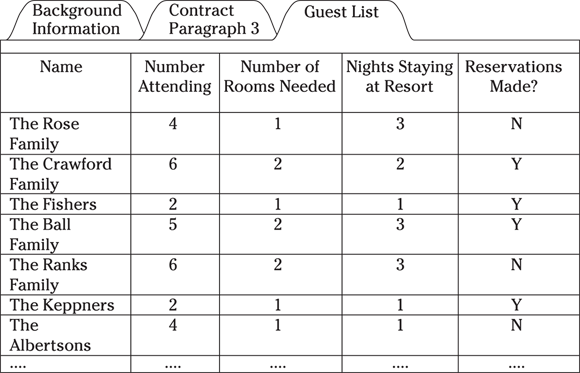
At least one of the tabs in the set contains several paragraphs of written information on a subject. Others may contain additional paragraphs or data contained in tables, charts, or graphs. You use the resources in all tabs to answer several questions, most of which have several parts. For example, Figure 19-3 shows you the first tab for a sample multi-source reasoning scenario regarding guest reservations for a hotel’s wedding block. The e-mail in this tab sets up the situation and provides you with the guidelines for the reservation.

© John Wiley & Sons, Inc.
FIGURE 19-3: Sample multi-source reasoning format, background tab.
Figure 19-4 shows what you find when you click on the second tab: language from the contract between the Pearson family and the resort.

© John Wiley & Sons, Inc.
FIGURE 19-4: Sample multi-source reasoning format, contract tab.
When you click on the final tab, you may see a table with relevant data, such as the one in Figure 19-5, which shows the wedding guest list and their reservation status.
© John Wiley & Sons, Inc.
FIGURE 19-5: Sample multi-source reasoning format, guest list tab.
The multi-source reasoning questions appear in one of two formats: three-part table (similar to table-analysis questions) or standard five-answer multiple-choice. Keep in mind that you have to answer all three parts of the first format to get credit for the one question. The multiple-choice format may be one of the easiest questions to answer in the IR section. You can use the process of elimination to narrow the answers, and you have to choose only one correct answer to get full credit for the question.
The trickiest aspect of answering multi-source reasoning questions is sifting through the plethora of information to discover what’s relevant. Depending on the scenario, you may have to juggle information in tables, diagrams, articles, and so on to come up with correct answers.
Here are some pointers to help you with the task:
- Summarize each tab. As you read through the information in each tab for the first time, record pertinent points to help you remember which tab holds what type of data. That way you don’t have to continually flip back and forth between screens as you answer questions. For example, summarize the contract details in Figure 19-4 on your noteboard with quick notations such as 9/7, 8, & 9 = $135/night; < 3 nights = $150/night; before/after 9/7 or 9/9 = $175/night.
- Make connections. After you’ve seen the information in each tab, synthesize facts and figures from one tab with correlative data from another. Keep track of your findings on your noteboard. For example, you should notice as you read the information in Figures 19-4 and 19-5 that you can correlate the data in the table in the final tab with the room-charge specifications in the second tab to figure out how much each guest will pay for resort rooms.
- Rely on what the test gives you. Some of the topics in multi-source reasoning scenarios may be familiar to you. Although familiarity may make the information more accessible to you, it may also influence you to answer questions based on what you know instead of what the exam tells you. For example, you shouldn’t answer any questions about the Pearson wedding sample scenario based on what you know about hotel booking from your own experience as a front-desk manager.
Here’s another sample multi-source scenario with a couple of questions to help you get more acquainted with the question type. This scenario has only two tabs, each conveying an opposing opinion from two scientists on a specific scientific phenomenon.


Consider each of the following statements about atmospheric carbon-dioxide levels and determine whether Scientists 1 and 2 are both likely to agree by marking either Yes or No:

Statement (A) is a nice, noncontroversial statement with which both scientists would agree. Scientist 1 stresses that rising carbon dioxide is linked to higher temperature (another factor), while Scientist 2 discusses feedback factors, which are factors that respond to carbon-dioxide changes and will, in turn, affect the carbon dioxide. Select Yes for Statement (A).
To answer Statement (B), notice that Scientist 2, who refers to improved energy technology, clearly disagrees with the statement, but so does Scientist 1, who mentions the possibility that carbon-dioxide levels will stabilize. Neither scientist would agree with Statement (B), so the answer is No.
Scientist 2 disagrees with Statement (C) and actually discusses a slowing down in the rate of carbon-dioxide-level increase. Because at least one of the scientists would disagree with the statement, the answer to Statement (C) is No.
The next question is in multiple-choice format.
Which of the following statements does only Scientist 1 support?
(A) A change in atmospheric water vapor could significantly affect global temperatures.
(B) The increase in atmospheric carbon-dioxide concentration from 280 parts per million to 360 parts per million that has occurred over the last 150 years is not expected to affect climactic change negatively in the future.
(C) Recent increases in atmospheric carbon dioxide have surpassed those predicted by temperature models dealing solely with carbon-dioxide models.
(D) Temperature fluctuations will match carbon-dioxide changes when carbon-dioxide changes are abrupt.
(E) Increases in carbon-dioxide concentration would lead to changes in feedback factors that would compound any temperature increase associated with more carbon dioxide in the atmosphere.
Focus on the information in the first tab. Scientist 1 mentions a match between carbon dioxide and temperature variations and then uses the recent large change in carbon-dioxide levels as evidence that significant changes in temperature will occur. Scientist 1 goes on to discuss how continued sharp increases in atmospheric carbon dioxide will lead to similar dramatic temperature increases. Scientist 1 implies that the recent carbon-dioxide changes have been unprecedented. The data during the past 160,000 years show a correspondence between temperature and carbon-dioxide fluctuations, but this correspondence has occurred in the absence of the dramatic changes the earth is now and soon will be experiencing. For Scientist 1 to use the fluctuation correspondence as evidence for what will soon happen, she must assume that the correspondence will continue in light of current and near-future sharp changes. So Choice (D) is correct.
Choice (A) is supported by Scientist 2, and neither scientist would support Choices (B), (C), or (E). In fact, Scientist 1 actually says that an increase in atmospheric carbon-dioxide concentration from 280 parts per million to 360 parts per million can cause “significant and detrimental climactic changes in the near future.”