
"We're a logging company that just happen to stream video" | ||
| --A member of the Netflix team | ||
I was once attending a technical talk when I heard the preceding quote. We're all familiar with Netflix, the streaming service, but to a member of their team, they consider themselves a logging company that just serves video. I think this is a great way of highlighting the importance of logs.
If you're planning on running any application in a production environment, having quality logging is absolutely paramount, as it will be one of your only means of visibility into what is happening in the production environment, or of went wrong if you find a server crashing without explanation. If you've ever had to diagnose a production issue before, you'll exactly understand the importance of having quality logs.
There are some criteria that a good logging system should have; for one, logs must be time-stamped and readable for both us humans and for machines. There is also so much we can ascertain by looking directly at logs—this is where machine-readable logs come in, as you'll need the ability to analyze and get statistics on the occurrences of particular events.
Moreover, a good logging system will provide easy access to your logs. Really, they should not be stored on the server in which an application is running. If that server somehow goes up in smoke, so do your precious logs.
hapi has some core support for logs, with the server.log() and request.log() APIs, but I rarely see these used, as hapi's logging is mainly done through the good module (https://github.com/hapijs/good).
The module good is described as a process monitor rather than a logging tool, which is a better description. It works by listening to events from a hapi application, and then pushes those events to external reporters configured within the application. Some example reports officially maintained by the hapi team are as follows:
good-udp: It broadcasts events to a remote endpoint via udpgood-file: It writes events to a file on the local filesystemgood-http: It broadcasts events to a remote endpoint via aPOSTrequestgood-console: It writes events to the local console
There are also some reporters created by the community, some of which push to third-party log management services. You can find a list of these on the good repository, README.
Let's now look at integrating good to set up some logging for an application. Let's just create an index.js file, and add the following:
const Hapi = require('hapi');
const Good = require('good');
const server = new Hapi.Server();
server.connection({ port: 1337, host: '127.0.0.1' });
server.route({
  path: '/',
  method: 'GET',
  handler: function (request, reply) {
    return reply({ message: 'test' });
  }
});

const goodOptions = {
  opsInterval: 3000,
  reporters: [
    {
      reporter: require('good-console'),
      events: { ops: '*', response: '*', error: '*' }
    }
  ]
};

server.register({ register: Good, options: goodOptions }, (err) => {

  if (err) {
    throw err;
  }

  server.start((err) => {
    server.log(['start'], 'Server started');
    console.log(`Server running at ${server.info.uri}`);
  });
});
Hopefully, by now you're familiar with this setup of requiring and registering a plugin against our hapi server. This time, we register the good module with some extra configuration in which we configure the good-console reporter to report on the following event types:
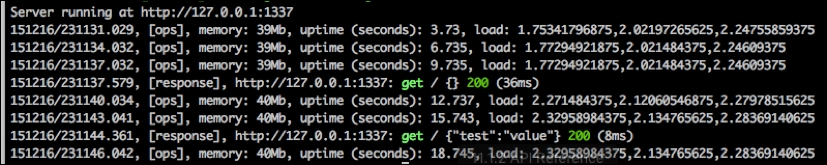
ops: This is operational data such as RAM and CPU usage. This logs every 3 seconds as specified by theopsIntervalsetting.response: This is information relating to the request and response received by the server.error: This logs information for any requests that return an internal server.
The string following each event type is a filter. Any strings passed in here will filter what is logged by that tag. A value of * indicates that no filter is to be applied. If you launch that application, you will find that a host of useful information is now being logged to the console between the operational and request data, as shown in the following screenshot:
I will leave it as an exercise for you to modify this example so that it throws an error. This way, you can view the detailed logging information for when it happens. I would also recommend trying to add some file logging using good-file as a worthwhile exercise.