7
Dancing stocks and risky numbers: Why the stock market moves and how to navigate risk
If you've ever paid any attention to stock market news, you know it can be extremely sensationalised. And that's coming from a stock market columnist herself! There are a lot of big words used to overcomplicate how the stock market is moving, and small dips of 1 or 2 per cent suddenly become ‘looming crashes’ with ‘millions wiped out’.
The day of 12 March 2020 started off with a sunny morning. Before jumping out of bed, I checked my phone and scanned through the markets on my apps. It was three days after the US had declared travel bans due to the growing COVID‐19 pandemic, when both the US stock market and the UK's FTSE 100 suffered from the greatest single‐day percentage fall since the 1987 stock market crash. The Canadian S&P/TSX had also dropped 12 per cent — its largest fall since 1940.
Still cosily wrapped up in my duvet, I dropped a bit more money into the S&P 500 and Tesla (which at the time wasn't part of the S&P 500 just yet) through an app on my phone. I always like to keep some cash ready for any drops. Then I got out of bed and got ready for work. I didn't realise it was the bottom of the market — that's impossible to tell until after the fact, anyway — and frankly I didn't care.
For a long‐term investor, markets will go up and down, it's just what happens.
The media, on the other hand, was having a field day: ‘Global stock markets post biggest falls since 2008 financial crisis’, ‘Hundreds of billions wiped off values of indexes’ and so on.
Let's talk about this. When news articles say things like ‘hundreds of billions of dollars were wiped off the value of indexes’, it sounds like many people must have lost their life savings, or at least a significant chunk of their money, during the drop. It sounds like people had to sell their homes to cover their losses and go live in their cars.
Yet the infamous 12 March 2020 crash saw the S&P 500 drop 9.5 per cent in a day. If you had a $100 000 portfolio in a well‐diversified fund, you only lost $9500 in value. Someone with $100 000 to invest is not going to sweat over less than $10 000. What's more, that money wasn't ‘wiped out’. Unless they panicked and sold their entire portfolio right then, they hadn't lost anything. These ‘losses’ would eventually recover once the market recovered. In this case, the market very quickly returned to pre‐crash levels. In fact, some of the world's richest people saw their wealth double during the pandemic.
This hyper sensationalised perspective of market drops feeds into the curiosity and fear everyday people have about the stock market — and into the idea that it's risky and basically like gambling.
Why the market moves
The truth is that it's normal for markets to move. It's to be expected. There are 9.5 per cent drops from time to time. A market correction of around 10 per cent occurs every two years; a bear market, where the market falls 20 per cent, occurs about every seven years; and a crash of 30 per cent occurs every 12 years.
Let's take a step back. Why do stock prices dance around so much in the first place?
Have you ever looked at the movement of the market in a single day? Look at figure 7.1. What happened between 2 pm and 4 pm to cause that change in the stock price?
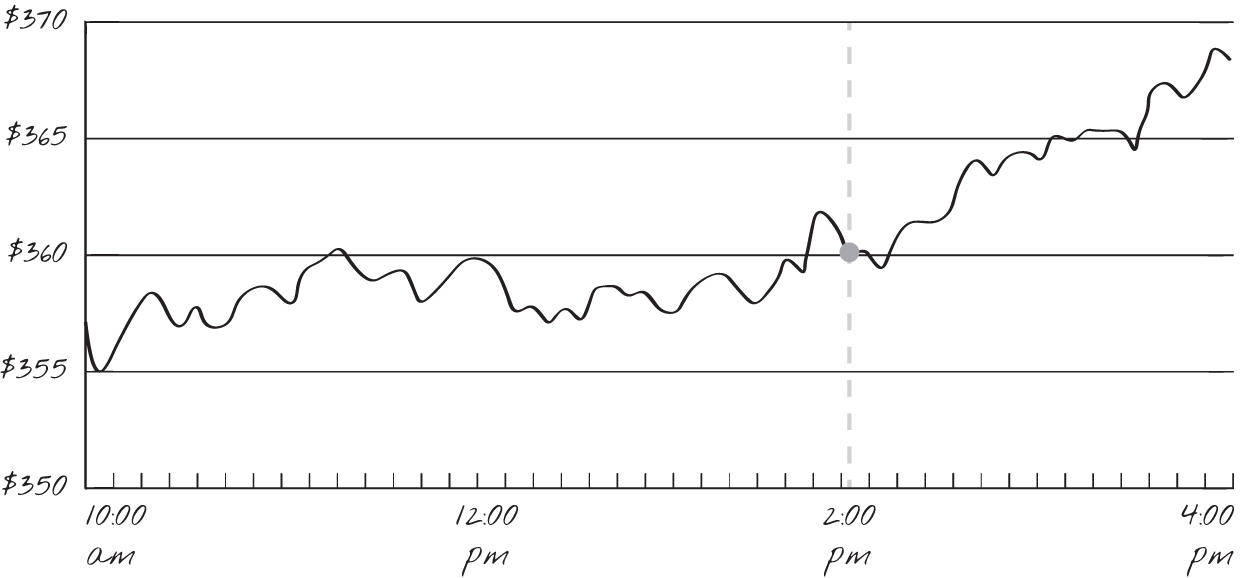
Figure 7.1: daily price movement of a stock
There are three main causes for stock and fund price fluctuations:
- supply and demand
- company earnings
- investor sentiment.
Supply and demand
If you have 10 lollipops for $1 each, and 10 people want them, the lollipops will sell for $1. Simple enough. But if you had 10 lollipops and 100 people wanted them, people would start bidding higher for a lollipop. Naturally the price of the lollipop would rise, and keep rising until it reached the price the hungriest person was willing to pay.
If you had 10 lollipops for $1 each but only four people wanted them, the four people would likely be able to negotiate the price down with the seller, as there is more supply than demand. This is how stock prices change. They move by what we call ‘market force’. There is a finite number of stocks that are available to purchase, and if more people want to buy a stock of Apple than the number of shares available, the price of Apple goes up; if fewer people want to buy than the numbers of shares outstanding, the share price goes down.
Company earnings
Every three months companies release a report, known as ‘company earnings’, to say how their company has performed. They release financial statements that show their balance sheet (their assets and debts), their cash flow (how money moves within the company) and their income (how much money they made, how much they spent and what the bottom line is).
Company earnings are a bit like a report card, and you, the investor, decide if it's satisfactory (see figure 7.2). Company earnings basically determine if investors pat themselves on the back and invest more into the company, or pull money out. Companies all release earning reports around the same time; they're called earning seasons (a bit like exam periods).
A long‐term investor, however, isn't too fussed with earning season unless something fundamentally changes within a company. It can be confusing if a company performs well in its earnings report yet its stock price is dropping. After all, shouldn't the stock price go up if the company is doing well? This is the beauty of the market. What distinguishes a speculative investor from an investor in training is that the former will react to what's currently happening with the company, but the latter will react to the future outlook for the company. Rather than looking at company Y and thinking that if the value is going up currently it will continue to go up, investors in training take into account both the company's performance and its future outlook, with its announcements of new products or ventures.
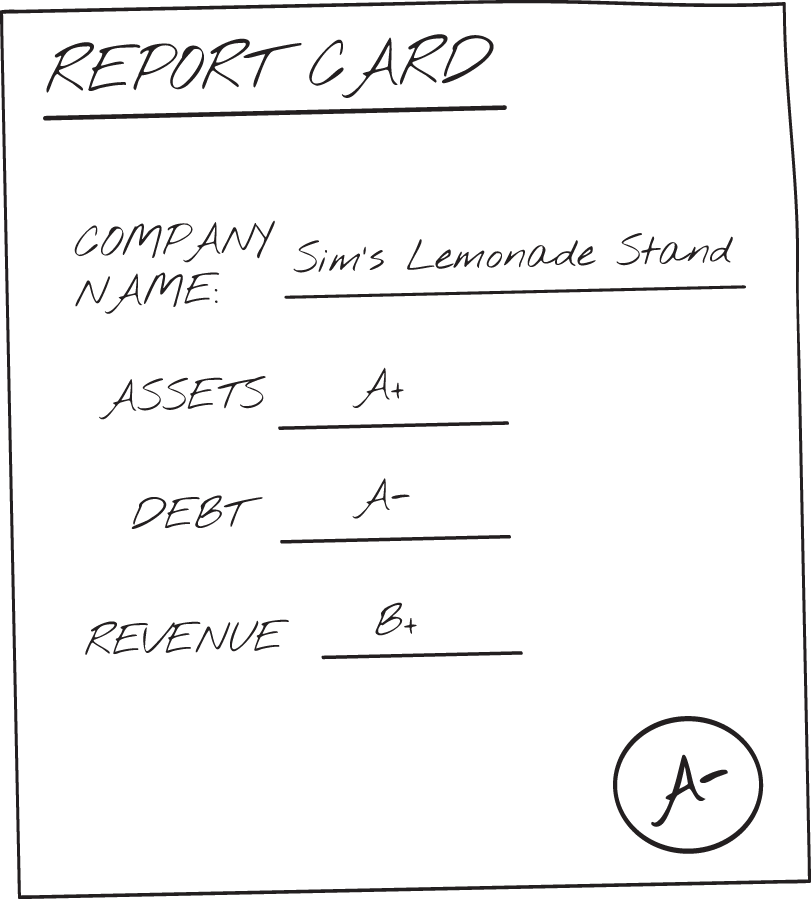
Figure 7.2: company report card
For example, Meta saw a rise in company revenue from $28 billion to $33 billion — that's a feat during a pandemic, right? Yet Meta shares plummeted by 20 per cent the same day. Why? Well, in their 2022 earning report they announced that TikTok, a newer social media platform, was now serious competition to Meta. Investors reacted to the potential future of the company, not to its current state.
Investor sentiment
This is the overall attitude investors have towards a particular company or market. You could describe it as the gut feeling investors have about the market.
When investors feel optimistic about the market, they're said to display a ‘bullish market sentiment’. And when they feel pessimistic, they display a ‘bearish market sentiment’.
A bull market is one when stock prices are rising, and investors feel good. Overall, people are encouraged and happy to invest. It's like love is in the air, but for stocks. A bull market is defined as a moment when the market is up 20 per cent after two drops of 20 per cent, and it's named after the upwards motions bulls make when they fight.
A bear market is the opposite. It feels depressing. Stocks are down. Morale is low. People are scared and less likely to invest. It occurs when the entire market is down 20 per cent for at least a two‐month period. Prices drop quickly. It's named after the downward swiping of their paws when bears fight. (Look, I don't really see it either. Let's move on.)
The macro factors of market movements
One of the best ways to avoid feeling uneasy during market fluctuations is to understand why markets are behaving the way they are. There are macro and micro factors (such as tax and regulations) that can cause a market to act the way it does. The most important to consider are these four macro factors:
- economic growth
- unemployment
- inflation
- high interest rates.
Economic growth
The overall health of the economy can affect the stock market. A good economy is where there is more spending: more people are going to malls and shopping. More people are going to restaurants and dining out. This leaves businesses with more revenue and hopefully more profit. Strong business growth then causes greater investor confidence and increases share prices.
Stocks that get affected by economic growth are known as cyclical stocks. These are stocks such as luxury resorts, hotels or aeroplanes; they do well when people want to spend money, and don't do so well when people are tight on money. ‘Secular stocks’, on the other hand, do well regardless of how the economy is doing. They're companies people need no matter what. The most common example is how people never stopped buying toilet paper, even during a pandemic.
Unemployment
Unemployment also affects the stock market. If there are more unemployed people, there is lower consumer spending and therefore reduced earning capacity for companies. However, there are still some stocks that perform well during high rates of unemployment. Consumer staples and defensive sectors (and no, I don't mean the army — I mean sectors that have stocks that provide dividends and earnings even in poor markets), as well as industries such as healthcare and utilities, are much better at weathering unemployment and recessions in general.
Inflation
We don't love inflation. Turns out, companies don't like it either.
Remember my lemonade stand from chapter 4? If there is high inflation, as an owner it now costs me more to buy lemons, cups and sugar. This means either I have to increase the price of my lemonade, which will decrease business as not everyone will want to pay $5 instead of $2 for a glass, or allow the increased costs to eat into my profit. This reduced earning capacity results in reduced stock prices for Sim's Lemonade Stand.
While my lemonade stand stock may be suffering, some stocks do well during inflation. Again, consumer staples, but also gold stocks, healthcare and material stocks benefit from inflation.
High interest rates
In 2020 and 2021, the US stock market rallied (which means it did really well) with a 16.26 per cent and 26.89 per cent return, respectively. One of the biggest contributors to this was that the Fed (the Federal Reserve Bank, which you can imagine as a group of people who decide the interest rates in the US, among other things), decided to drop interest rates significantly to stimulate economic growth. When you reduce interest rates, borrowing money suddenly gets ‘cheaper’ for people and businesses. This, in turn, encourages investing.
Changes in interest rates by the Fed take months, even sometimes a year after they're announced to go into effect, but funnily enough, the reaction from investors in the market is almost immediate.
High interest rates on the other hand mean borrowing money becomes more expensive. Companies must make higher payments for their business loans, and consumers have to spend more to pay off higher interest rates for mortgages, car loans and credit card debt. As a result, consumers spend less and companies make less. Which results in a drop in the stock price.
Stocks that do well with high interest rates are in the financial sector — banks, mortgage companies and insurance companies thrive. Remember, with higher interest rates on loans, the companies that provide the loans in the first place now get to ask for more money back.
A rule of thumb: you don't want to fight the Fed. If the Fed says interest rates are going up, the stock market usually takes a hit. When they say rates are going down, stocks jump back up.
Risky business
When it comes to the stock market it's important to understand the levels of risk involved. No investment type is completely risk free, not even a trusty blue‐chip stock (those stable companies we all love, like Coca‐Cola and Disney). The important thing about investing is aligning the risk of the types of investments to your personal risk tolerance (which you can work out with the quiz in ‘Putting it all together’). It's all about doing what helps you sleep easier at night.
Risks based on macro and micro factors
There are a number of risks involved in investing:
- market risk: the risk that your stocks might drop in value due to something affecting the market, for example, shares fluctuating (equity risk) or interest rates fluctuating (interest risk) or the possibility of exchange rates changing (currency risk)
- liquidity risk: the risk that it's difficult to sell your shares when you want to
- concentration risk: accidentally keeping all your eggs in one basket (e.g. just owning airline stocks when COVID‐19 hits)
- credit risk/default risk: the risk that the company you give money to (e.g. as a bond or if you lend money to a startup) can't pay you back
- reinvestment risk: if you reinvest the money you made with your original profits, but your profits now come at a lower rate (this usually happens with bonds)
- inflation risk: the risk of your investments not keeping up with inflation
- horizon risk: the risk that your investing goals change (e.g. losing a job and needing the money sooner)
- longevity risk: the risk of outliving your savings
- foreign exchange risk: the risk of investing in a country outside of your own; this covers currency risk, interest rate risk and political changes that may not affect your home country, but affect the country you're investing in.
Risk based on numbers
So how does one measure risk? There are a number of ways and calculations, but I'm going to give you the most common way since you're an investor in training.
If you see a company and you want to determine how volatile or risky it is compared to other stocks, I have a fairy godmother to help you. Her name is Beta.
Beta is a stock ratio that determines how risky or volatile a company is compared to others (see figure 7.3).
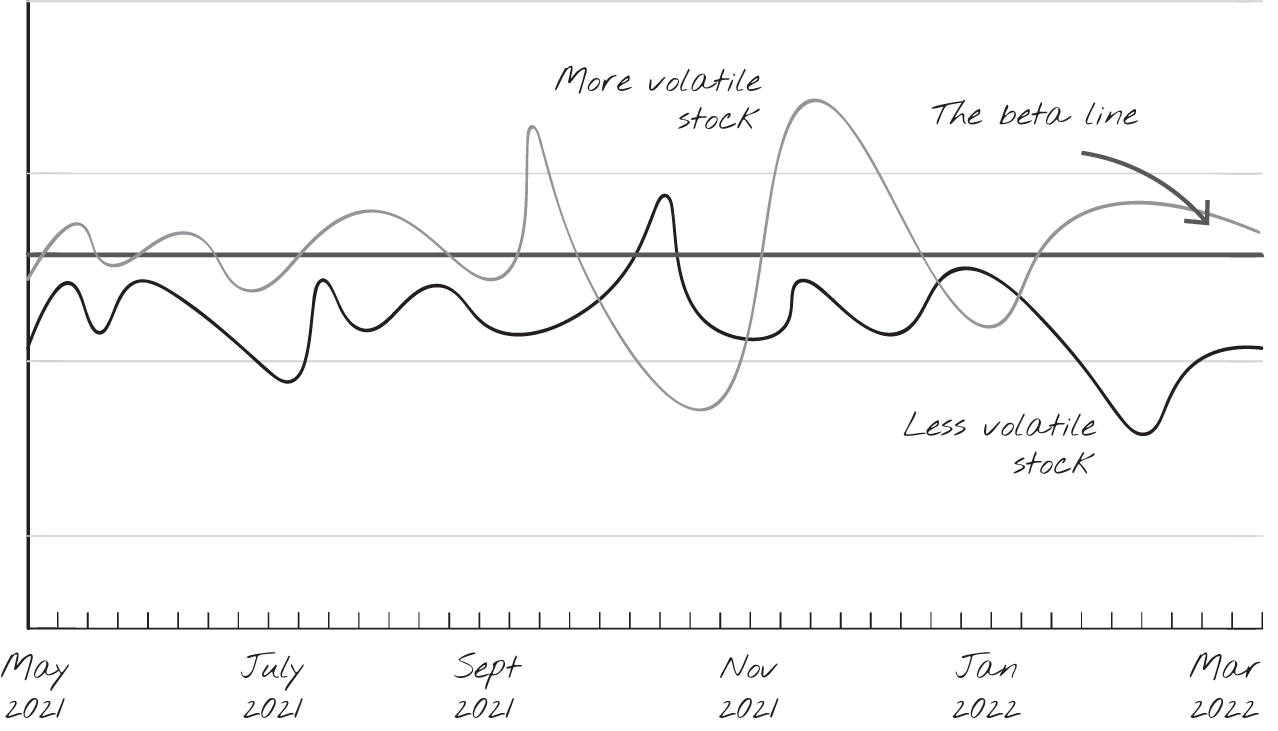
Figure 7.3: how beta works
Remember how we use the S&P 500 as the benchmark of what normal fluctuation is? We give the S&P 500 a beta of 1.
This is our benchmark: 1. Any stock or fund with a beta of:
- more than 1 is more volatile than the overall market
- less than 1 is less volatile than the overall market
- equal to 1 is just as volatile as the overall market.
So basically, if Tesla had a beta of 2, it is twice as volatile as the S&P 500. If the S&P 500 went up 10 per cent you'd expect Tesla stock to go up 20 per cent.
But if the S&P 500 dropped 9 per cent, you'd expect Tesla to drop 18 per cent. Higher risk higher reward, remember.
You can also use beta to compare two companies you may be weighing up (you can simply search for the companies' betas online rather than figuring out how to calculate it on your own). If you want the less risky option, you choose the one with the lower beta.
Risks based on timelines
Risk can also be assessed based on the amount of time you're planning to hold your investment portfolio.
Figure 7.4 (overleaf) is what the Russell 2000, an index filled with 2000 small‐cap companies, looked like in one year: lots of ups and downs. If you started in Feb 2021, and needed the money a year later, you would have made a loss.
If you're investing for a longer period of time, the risk of losing money drops. Figure 7.5 (overleaf) shows the same fund over an 18‐year period; those weekly/daily bumps in the market are smoothed out.
When it comes to investing in broad market index funds, the shorter the time frame you have to work with, the higher the risk. As a result, investors in training choose what they invest in based on their time frame.
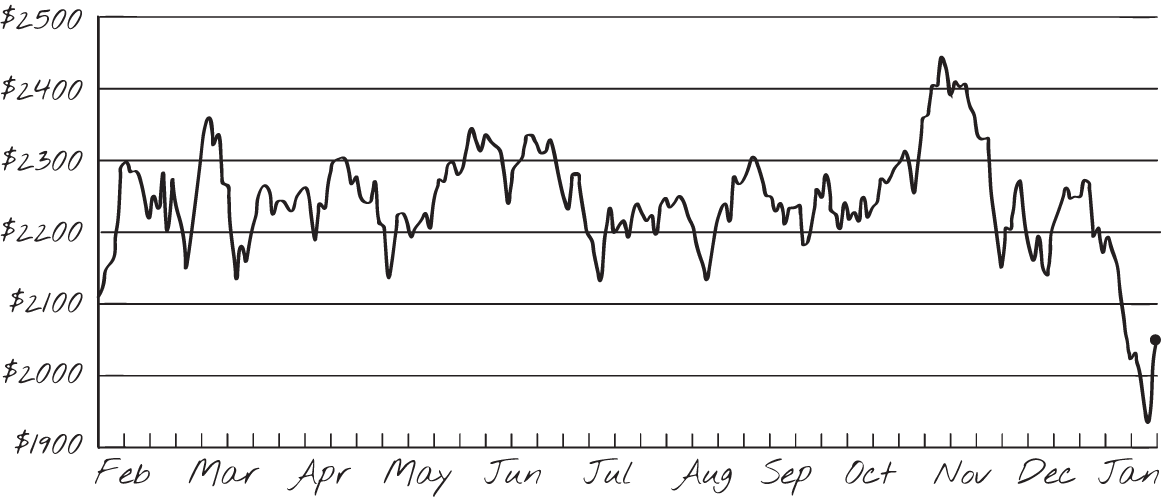
Figure 7.4: Russell 2000 from February 2021–February 2022
Source: Based on data from Yahoo Finance
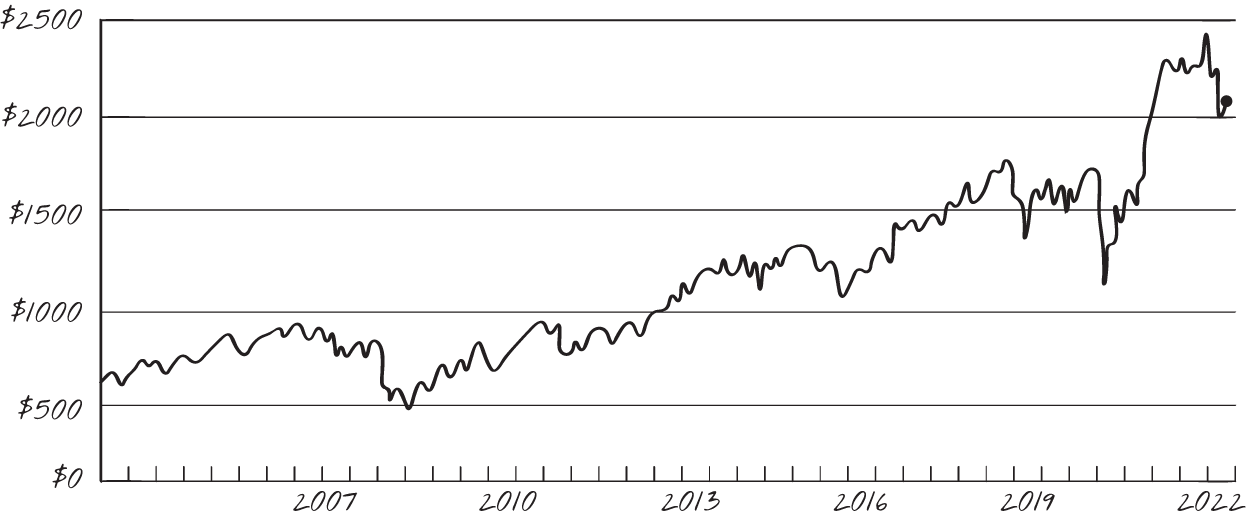
Figure 7.5: Russell 2000 from 2004–2022
Source: Based on data from Yahoo Finance
- Investing for 1–3 years: Choose cash or cash equivalents and bonds. Investors in training know that if they need the money in the next one to three years, they shouldn't put it in the stock market due to the short‐term fluctuations.
- Investing for 3–10 years: Choose bonds and funds for diversification. Investors in training may choose a few individual stocks based on their risk tolerance.
- Investing for 10–20‐plus years: Choose bonds, funds and individual stocks based on their risk tolerance. Investors in training investing over the long term have a portfolio that can handle some riskier investments (e.g. growth stocks) as time is ‘more forgiving’.
***
One of the best ways to mitigate risk is by understanding your risk profile, because not all stocks and funds are created equally. Once you've decided what you're investing for and how long you're investing for, you can work backwards to decide what you want to invest in.
Risk is one factor to determine your approach to investing, but you can also apply different strategies, which are covered in the next three chapters.
