From Superstorms to Factory Fires
Managing Unpredictable Supply-Chain Disruptions. by David Simchi-Levi, William Schmidt, and Yehua Wei
TRADITIONAL METHODS FOR managing supply chain risk rely on knowing the likelihood of occurrence and the magnitude of impact for every potential event that could materially disrupt a firm’s operations. For common supply-chain disruptions—poor supplier performance, forecast errors, transportation breakdowns, and so on—those methods work very well, using historical data to quantify the level of risk.
But it’s a different story for low-probability, high-impact events—megadisasters like Hurricane Katrina in 2005, viral epidemics like the 2003 SARS outbreak, or major outages due to unforeseen events such as factory fires and political upheavals. Because historical data on these rare events are limited or nonexistent, their risk is hard to quantify using traditional models. As a result, many companies do not adequately prepare for them. That can have calamitous consequences when catastrophes do strike and can force even operationally savvy companies to scramble after the fact—think of Toyota following the 2011 Fukushima earthquake and tsunami.
To address this challenge, we developed a model—a mathematical description of the supply chain that can be computerized—that focuses on the impact of potential failures at points along the supply chain (such as the shuttering of a supplier’s factory or a flood at a distribution center), rather than the cause of the disruption. This type of analysis obviates the need to determine the probability that any specific risk will occur—a valid approach since the mitigation strategies for a disruption are equally effective regardless of what caused it. Using the model, companies can quantify what the financial and operational impact would be if a critical supplier’s facility were out of commission for, say, two weeks—whatever the reason. The computerized model can be updated easily and quickly, which is crucial since supply chains are in a continual state of flux.
In developing and applying our model at Ford Motor Company and other firms, we were surprised to find little correlation between how much a firm spends annually on procurement at a particular site and the impact that the site’s disruption would have on company performance. Indeed, as the Ford case study described later in this article shows, the greatest exposures often lie in unlikely places.
In practice, that means that leaders using traditional risk-management techniques and simple heuristics (dollar amount spent at a site, for instance) often end up focusing exclusively on the so-called strategic suppliers for whom expenditures are very high and whose parts are deemed crucial to product differentiation, and overlooking the risks associated with low-cost, commodity suppliers. As a result, managers take the wrong actions, waste resources, and leave the organization exposed to hidden risk. In this article, we describe our model and how companies can use it to identify, manage, and reduce their exposure to supply chain risks.
Time to Recovery and the Risk Exposure Index
A central feature of our model is time to recovery (TTR): the time it would take for a particular node (such as a supplier facility, a distribution center, or a transportation hub) to be restored to full functionality after a disruption. TTR values are determined by examining historical experience and surveying the firm’s buyers or suppliers (see the sidebar “Assessing Impact? Use a Simple Questionnaire”). These values can be unique for every node or can differ across a subset of the nodes.
Our model integrates TTR data with information on multiple tiers of supplier relationships, bill-of-material information, operational and financial measures, in-transit and on-site inventory levels, and demand forecasts for each product. Firms can represent their entire supply network at any level of detail—from individual parts to aggregations based on part category, supplier, geography, or product line. This allows managers to drill down into greater detail as needed and identify previously unrecognized dependencies. The model can account for disruptions of varying severity by running scenarios using TTRs of different durations.
To conduct the analysis, the model removes one node at a time from the supply network for the duration of the TTR. It then determines the supply chain response that would minimize the performance impact of the disruption at that node—for instance, drawing down inventory, shifting production, expediting transportation, or reallocating resources. On the basis of the optimal response, it generates a financial or operational performance impact (PI) for the node. A company can choose different measures of PI: lost units of production, revenue, or profit margin, for instance. The model analyzes all nodes in the network, assigning a PI to each. The node with the largest PI (in lost sales, for instance, or lost units of production) is assigned a risk exposure index (REI) score of 1.0. All other nodes’ REI scores are indexed relative to this value (a node whose disruption would cause the least impact receives a value close to zero). The indexed scores allow the firm to identify at a glance the nodes that should get the most attention from risk managers.
At its core, the model uses a common mathematical technique—linear optimization—to determine the best response to a node’s being disrupted for the duration of its TTR. The model accounts for existing and alternative sources of supply, transportation, inventory of finished goods, work in progress and raw material, and production dependencies within the supply chain.
Our approach provides a number of benefits. It:
Identifies hidden exposures
The model helps managers identify which nodes in the network create the greatest risk exposure—often highlighting previously hidden or overlooked areas of high risk. It also allows the firm to compare the costs and benefits of various alternatives for mitigating impact.
Avoids the need for predictions about rare events
The model determines the optimal response to any disruption that might occur within the supply network, regardless of the cause. Rather than trying to quantify the likelihood that a low-probability, high-risk event will strike, firms can focus on identifying the most important exposures and putting in place risk-management strategies to mitigate them.
Reveals supply chain dependencies and bottlenecks
Companies can also use the analyses to make inventory and sourcing decisions that increase the robustness of the network. This includes taking into account the likely scramble among rival companies to lock in alternative sources if a supplier’s disruption affects several firms. Such cross-firm effects of a crisis are often overlooked. Contracts with backup suppliers can be negotiated to give a company priority over others should a disruption with the primary supplier occur, which would decrease time to recovery and financial impact.
Promotes discussion and learning
In the course of analyzing the supply chain in this way, managers engage in discussions with suppliers and internal groups about acceptable levels of TTR for critical facilities and share insights about best-practice processes to reduce recovery time. As a result, the impact of disruptions is minimized.
Prescriptive Actions
Our model provides organizations with a quantitative metric for segmenting suppliers by risk level. Using data generated by the model, we can categorize suppliers along two dimensions: the total amount of money that the company spends at each supplier site in a given year, and the performance impact on the firm associated with a disruption of each supplier node. Let’s now take a look at the supplier segments and consider the risk-management strategies appropriate for each.
Obvious high risk
Most companies focus their risk-management activities on suppliers for whom total spend and performance impact are both high. Typically, these are the suppliers of expensive components, such as car seats and instrument panels, that strongly affect customers’ purchase decisions and experience. The cost of these “strategic components,” as they’re frequently called, often make up a large portion of the total manufacturing cost. Indeed, for many companies, they represent 20% of the suppliers but account for about 80% of a firm’s total procurement expenditures. Because strategic components typically come from a single supplier, appropriate risk-mitigation strategies include strategic partnering with the suppliers to analyze and reduce their risk exposure, providing incentives to some suppliers to have multiple manufacturing sites in different regions, tracking suppliers’ performance, and developing and implementing business continuity plans.
Low risk
Suppliers with low total spend and low financial impact do not require intense risk-management investment. In our experience, most companies effectively manage the minimal risks from disruptions of these supplier sites by investing in excess inventory or negotiating long-term contracts with a penalty clause for nonperformance.
Hidden risk
Many companies, however, are subject to considerable exposure from “hidden risk” suppliers. Here, total spend is low but the financial impact of a disruption is high. Even the savviest managers are prone to equating total spend with performance impact: They rightly identify strategic components as carrying high levels of supply chain risk, but fail to consider that low-spend suppliers, often of commodity goods, may represent outsize risks. Traditional risk-assessment exercises overlook these components because they are perceived as adding little value to the firm’s products. But the reality is that markets for commodity goods are typically dominated by only a few manufacturers, leaving purchasers susceptible to disruptions. For example, in the automotive industry, a carmaker’s total spend on suppliers of O-rings or valves is typically quite low, but if the supply is disrupted, the carmaker will have to shut down the production line. Thus, it is critical to ensure that an adequate supply is available. That can often be accomplished using the strategies that apply to the other segments: investing in excess inventory, requiring suppliers to operate multiple production sites, or implementing dual-sourcing strategies.
Alternatively, companies can use flexibility to deal with hidden supply risks. For example, system flexibility (the ability to quickly change the production mix of plants) allowed Pepsi Bottling Group to rapidly respond to a supply disruption caused by a fire at a chemical plant near one of its suppliers. Similarly, product-design flexibility (in this case, the use of standardized components) enabled Nokia to recover quickly from a disruption of its supply of radio frequency chips caused by a fire at a supplier’s factory. Finally, process flexibility (achieved in this case by adjusting workforce skills and processes) allowed Toyota to quickly restore the supply of brake-fluid-proportioning valves (P-valves) after a major disruption.
Case Study: Ford Motor Company
We used our methodology to analyze Ford’s exposure to supply chain disruptions. Working together with Keith W. Combs, Steve J. Faraci, Oleg Y. Gusikhin, and Don X. Zhang, managers in Ford’s purchasing and R&D groups, we looked at two scenarios: In the first, the supplier’s production facility is disrupted for two weeks. In the second, the supplier’s tooling must be replaced, halting operations at its facility for eight weeks. (Details have been altered to mask sensitive Ford data.)
A high-tech manufacturer’s risk exposure index
Our model allows companies in any industry to effectively identify areas of hidden risk in the supply chain. Imagine a high-tech manufacturer that has suppliers and assembly plants all over the world. For each node in the supply chain, managers estimate the time to recovery if a disruption occurred at that node (how long it would take for the node to be restored to full operation) and then calculate the performance impact (lost sales during TTR, for instance). By indexing the performance impact values, managers can see at a glance which nodes represent the highest risks and direct their mitigation strategies accordingly.

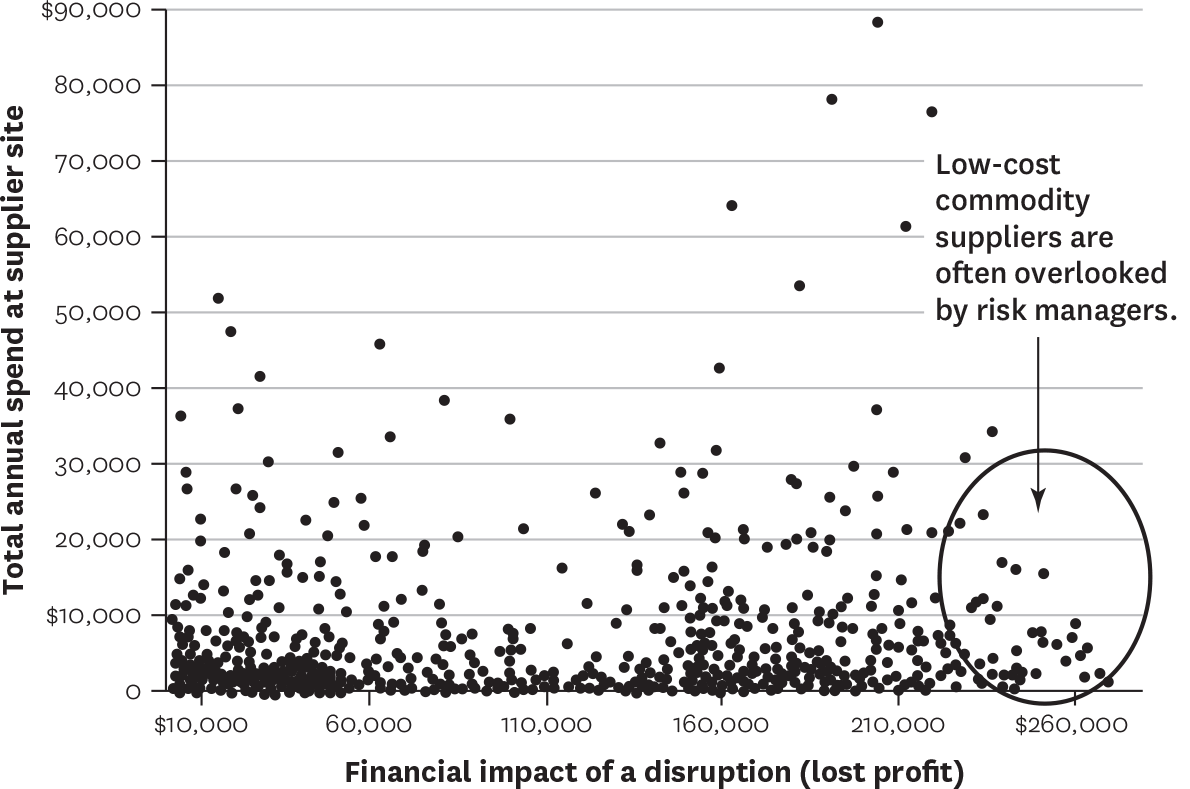
Ford has a multitier supplier network with long lead times from some suppliers, a complex bill-of-materials structure, buffer inventory, and components that are shared across multiple product lines. Approximately 61% of the supplier sites would have no impact on Ford’s profits if they were disrupted. By contrast, about 2% of the supplier sites would, if disrupted, have a significant impact on Ford’s profits. The supplier sites whose disruption would cause the greatest damage are those from which Ford’s annual purchases are relatively small—a finding that surprised Ford managers. Indeed, many of those suppliers had not previously been identified by the company’s risk managers as high-exposure suppliers. (See the exhibit “Impact of supplier disruptions on Ford’s profits” for an analysis of 1,000 Ford supplier sites.)
Impact of supplier disruptions on Ford’s profits
The sites whose disruption would cause the greatest damage are those from which Ford’s annual purchases are relatively small. Ford had not previously identified many of them as high-exposure suppliers. (Data have been disguised to protect sensitive competitive information.)
Using the model, Ford was able to identify the supplier sites that required no special risk-management attention (those with short TTR and low financial impact) and those that warranted more-thorough disruption-mitigation plans. The results from the analysis allowed Ford to evaluate alternative steps it might take to defuse high-impact risks and to better prioritize its risk mitigation strategies. For example, managers learned that the risk-exposure-index scores associated with certain suppliers are highly sensitive to the amount of inventory the firm carries. For that reason, Ford put processes in place to monitor the inventory related to those suppliers on a daily basis.
In March 2012, the auto industry was rocked by a shortage of a specialty resin called nylon 12, used in the manufacture of fuel tanks, brake components, and seat fabrics. The key supplier, Evonik, had experienced a devastating explosion in its plant in Marl, Germany. It took Evonik six months to restart production, during which time the downstream production facilities of Ford and other major automakers were severely disrupted. Had Ford managers used our framework prior to this disruption, they would have detected the risk exposure and associated production bottleneck and proactively worked with Evonik to fast-track its plans to bring online a new plant in Singapore, currently slated to begin production in 2015.
Ford’s supply chain, like those of many other companies, has become increasingly globalized, complex, and extended. This has had the effect of introducing more potential points of failure that Ford must recognize and manage. Using our model, it can rapidly quantify its supply chain exposure and identify effective strategies to mitigate the impact should disruptions occur.
![]()
Our approach to managing supply chain risks allows managers to avoid guessing the likelihood of infrequent, high-impact events and instead concentrate on evaluating their organization’s vulnerability to disruptions, regardless of their cause and where they strike. The method is quantitative, produces a risk exposure measure that is easy to understand, and supports a supplier segmentation process that results in supply networks that are much more resilient.
Originally published in January–February 2014. Reprint R1401H