Debugging Web Applications
While developing applications for the Web, you might find that debugging is a very challenging task. Unlike traditional programming, where sophisticated debuggers allowing developers to view a snapshot of the program while it is running, Web developers can examine only the final output of their work. The final output I am referring to is the HTTP response. However, if you only test with a Web browser, you do not give yourself the advantage of inspecting the entire HTTP response; only the content portion of the response is available (even when you view source). This excludes important information such as the response status code and all HTTP headers (see Chapter 6 for more information about HTTP responses). For this reason, it is best to provide yourself with all possible information rather than hide important information that might help you to resolve a problem.
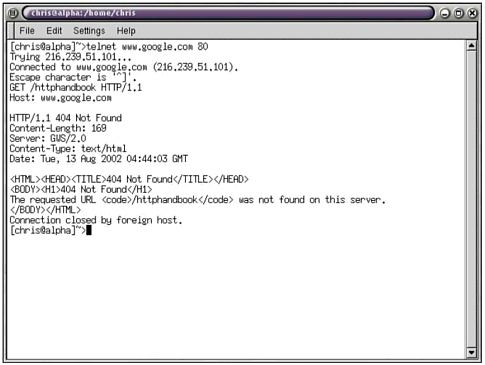
There are many techniques you can use to analyze HTTP traffic. The most primitive technique is to use a telnet client to connect directly to a Web server (on port 80) and type (or copy and paste) your own HTTP request. The HTTP response returned by the Web server will be output directly to your screen (See Figure 4.2).
Figure 4.2. You can use telnet to communicate with a Web server.

If you cannot reproduce the problem using this technique, it is best to make sure you send the same HTTP request that your browser is sending. To accomplish this, you need a way to capture your browser’s HTTP request. This requires the use of a piece of software that will play the role of a Web server and capture each message that it receives (or output it to the screen for you to view). Nearly all major programming languages provide a way to create a TCP/IP server, and many language tutorials include specific examples of this to illustrate socket programming. An example program written in Perl can be found at http://www.perlfect.com/articles/sockets.shtml.
An easier alternative might be to use software specifically created for the purpose of displaying HTTP messages, such as Protoscope (http://protoscope.org/), an open source project that will display HTTP requestes and HTTP responses in the Web browser itself.
A common problem that techniques like this can help resolve is the loss of session, such as when a user suddenly and unexpectedly becomes unrecognized, even though the user previously logged in properly. If you could reproduce this error and capture the HTTP transaction, you would have a much better chance at solving the problem. The HTML alone is not going to offer much help in this situation, because the error lies in the fact that you sent the “not logged in” HTML rather than the “logged in” HTML.
By analyzing the HTTP, you can discover the exact GET and POST variables sent by the browser as well as any cookies, authentication information, and the like. Because the error is more likely to lie in the failure of the Web browser to identify the user correctly to the Web server, there may be no error in the logic that decides to send a “not logged in” Web page to a user who is unrecognizable.
Without knowing how to analyze the HTTP information, debugging can be far more challenging than it needs to be. This book should give you the knowledge and confidence to be able to effortlessly solve problems that would take other Web developers many hours of frustration to solve.
