Chapter 5. Graphing: A picture’s worth 1,000 words

Sometimes an equation might be hiding things.
Ever looked at an equation and thought, “But what the heck does that mean?” In times like that, you just might need a visual representation of your equation. That’s where graphs come in. They let you look at an equation, instead of just reading it. You can see where important points are on the graph, like when you’ll run out of money, or how long it will take you to save up for that new car. In fact, with graphs, you can make smart decisions with your equations.
Edward’s Lawn Mowing needs help...
Edward has been running his own lawn mowing and bush trimming business for a couple of years now.
Here’s what his business looks like now:
Edward charges $12 per lawn.
Edward has 7 current weekly customers.
Edward mows each yard once a week.
Edward gets paid weekly.

Edward’s Lawn Service
Edward has a list of new things that he wants to buy so he can expand his business—he’s thinking long term. He’d like to find out when he’ll be able to purchase each of these items:
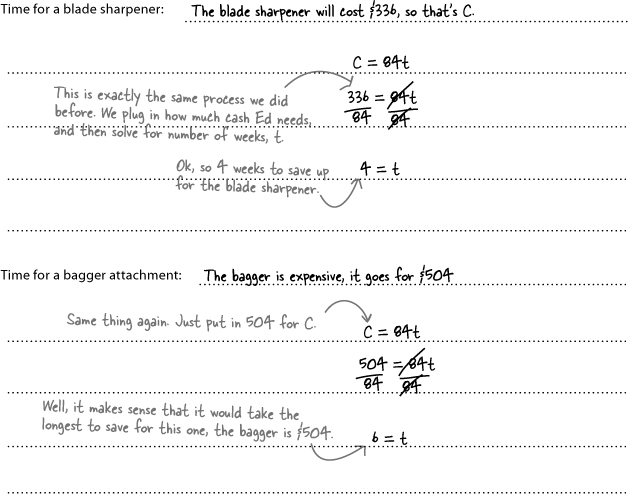
Blade sharpener: $336
Hedge trimmer: $168
Bagger attachment: $504
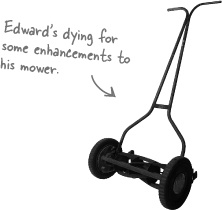

Edward needs help to SEE what his financial future looks like.
Ed wants you to help him plan out when he can make future purchases, help him decide how fast he needs to add clients, and get his business financials organized.
You have all of Ed’s information, his income and his clients, and a list of things he wants to buy. Sounds like an equation just waiting to happen...
Brain Barbell
Using the information that Ed has given you, figure out the general equation for his income over the next weeks and months.
Brain Barbell Solution
Using the information that Ed has given you, figure out the general equation for his income over the next weeks and months.
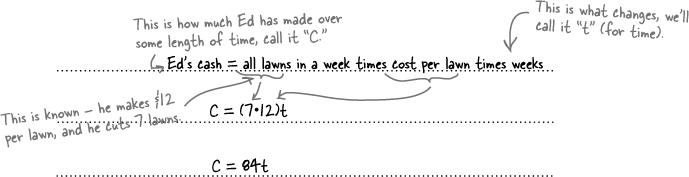
Now Ed can know what his cash is at ANY time
The general equation that you’ve written can work in two different ways because you have two variables. If Ed has a time when he wants to know how much money he’ll have, you just substitute that time for t, and solve for C. Or, if Ed knows how much money he wants, you can tell him when he’ll get there by substituting the amount in for C and solving for t.

Substitute for C, solve for t.
Just substitute the value of the hedge trimmer in for C and solve for t.
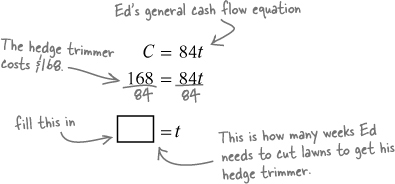
Answer: 2


Why don’t you just SHOW me the money?
What if we could come up with a way where we could look up a value, like the amount an accessory costs, and then see what t was for that amount? In fact, there is a way to show all the possible “what if’s” that you can have for an equation. A graph allows you to draw all of the possible points for an equation and then look up different points as you need them.
Then you can see how much money Ed will have at any given time and tell him if he can afford something, without having to solve that same equation again and again. Let’s start by taking the information we know and drawing it on a grid:
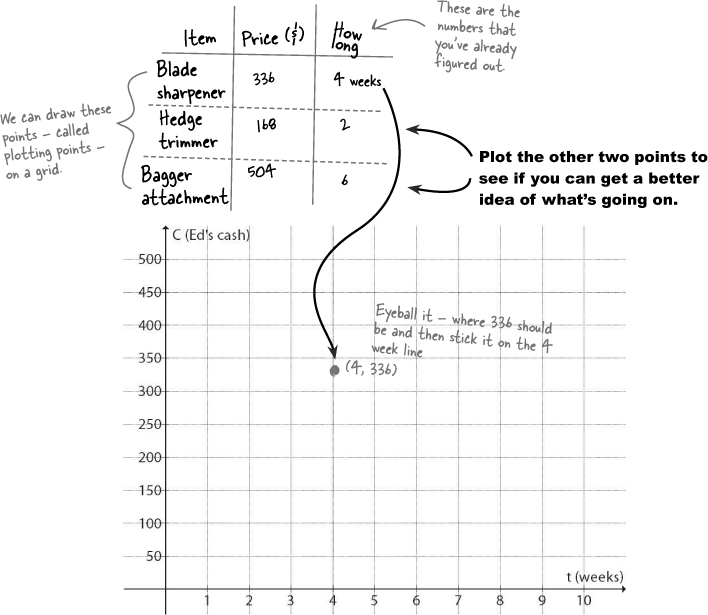
Now we can LOOK at Ed’s cash pattern
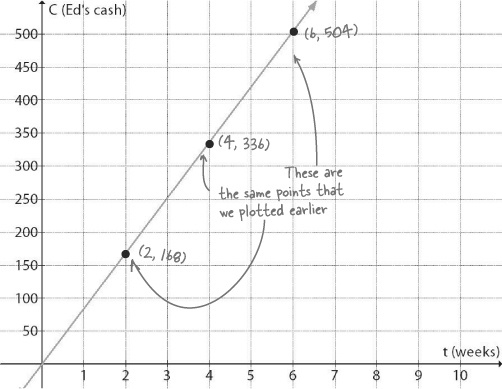
What about points that aren’t plotted yet?
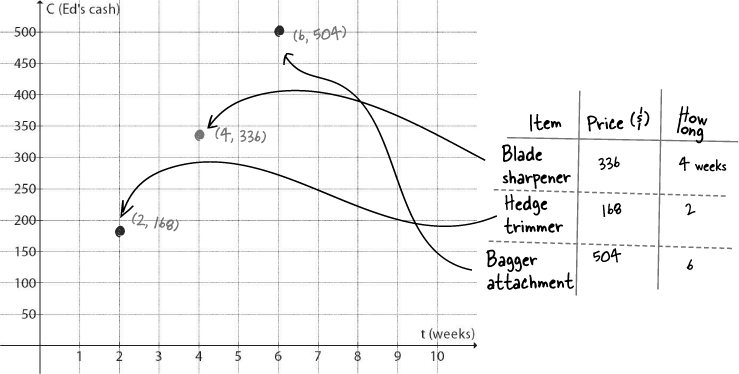
We need to find values for dots that aren’t yet on the grid. But look at the points you’ve already got... they seem to be in a straight line. If you draw a line that connects all of those dots, you’ll be able to use it to figure out different time and cost values.
Like, say, when Ed can afford that $245 pair of noise canceling ear buds he’s been checking out. Let’s draw a line, and then look up where $245 crosses our line.
Graphs show an ENTIRE relationship
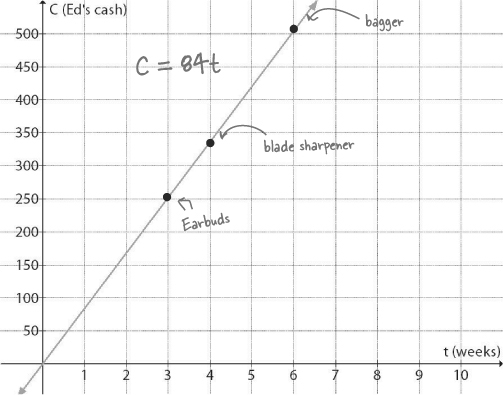
Once we add the line to the picture of the points that we’ve figured out, it turns out we’ve drawn a graph of the relationship between C (Ed’s cash) and t (the number of weeks he’s been cutting grass):
There’s something else that covers the entire relationship
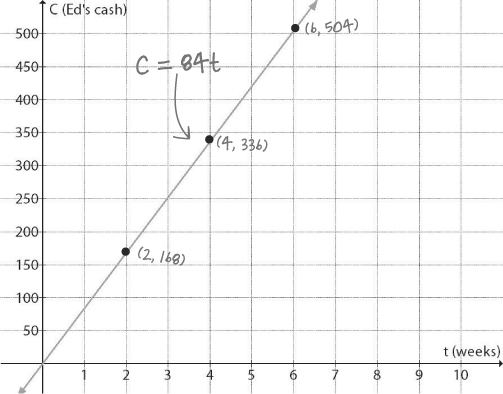
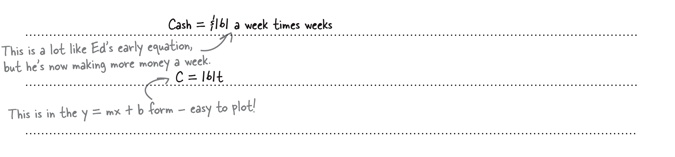
We also have an equation that covers the entire relationship between C and t:
C = 84t
It turns out that what we have—the graph with the line and everything—is actually a graph of the equation. It shows us the equation and lets us look at how C and t are related.
On top of that, this graph shows a trend for the equation: the general direction that the relationship is heading. Ed’s graph is trending upward. That means he’s going to have made more money as time goes on (meaning he’ll keep moving lawns, save more cash, and so on).
Now, when Ed wants to buy something, he can just look up the value for C he wants. Let’s see exactly how that works...
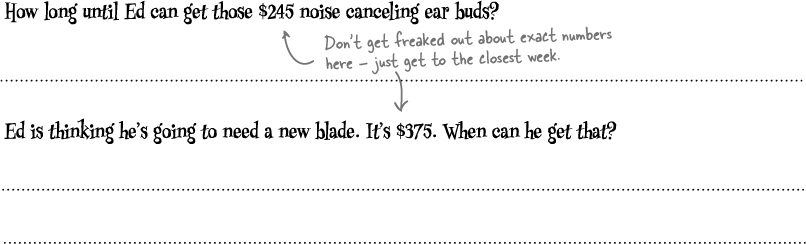
Your job is to play financial planner. Use your cash-flow graph for Ed to figure out when he can make some future purchases. You should not need to do ANY computations this time - the graph will do the work for you!
A graph and an equation are just different ways of looking at a relationship between two variables.
Your job is to play financial planner. Use your cash-flow graph for Ed to figure out when he can make some future purchases. You should not need to do ANY computations this time - the graph will do the work for you!
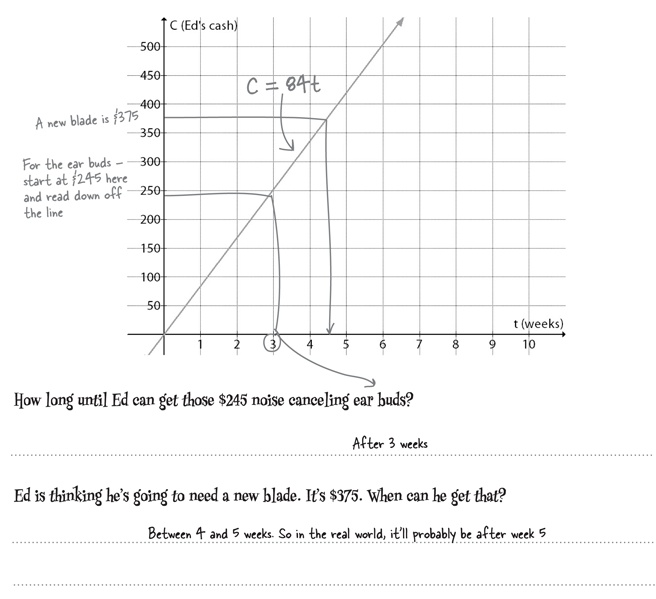

The graph gives you all the answers.
Just by looking, you can let Ed know the details about when he can afford things. Now he’s going to get started with his mowing season and save up to buy new lawn accessories.
But sometimes things change... like hurting your leg in a freak weed whacker accident...

Ed needs to subcontract.
Ed can’t afford to lose all of his customers this early in the summer. He’s only 3 weeks in and will be out of commission for 10 weeks. Luckily, his brother agrees to help him out... for $19 a lawn!
Even though Ed only gets $12 a yard, Ed’s desperate, so he’ll have to make up the difference on each lawn out of his own pocket.
A new situation needs a new equation
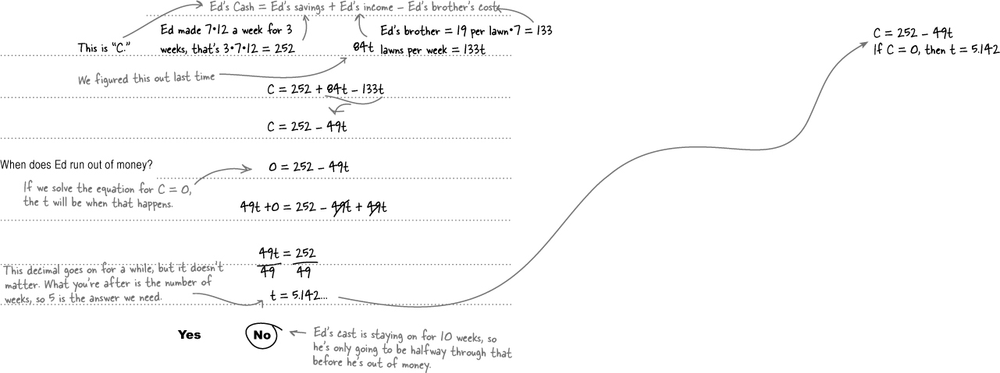
Ed need to know how much money he’s got in the bank and how long he can afford to pay his brother. Ed was charging $12 a lawn, and his brother costs $19, so it’s going to cost Ed $7 extra per lawn until his cast comes off.
Can Ed afford to pay his brother and keep his customers?
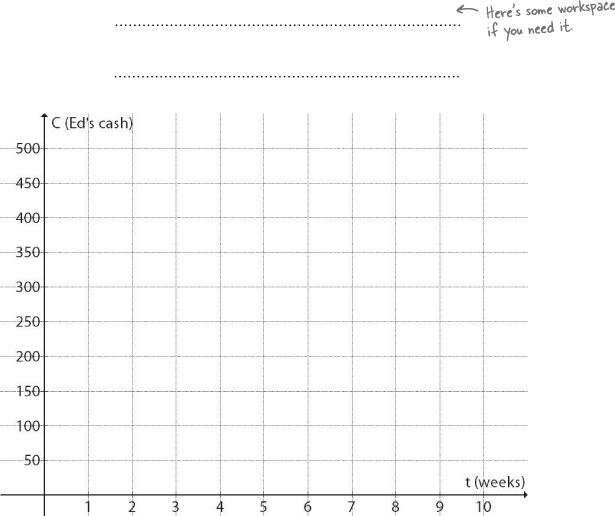
You need to work up a new graph showing Ed’s new situation—paying money instead of making money—for 10 weeks.
Will Ed run out of money before his cast comes off?
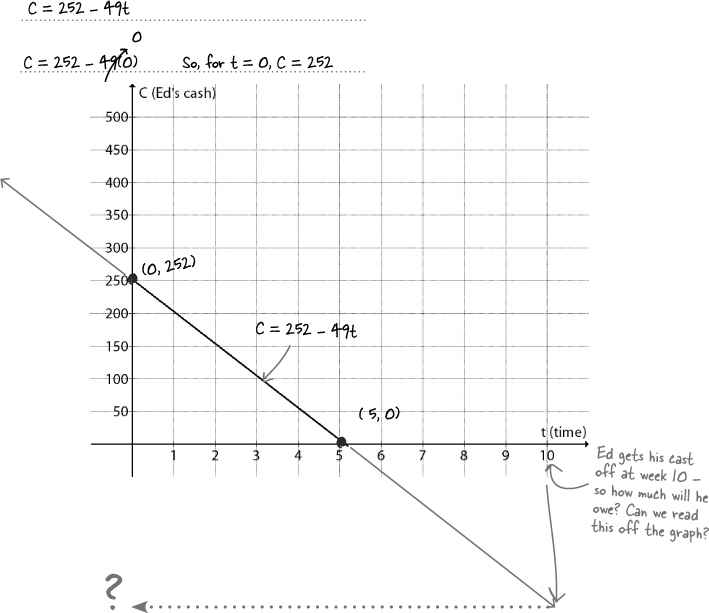
This is only a 10 week situation, but Ed doesn’t have a ton of cash. At the end of the 10 weeks, what will Ed have left?
Work with Ed on a recovery plan. You need to figure out what Ed has, what it will cost him to hire out his brother, and when Ed will run out of money.
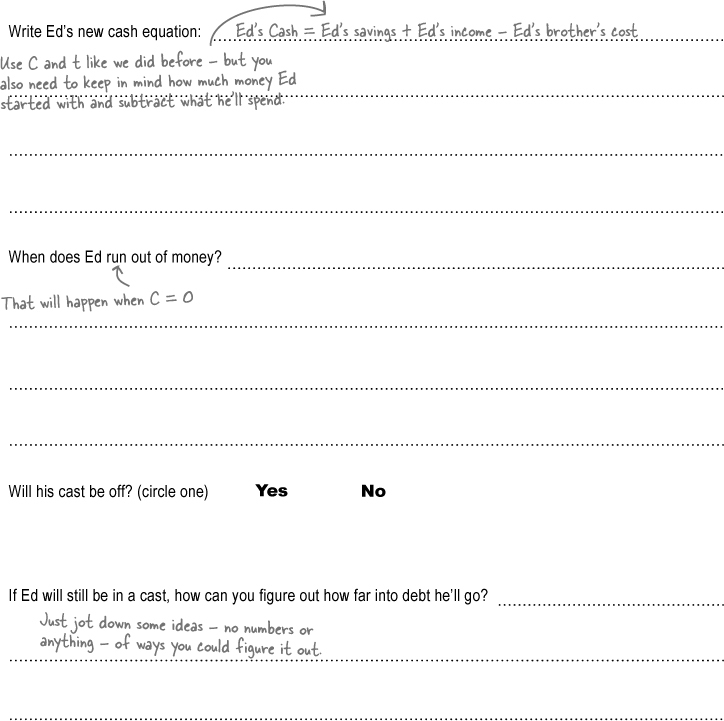
Work with Ed on a recovery plan. You need to figure out what Ed has, what it will cost him to hire out his brother, and when Ed will run out of money.
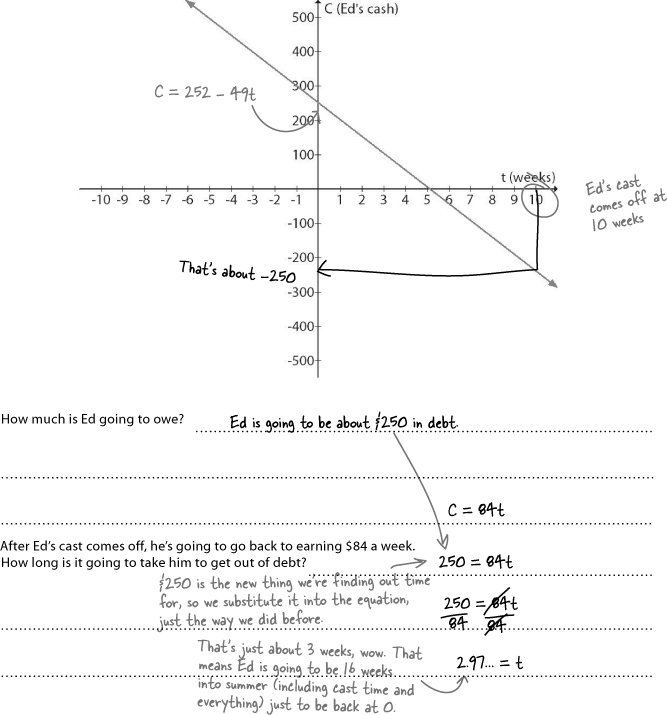
If he’ll still be in a cast, how can you figure out how far into debt he’ll go? ____________
There’s no wrong answer here - we just wanted to get you thinking...________________
_____________________________________________________________________
Draw a graph of Ed’s new equation.
You need one more point, so you can draw a line. Try setting t = 0; it’s easy to solve for. Once you plot those two points, you can just draw the line, and that’s the graph of the equation.
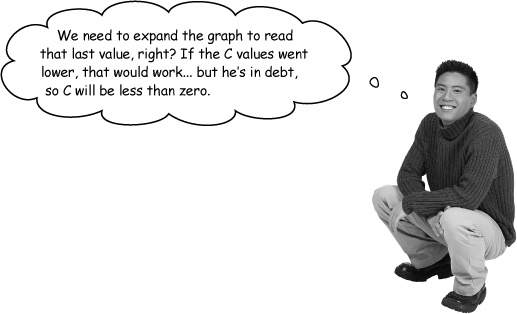
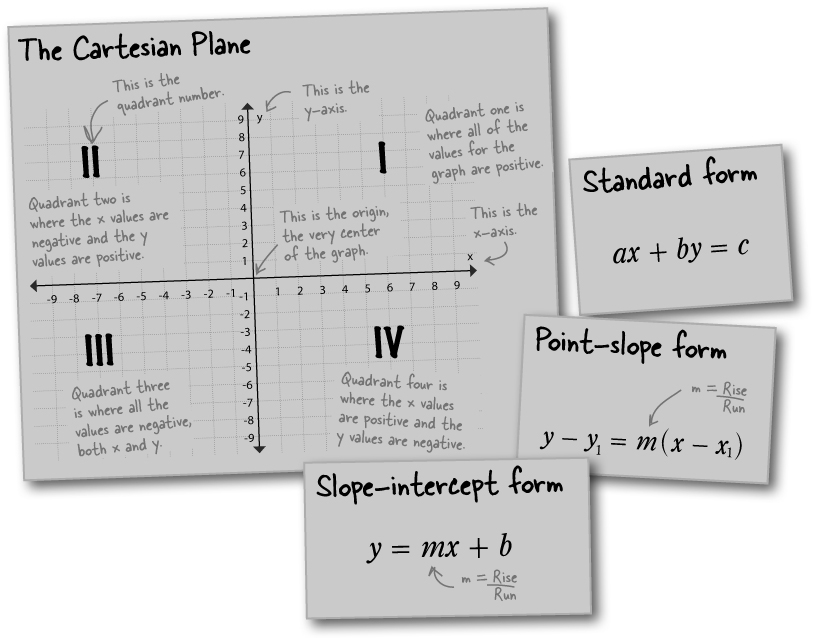
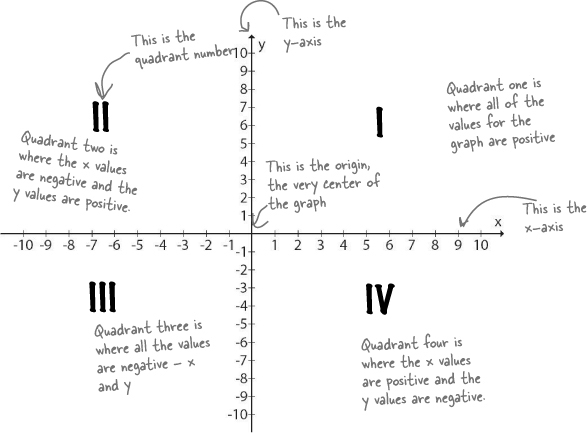
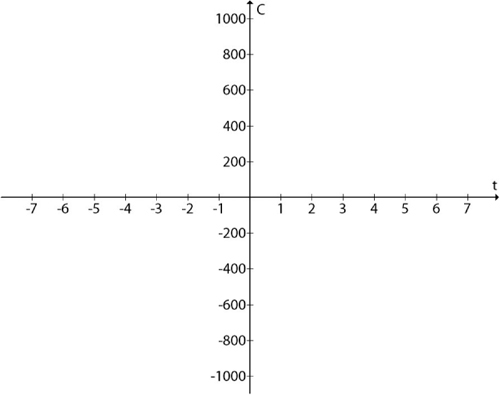
The Cartesian Plane allows values to go BELOW zero
Lots of graphs need to show negative numbers. The math standard for a graph is called the Cartesian Plane. Using the Cartesian Plane, both of the axis values can go negative, which means your values can also be negative, or less than zero.
Here’s what the Cartesian Plane looks like:
We need negative values for Ed’s debt equation...
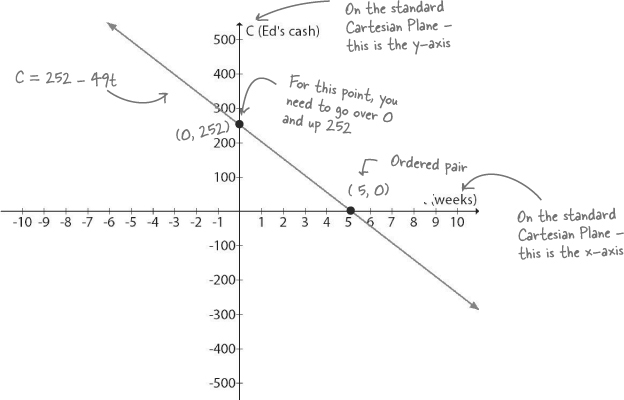
Let’s graph Ed’s equation on the Cartesian Plane
Just because we started with a smaller portion of the plane for Ed’s graph doesn’t mean we need to stay there. If we put Ed’s graph on the Cartesian Plane, we’ll be able to read off the value we need and figure out how far Ed is going to go into debt.
When we first started with Ed’s graphs, we just made up a grid and plotted the points we knew. Each point was actually an ordered pair: one number followed by another number. We write those like this: (0, 252). The first number is the horizontal number, the second is for the vertical, and the parentheses say the numbers are connected. So each point for Ed’s graph is (t, C), where t is time, and C is Ed’s cash:
Ed’s graph has two INTERCEPT points
A linear equation is an equation that expresses a relationship between two variables—like the relationship between Ed’s cash and time. The line that represents a linear equation has points where it crosses the x-axis and y-axis, called intercepts.
Where C = 0 is the t-intercept, which is where the line crosses the t-axis. And where t = 0 is the value for the C-intercept, where the line crosses the C axis. These intercepts are usually called x- or y-intercepts because x and y are the standard labels for the horizontal and vertical axis lines.

After you’ve figured out any two points for an equation, you can draw a line through those points, and you’ve graphed your linear equation. But lines don’t just stop. If nothing changes, they’ll go on forever—to infinity.
It makes sense that two points make a line, but why? Because to be a specific line, you need a point and a direction. If you plot just one point, you can draw lines in all different directions that go through that point. Once you’ve picked a second point, you know which direction that line has to go to hit both of them.
To graph a straight line:
Plot two points that satisfy your equation.
Draw a straight line through (and past) your two points.
Lines go on forever in both directions, so the line you draw has to go past both of your plotted points.
Add arrows on both ends of the line.
The arrows indicate that the line goes past the part of the equation represented on your graph.
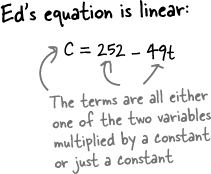
The truth about linear equations...
A linear equation is an equation that defines a line. That means any equation of this type, when you graph it, will produce a line. You can identify a linear equation by looking at it: if it has one or two variables, those variables have an exponent of 1, and all of the terms are constants or constants multiplied by variables, it’s a linear equation.
Once you have looked at an equation and determined that it’s linear, plot two points and draw your line. Start by setting one variable to 0, and solve for the other variable. Then flip the variables: assign the second one to zero, and solve for the first. This will give you your two intercepts. Then you can draw a line through the intercepts, and you’ve got your graph!
Using the full Cartesian plane, read Ed’s graph to figure out how much he’s going to owe 10 weeks from now.
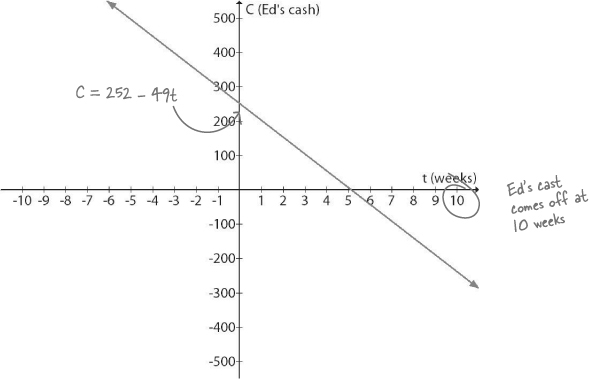
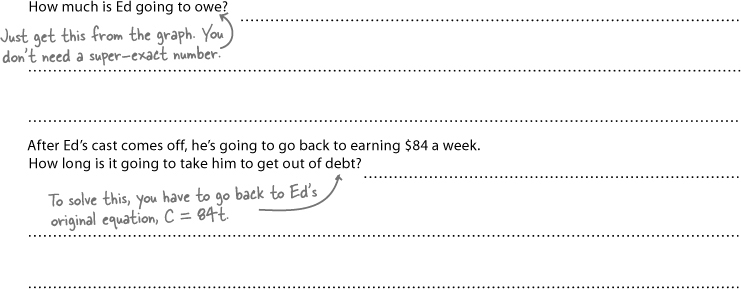
Using the full Cartesian plane, read Ed’s graph to figure out how much he’s going to owe 10 weeks from now.

Ed needs to take on new clients.
Ed needs to get his summer back on track. He’s into June and healed up, but he owes money and wants to make up for lost time. Ed’s created a new form where he details each lawn, so he can give potential customers new quotes.
Ed’s focusing on how hilly lawns are, so he can charge more based on how steep a lawn is. Here’s his new form:
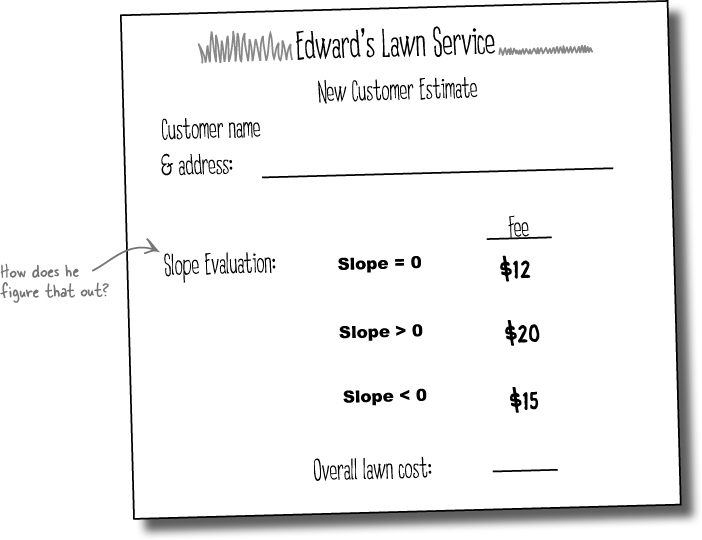
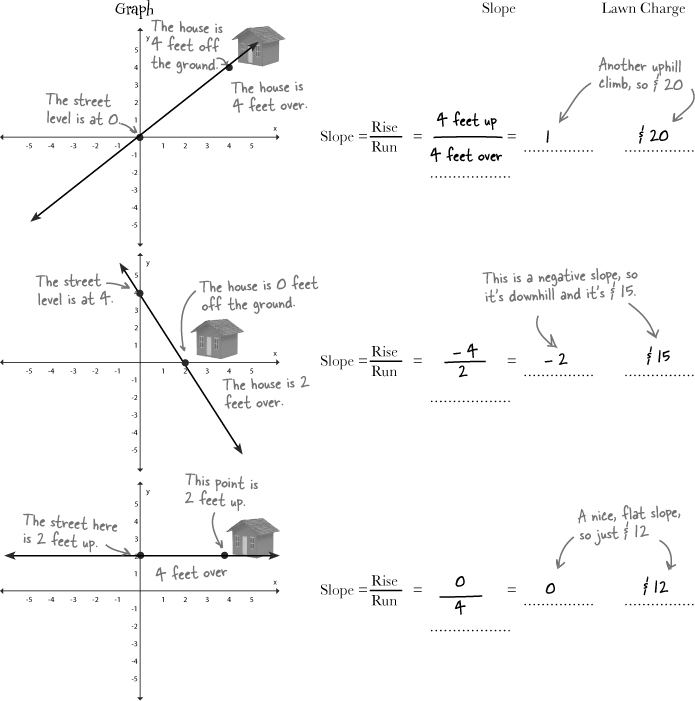
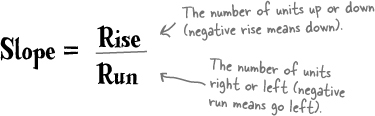
Ed’s figuring out the SLOPE of lawns
To make sure he’s consistent in figuring out how steep a lawn is, Ed’s developed a system. He starts at the street and measures some key features of the lawn. Then he puts that information together and turns his information into a number for the slope of a lawn.
Here’s how it all works:
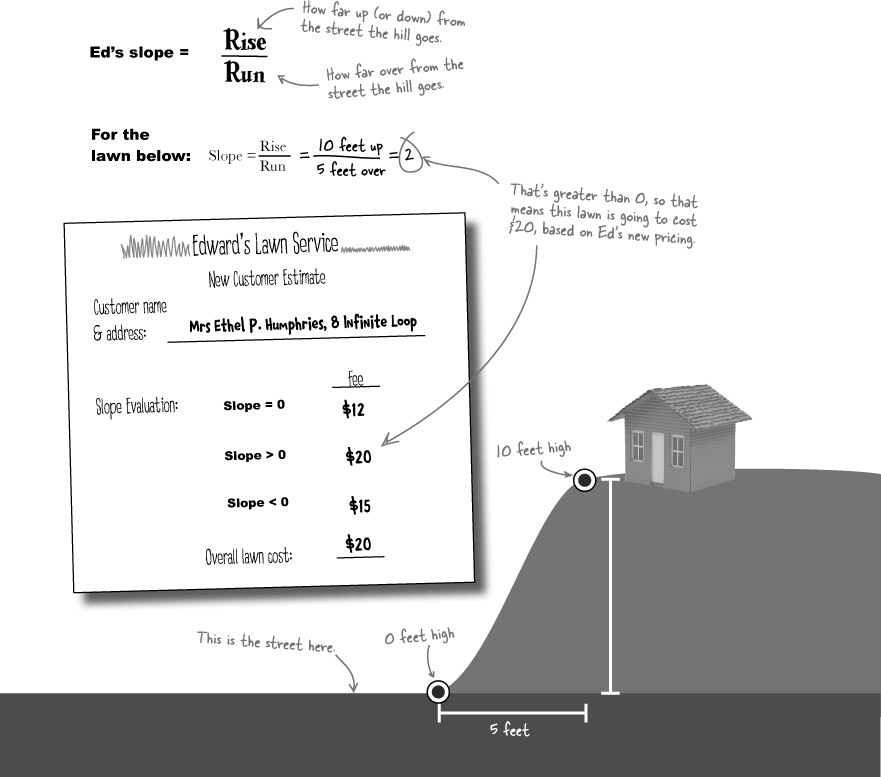
Figure out the slope for each of Ed’s new clients and how much he’s going to charge. Remember: Rise over run!
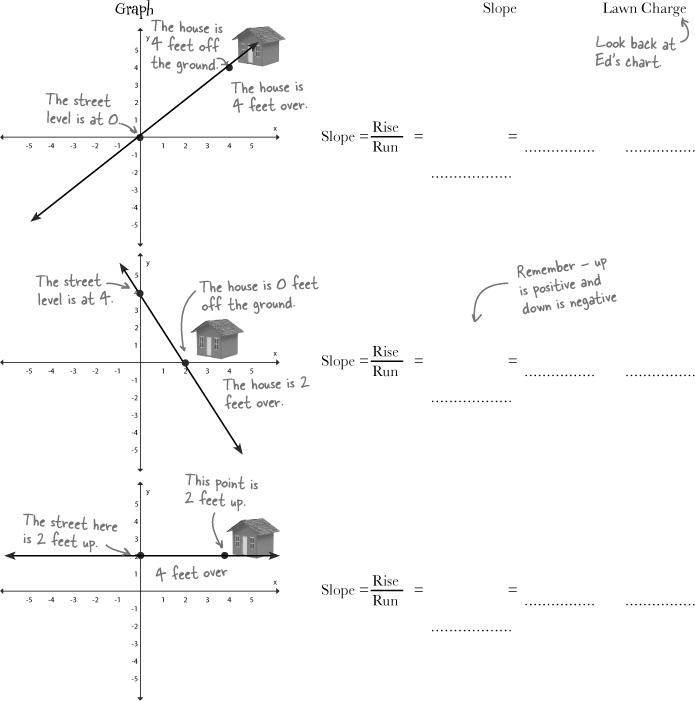
Figure out the slope for each of Ed’s new clients and how much he’s going to charge. Remember: Rise over run!

A line on a graph always represents an equation.
In fact, if you know one point on a line and the slope of a line, you can write out the equation for that line.

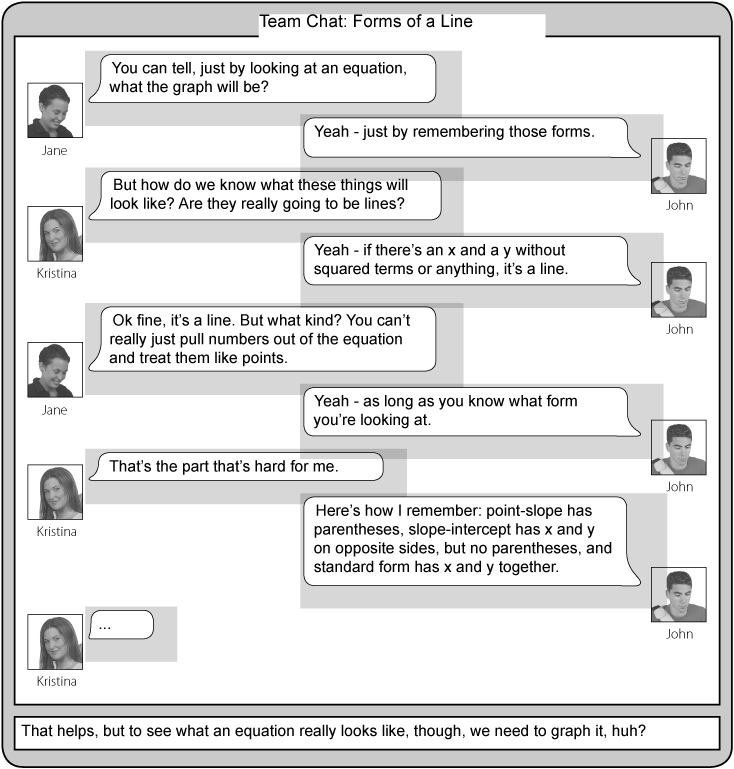
An equation can take several different forms... and you can use the form that helps you out the most.
When linear equations are written a certain way, they have a particular form. The form is just the order of the variables, numbers, and operations. Sometimes a form has two points, and sometimes it has an intercept and a slope.
But no matter what form of a linear equation you’re looking at, every line has a slope, intercepts, no exponents greater than one, and two variables. Understanding the forms just means knowing how to interpret the equations and write them in different ways.
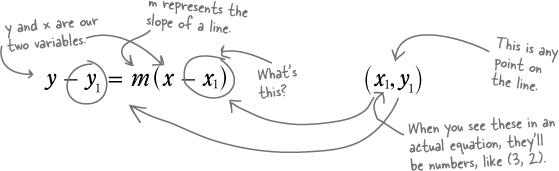
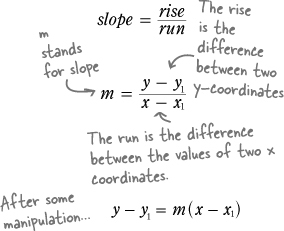
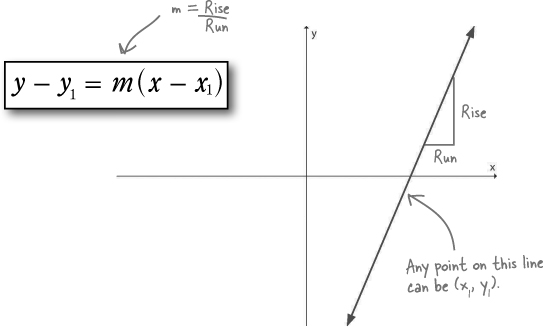
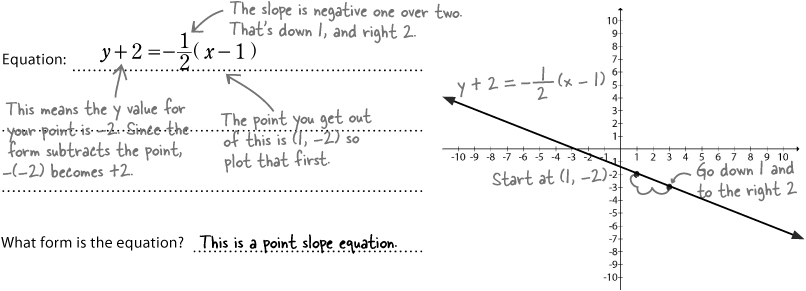
Linear equations in point-slope form
The point-slope form of a linear equation represents an equation as a point on the line and the slope of the line. So as long as you know a line’s slope and one point on the line, you can use the point-slope form:
There’s a lot going on here, though, so let’s take a closer look.
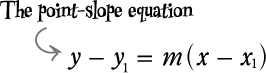
These terms probably look a little weird and are a little confusing. Are they variables or constants? And what are those little numbers?
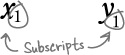
Here’s the deal. The little 1’s below and to the side are called subscripts. They indicate a specific value of x and y, and since the subscripts are the same, they indicate that those x and y values go together. So here’s an ordered pair:
(x1, y1)
This pair represents a point somewhere along the line. It can be an intercept, but it doesn’t have to be. With any single point you can still write the equation.
Since they’re a point on a graph, they are also constants, not variables. So in the point-slope form, you’re taking an ordered pair that represents a point on the line and splitting the two numbers of that pair up in the equation.
How does a point and a slope get you a line?
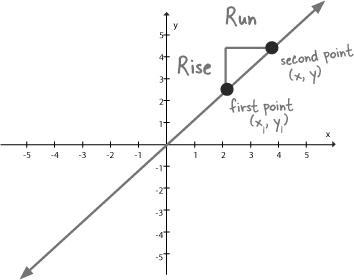
You’ve actually already seen how to figure out slope. We used the idea of rise over run to figure out slopes for Ed’s yard estimates:
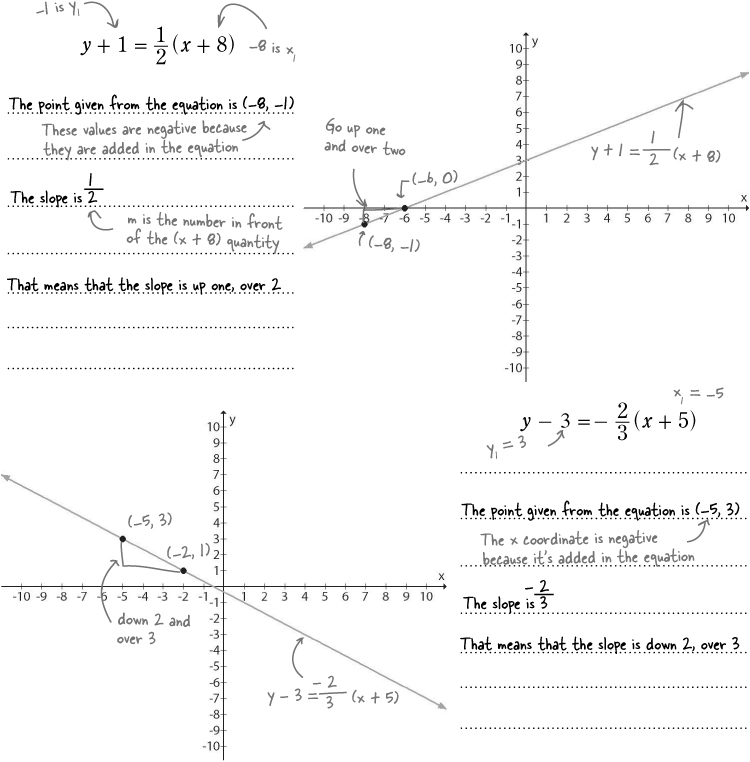
And you’ve already got one point on the line, so here’s what you do to draw the entire line:
Plot the point.
If you start with the point-slope equation, that means your point is: (x1, y1)
Interpret the slope and use it to plot the second point.
If you just go up the rise, and over the run you can plot the point you land on, and then draw your line.
Connect your points to form a line.
Watch it!
x1 and y1 have the opposite sign.
The trickiest part of this equation is that positive x1 and y1 values are subtracted. That means if you see addition signs in the point-slope equation, you’re dealing with a negative coordinate value, not a positive one.
We sure do!
With just one point and the slope that you’ve already figured out, we have enough to write equations for those lawns.
Let’s do it...
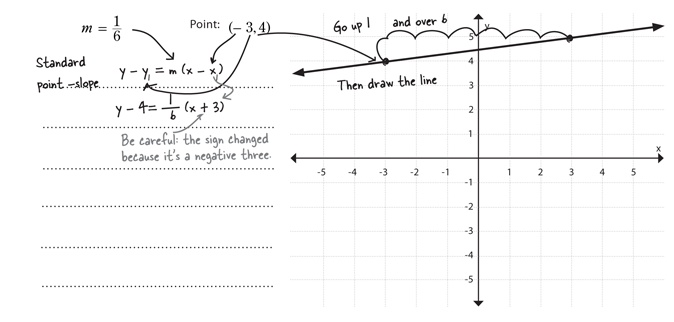
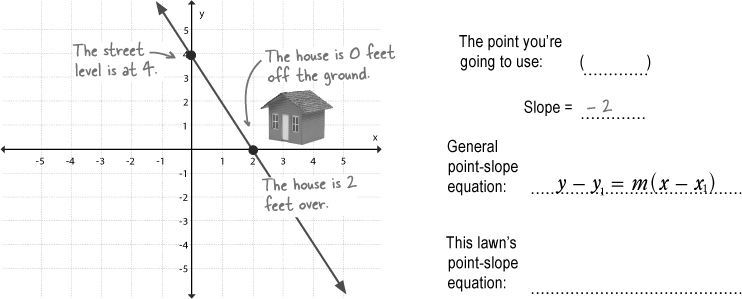
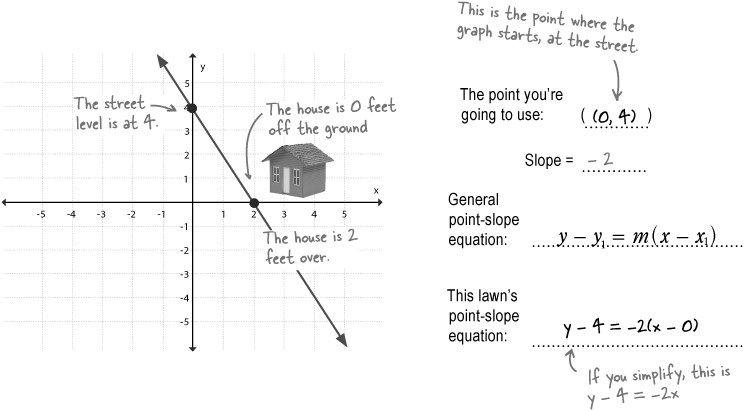
Let’s use the point-slope form
If you take Ed’s first lawn and use the information you’ve already figured out, you can write the equation for that line with no additional calculations:
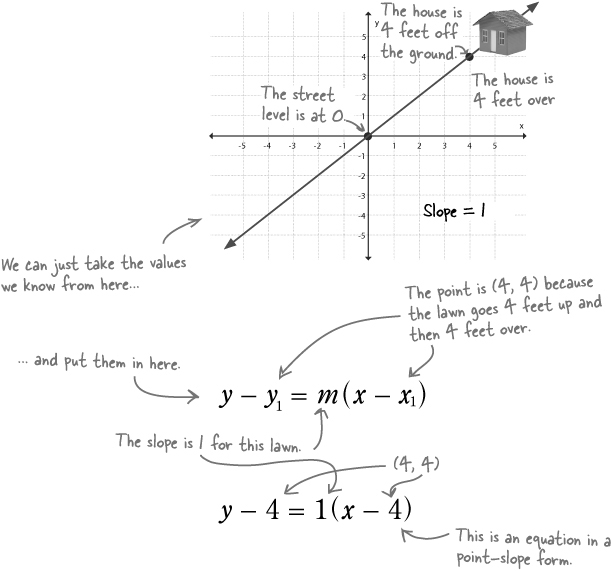
The same holds true for any line for which you know a point and the slope. Just start with the general point-slope equation, and substitute the values for m and x1 and y1, and you have a valid equation for the line.
Watch the signs! If you have a negative value for either x1 or y1, put it in the equation with the negative and then simplify. You’ll end up with an added value in the equation for the line.
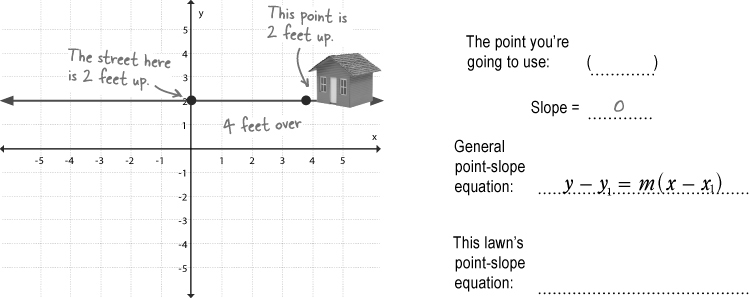
With a slope of 0, things get weird.
There are cases where the point-slope form won’t quite describe the line, like when a line has a slope of 0.
That last lawn is definitely a straight line. So how do we express an equation for that line? Well, we know that the equation will have to be in terms of x and/or y somehow, but what about slope? How does a zero-slope work?
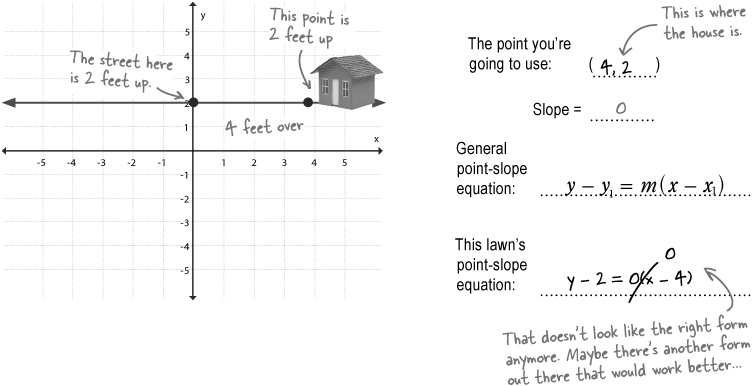
Horizontal lines require a different form
Ed is looking at a nice, flat lawn. The rise of the line is 0, so it doesn’t matter what the run is because the slope will still come out to be zero.
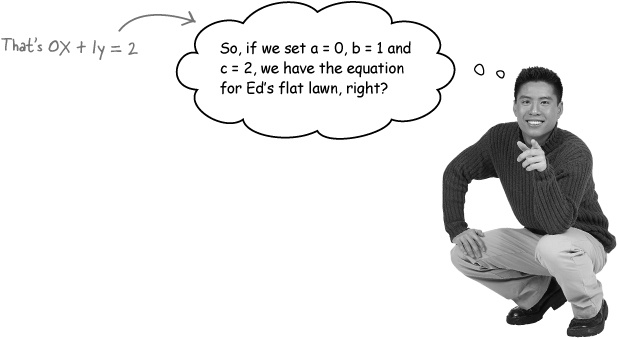
Writing an equation that describes a horizontal line like this is actually pretty simple. Since all of the y values are the same (2 in this case), you can just write:

There’s an x with a coefficient of 0.
If you have a coefficient of a variable that’s zero, the variable will disappear. This equation can be written as:
y – 2 = 0x
It still doesn’t really look quite right. Good thing there’s another form that will work better...
Answer: 2
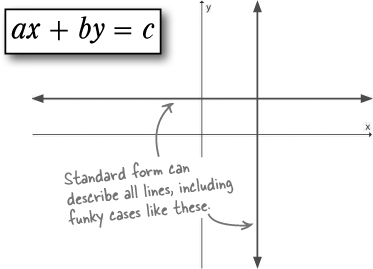
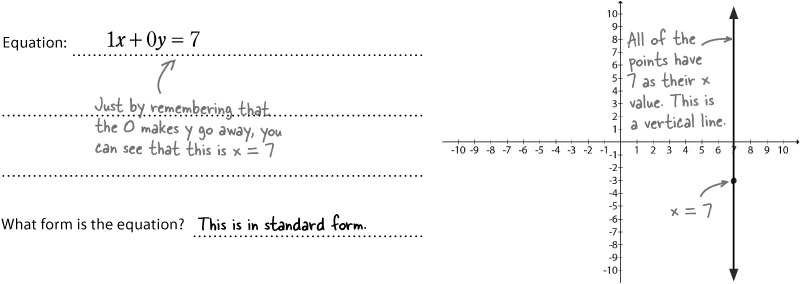
Equations also have a standard form
There’s a form of a linear equation called the standard form. A horizontal line is a very specific case in which point-slope won’t work, but there’s a more general form. The standard form actually takes both y and x into account and works when the slope of a line is zero:
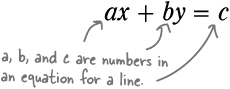
In this form, there’s no m. That means none of those variables mean slope. And a, b, and c do not stand for anything relating to a graph, either. So this form isn’t quite so easy to turn into a graph. But that’s okay because this equation handles every type of line, no matter what.
That’s right!
Any other form of a linear equation can be turned into the standard form. So we can turn the earlier equation, y = 2, into the ax + by = c form.

There’s one more form... and this form IS great for graphing.
The last equation form that’s left is similar to point-slope in what it contains. This last form comes with a point and a slope within the equation.
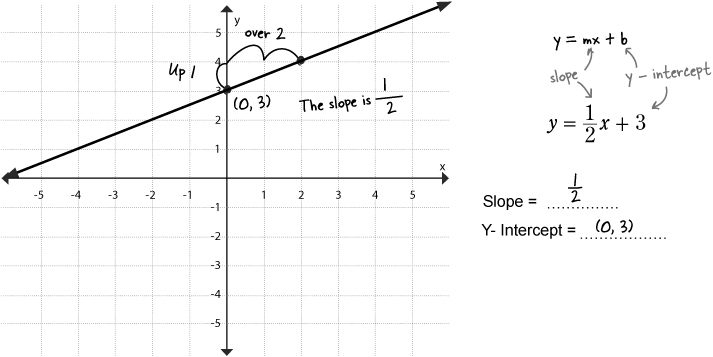
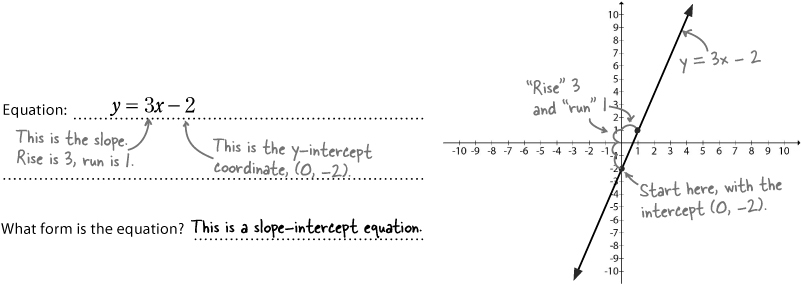
This form includes the y-intercept, so it’s called the slope-intercept form.
The slope-intercept form is EASY to graph
Not only that, but slope-intercept comes with the same constant for slope, m. So m is the slope, just like it was earlier. On top of that, x and y are still variables, like all the other forms of linear equations. The intercept is the part that’s different. Here’s what this format looks like:
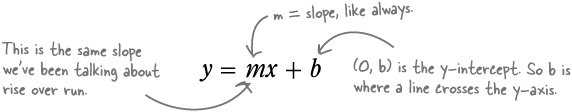
To draw this line, just plot the y-intercept at (0, b) and then find your second point using the slope, m, just like you did before.
Sum it up
Slope intercept equation - A linear equation of the form y = mx + b where m is the slope of the line and b is the coordinate for the y term of the y-intercept.
This form has a lot going for it. It gives you a quick point to plot, and it gives you a slope, so you can plot the rest of the line.
The downside is that if you need to manipulate this form, you’ll have to use a lot of distribution and parentheses, and the constants aren’t together, either.
Point-slope is great for graphing, but not for manipulating the equation.
Standard form
Standard form is straightforward—x and y both have a coefficient, and there’s another extra constant. This form works for all lines, and it’s an easy equation to manipulate.
Graphing is tough with standard form because you don’t have a slope or a point to start with. The only way to graph this form is to solve for a couple of points and then plot those points and draw a line.
This form gives you the y-intercept, and it gives you a slope so you can plot the rest of the line.
Slope-intercept is a good middle ground. It’s easy to manipulate, and it gives you a point right away. However, if the y-intercept for the graph is really high or really low, it can make graphing the line really tough.
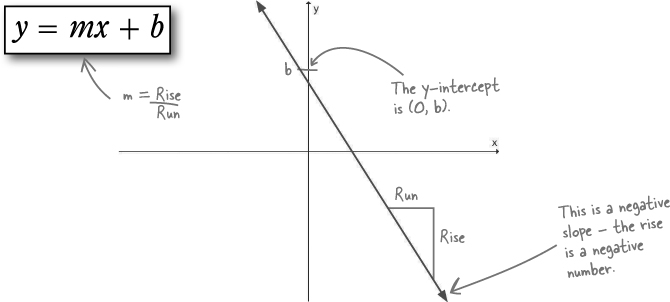
Slope-intercept is great for graphing lines that cross the y-axis near the origin and is pretty easy to manipulate.
Standard form is easy to manipulate but hard to graph.
Use the equation form to your advantage
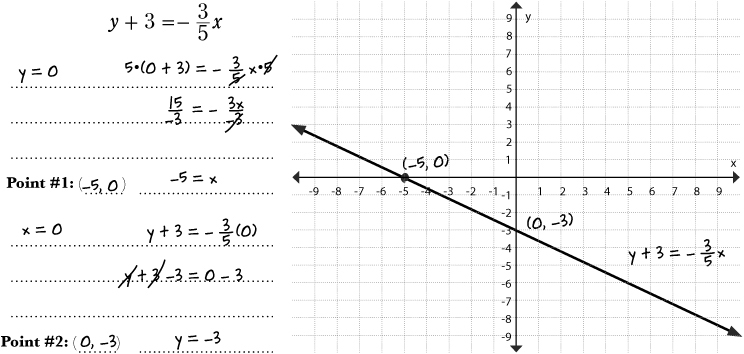
You know enough now to look at an equation and graph it, if it’s a point-slope or slope intercept equation. If it’s in standard form, then you know to solve for some points (y = 0 and x = 0 are easy ones), and then plot your line.
That means most of the time no computation is required! Just draw.
You can look at an equation and graph it if you know the form.
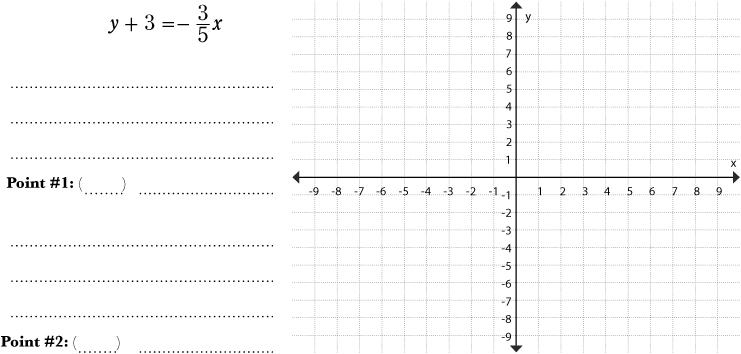
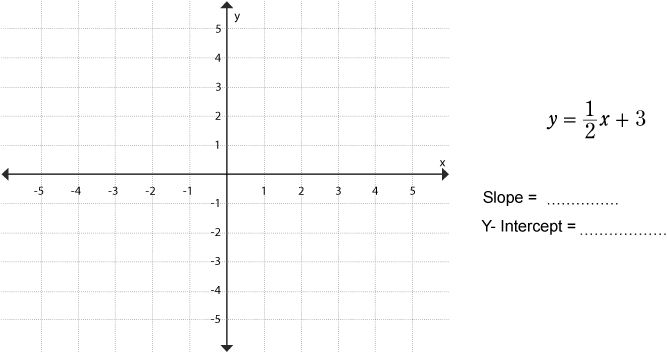
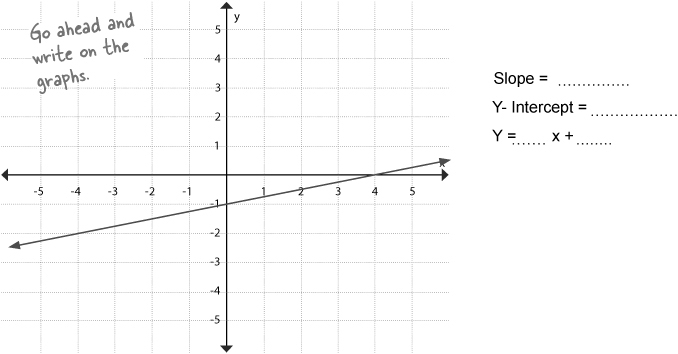
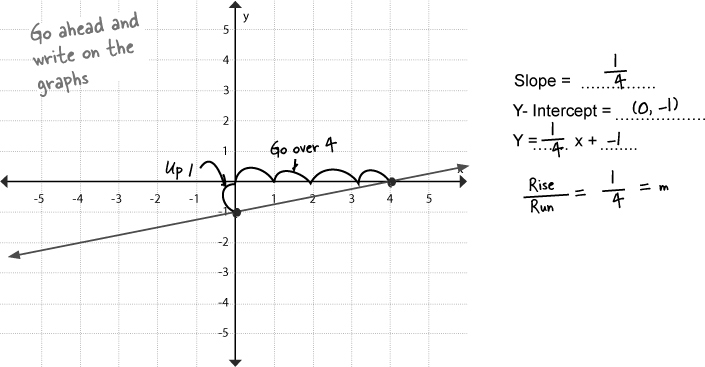
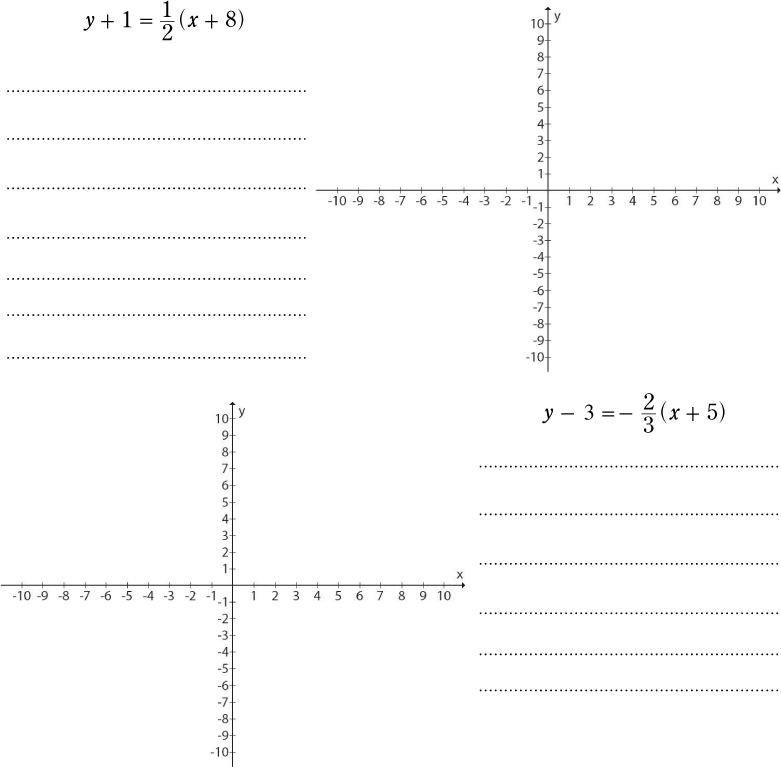
You’re ready to graph some equations. Here are several equations in different forms... draw a visual representation of each one.
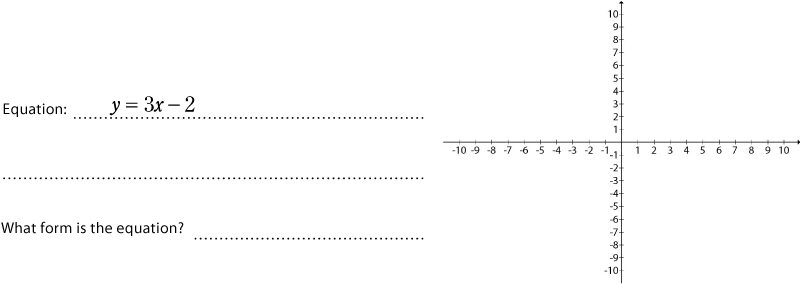
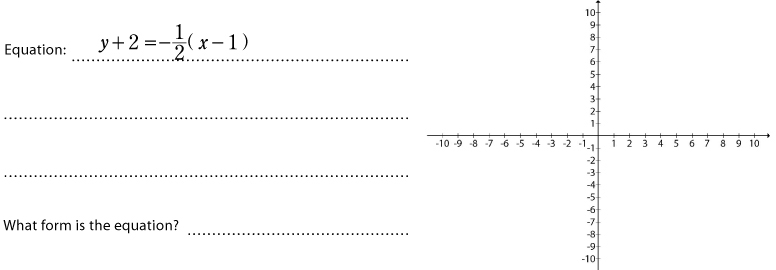
You’re ready to graph some equations. Here are several equations in different forms... draw a visual representation of each one.

Ed and his brother have gotten over their differences. To make up for taking all of Ed’s money early in the summer, his brother is going to work for free to finish the season.
Ed has been evaluating his lawns based on drawings and deciding how steep the slope is, but his brother decided to get creative.
He’s using a “new system” and when he turns the form in to Ed it has equations for the lawns instead of the pictures.
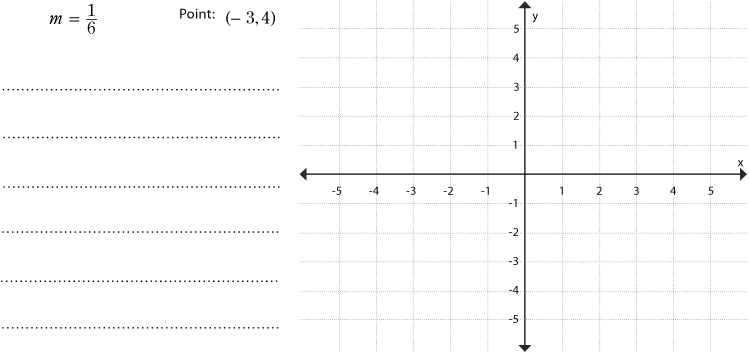
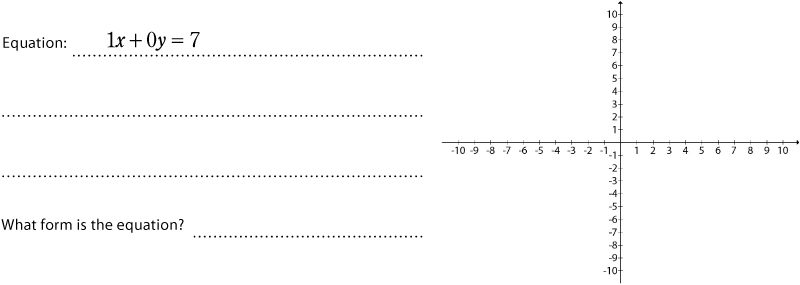
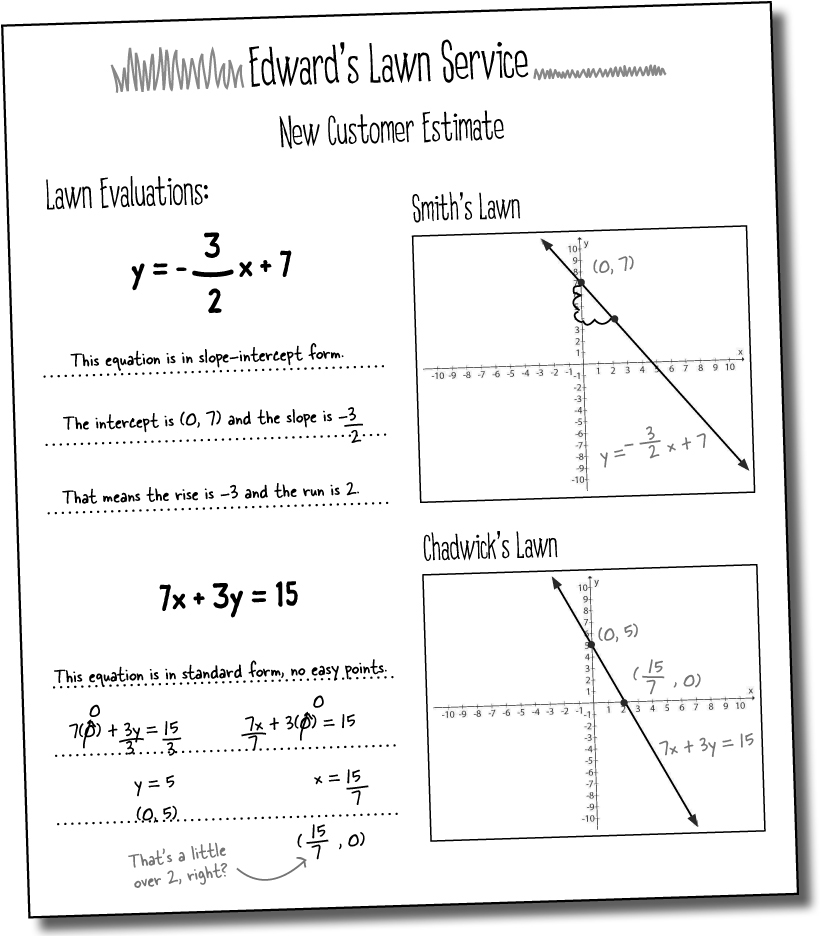
Your job is to convert each equation to a form that you can graph. Then, graph each equation so Ed can get these customers estimates.
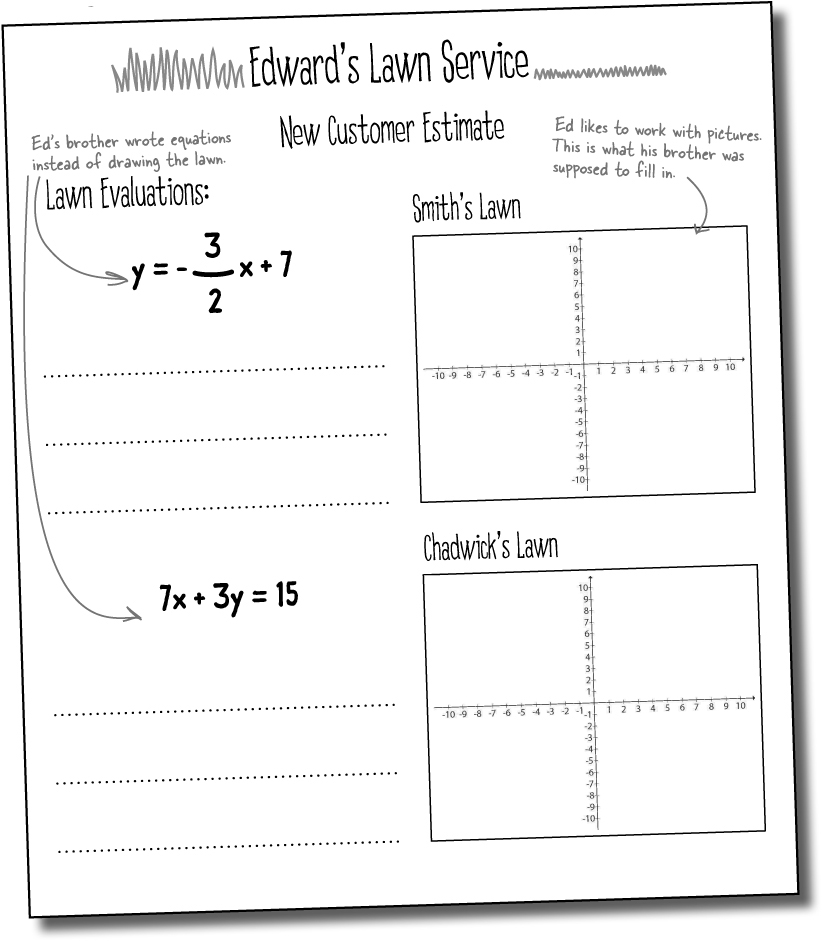
Your job is to convert each equation to a form that you can graph. Then, graph each equation so Ed can get these customers estimates.

Ed’s had a busy summer—and not all of it good. He started out strong, broke his leg, had to pay his brother crazy amounts just to keep his customers, but then things started to turn around with a bunch of clients. Here’s what happened:
Ed spent the first 3 weeks of summer mowing 7 lawns, for $12 each.
Ed broke his leg and had to spend the following 10 weeks in a cast. His 7 clients were still paying $12 a cut, but Ed’s brother was charging him $19 a lawn. He ended up $250 in debt.
For two weeks, he goes back to cutting the original 7 lawns for $12 each, and three new lawns, one for $20, one for $15 and one for $12.
Then his brother signed up these last 2 lawns at $15 a lawn. He’s going to cut all of the lawns for the rest of the summer—6 weeks.
How much is Ed going to end up making? If you need some help, turn the page for a few hints...
Figure out how much Ed is going to make by the end of the summer. Draw him a graph to show his cash projections for the next 22 weeks (that’s how long his plan runs).
Fill out this chart to get started:
Week # | How many lawns? | How much per lawn? | How much did Ed make? | Ed’s running total cash |
1-3 | $ 12 | $ 252 | ||
4-13 Broken leg! | - | |||
14-15 | 10 | Different rates: 8 at $12 each, 1 at $15, and 1 at $20 | $131 per week at 2 weeks = $ 262 | |
16-21 | Different rates - all of the lawns from 15 - 16 plus 2 more at $ 15 | $131 + $30 per week = $ 161 per week | You need to write an equation and plot a graph for this part! | |
Write Ed’s cash equation for the end of the summer:
_____________________________________________________________________
_____________________________________________________________________
_____________________________________________________________________
How much will Ed end up with at the end of the summer? ________________________
_____________________________________________________________________
Your job was to figure out how much Ed is going to make by the end of the summer, and draw him a graph to show his cash projections for the next 22 weeks (that’s how long his plan runs).
Week # | How many lawns? | How much per lawn? | How much did Ed make? | Ed’s running total cash |
1-3 | 7 | $ 12 | $84 per week for 3 weeks = $252 | $ 252 |
4-13 Broken leg! | 7 | $12 per lawn, but it cost him $19 per lawn = - $7 per week | -$49 per week for 10 weeks = - $ 490 | - $ 238 |
14-15 | 10 | Different rates: 8 at $12 each, 1 at $15, and 1 at $20 | $131 per week at 2 weeks = $ 262 | $24 |
16-21 | 12 | Different rates - all of the lawns from 15 - 16 plus 2 more at $ 15 | $131 + $30 per week = $ 161 per week | You need to write an equation and plot a graph for this part! |
Write Ed’s cash equation for the end of the summer:
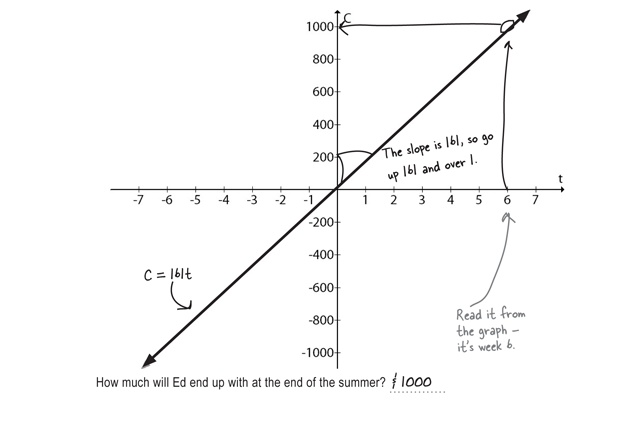
How much will Ed end up with at the end of the summer? $ 1000

A picture might also be worth 1,000 bucks!
Sometimes an equation has a lot to say about the future. In fact, an equation can tell Ed how much to save, how many yards to mow, even how a particular yard will profit his business.
But sometimes you need more than a bunch of numbers and letters. In those cases, a graph can help you see your equation... and make informed decisions.