
Chapter 8. Quality management: Getting it right
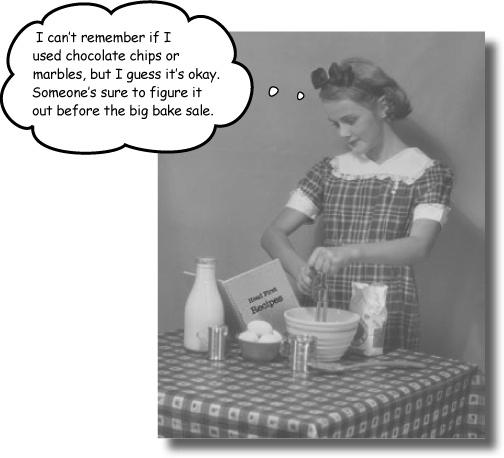
It’s not enough to make sure you get it done on time and under budget. You need to be sure you make the right product to suit your stakeholders’ needs. Quality means making sure that you build what you said you would and that you do it as efficiently as you can. That means trying not to make too many mistakes and always keeping your project working toward the goal of creating the right product!
What is quality?
Everybody “knows” what quality is. But the way the word is used in everyday life is a little different than how it is used in project management. You manage quality on your project by setting goals and taking measurements. That’s why you need to understand the quality levels your stakeholders believe are acceptable, and that your project meets those targets... just like it needs to meet their budget and schedule goals.
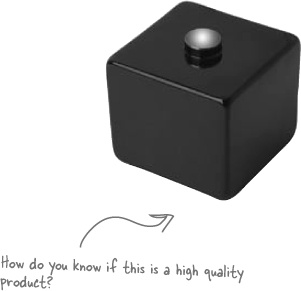
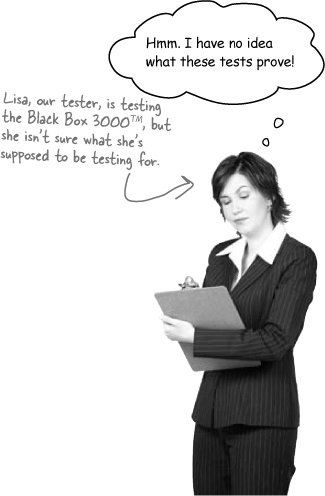
You need more than just tests to figure out quality
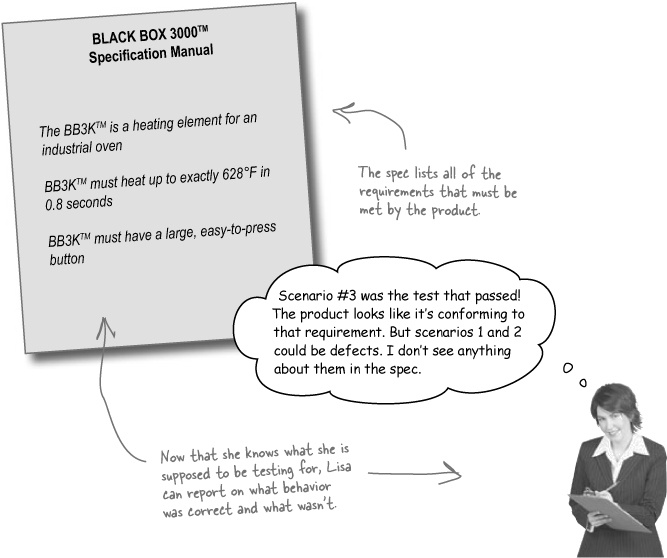
A lot of people confuse quality with testing. When projects run into quality problems, some project managers will respond by adding more testers to the project to try to find more bugs. But testing is only one part of the story. To know your product’s quality, you need to do more than test it:

Scenario 1
Lisa presses the button, but nothing happens.

Scenario 2
Lisa presses the button and a voice comes out of the box that says, “You pressed the button incorrectly.”

Scenario 3
Lisa presses the button and the box heats up to 628°F. Lisa drops the box and it shatters into hundreds of pieces.
Once you know what the product is supposed to do, it’s easy to tell which tests pass and which fail
Testing is all about checking to be sure that the product does what it is supposed to do. That means that you need to have a good idea of what it is supposed to do to judge its quality. That’s why the most important concept in defining quality for the PMP® exam is conformance to requirements. That just means that your product is only as good as the requirements you have written for it. To say that something is a high quality product means that it fulfils the requirements your team agreed to when you started the work.
Quality is the measurement of how closely your product meets its requirements.
Quality up close
There are a few general ideas about quality that will help you understand a little better where the PMP exam is coming from. A lot of work has been done on quality engineering in the past 50 years or so that was originally focused on manufacturing. Those ideas have been applied to product quality over lots of different industries. Here are a few concepts that are important for the exam.
Customer satisfaction is about making sure that the people who are paying for the end product are happy with what they get. When the team gathers requirements for the specification, they try to write down all of the things that the customers want in the product so that you know how to make them happy.
Note
Customer needs should be written down as requirements before you start to build your product. That way, you can always plan on building the right thing.
Some requirements can be left unstated, too. Those are the ones that are implied by the customer’s explicit needs. In the end, if you fulfill all of your requirements, your customers should be really satisfied.
Note
Some requirements are just common sense—like a product that people hold can’t be made from toxic stuff that kills you. It might not be stated, but it’s definitely a requirement.
Fitness for use is about making sure that the product you build has the best design possible to fit the customer’s needs. Which would you choose: a product that’s beautifully designed, well constructed, solidly built, and all-around pleasant to look at but does not do what you need, or a product that does what you want despite being really ugly to look at and a pain in the butt to work with?
You’ll always choose the product that fits your needs, even if it’s seriously limited. That’s why it’s important that the product both does what it is supposed to do and does it well.
Conformance to requirements is the core of both customer satisfaction and fitness for use. Above all, your product needs to do what you wrote down in your requirements specification. Your requirements should take into account both what will satisfy your customer and the best design possible for the job.
Note
Phillip Crosby made this idea popular in the early 1980s. It’s been really important to quality engineering ever since.
In the end, your product’s quality is judged by whether you built what you said you would build.
It’s easy to mistake a low-grade product for a low-quality one.
When people talk about the quality of their car or their meal, they are often talking about its grade. You can judge something’s grade without knowing too much about its requirements. But that’s a lot different than knowing its quality.
Quality vs. grade
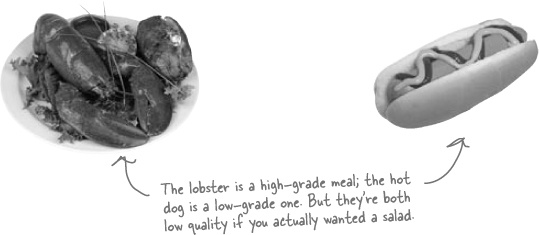
You can eat a lobster platter for dinner, or you can eat a hot dog. They are both types of food, right? But they have very different tastes, looks, feels, and most importantly, cost. If you order the lobster in a restaurant, you’ll be charged a lot more than if you order a hot dog. But that doesn’t mean the lobster is a higher-quality meal. If you’d ordered a salad and got lobster or a hot dog instead, you wouldn’t be satisfied.
Note
Quality means that something does what you needed it to do. Grade describes how much people value it.
Note
Higher-grade stuff typically costs more, but just because you pay more for something doesn’t mean it does what you need it to do.
Take a look at each of these situations and figure out if they’re talking about quality or grade.
You ordered mushrooms on your pizza, but you got onions.
You called the pizza parlor to complain and the guy yelled at you.
The pizza arrived, but it had canned mushrooms.
The pizza was cold.
You just got a brand new luxury car that cost a whole lot of money.
But it’s in the shop every two weeks.
Your neighbors make fun of you because your chrome hubcaps aren’t very classy...
... even though they do a great job of protecting the wheels from dirt, which is why you bought them in the first place.
![]() Answers in Sharpen your pencil Solution.
Answers in Sharpen your pencil Solution.
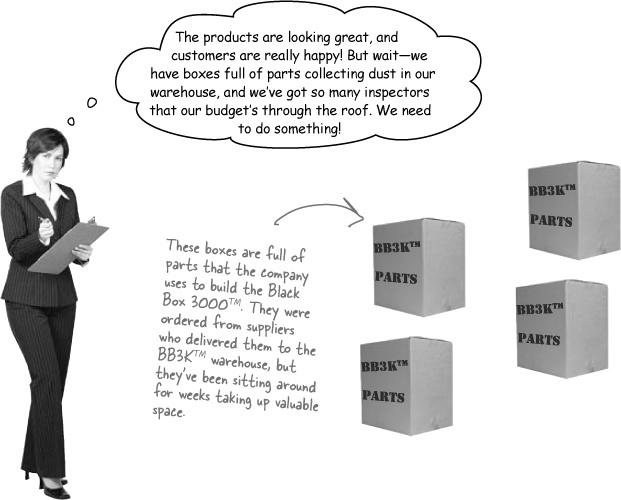
“An ounce of prevention...”
It’s not enough to go to the dentist to get your cavities filled. You need to brush your teeth every day. The same goes with product quality. If you focus on preventing mistakes on your project before they happen, you are more likely to get the product done on time and without spending too much money.
When it comes to defects, prevention is always better than inspection!
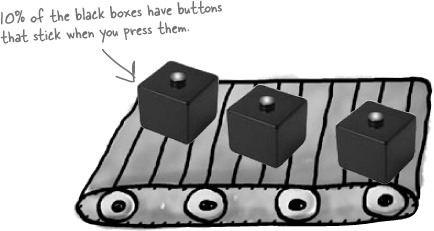
We could hire a lot more inspectors to check to see if each of the products has a sticky button and send it for repair...
And that’s why you need the three Quality Management processes!
There are three processes in the Quality Management knowledge area, and they’re all designed to make sure that you and your team deliver the highest quality product that you can.
Plan Quality is like the other planning processes you’ve learned about—you create a Quality Management Plan to help guide you and your team through quality activities.
Perform Quality Control is the Monitoring & Controlling process where you look at each deliverable and inspect it for defects.
Perform Quality Assurance is where you take a step back and look at how well your project fits in with your company’s overall quality standards and guidelines.
Which of these activities are prevention, and which are inspection?
You find that 40% of the sneakers your factory makes have the left foot insole put into the right shoe and the right insole put into the left shoe. So, you print an L on the underside of the left insole so that factory workers can tell them apart more easily.
The applications being built by your programming team have lots of bugs. So you add extra test cycles and make them longer and more intensive to try to find more problems before you ship.
The applications being built by your programming team have lots of bugs. So you write up coding standards that will guide everyone in building the product with more attention to quality.
Some of the black boxes being built at the factory are only heating up to 500 degrees when the button is pushed. So you set up an automated button presser to press each one and measure its temperature as it comes off of the assembly line.
You set up code reviews at important milestones in your project to catch defects as early as you can.
The programmers on your team write unit tests before they write the code for the application they’re writing. That helps them to think of ways that the application’s design might go wrong and avoid major pitfalls.
Which of these activities are prevention, and which are inspection?
You find that 40% of the sneakers your factory makes have the left foot insole put into the right shoe and the right insole put into the left shoe. So, you print an L on the underside of the left insole so that factory workers can tell them apart more easily.
The applications being built by your programming team have lots of bugs. So you add extra test cycles and make them longer and more intensive to try to find more problems before you ship.
The applications being built by your programming team have lots of bugs. So, you write up coding standards that will guide everyone in building the product with more attention to quality.
Some of the black boxes being built at the factory are only heating up to 500 degrees when the button is pushed. So you set up an automated button presser to press each one and measure its temperature as it comes off of the assembly line.
You set up code reviews at important milestones in your project to catch defects as early as you can.
The programmers on your team write unit tests before they write the code for the application they’re writing. That helps them to think of ways that the application’s design might go wrong and avoid major pitfalls.
Plan Quality is how you prevent defects
Since prevention is the best way to deal with defects, you need to do a lot of planning to make sure that your product is made with as few defects as possible. The Plan Quality process focuses on taking all of the information available to you at the beginning of your project and figuring out how you will measure your quality and prevent defects.


How to plan for quality
You need to plan out which activities you’re going to use to measure the quality of the product of your project. And you need to be sure that the activities you plan are going to pay off in the end. So you’ll need to think about the cost of all of the quality-related activities you want to do. Then you’ll need to set some guidelines for what you’re going to measure against. Finally, you’ll need to design the tests you’re going to run when the product is ready to be tested.
Cost-benefit analysis is looking at how much your quality activities will cost versus how much you will gain from doing them. The costs are easy to measure; the effort and resources it takes to do them are just like any other task on your schedule. Since quality activities don’t actually produce a product, though, it is harder for people to measure the benefits sometimes. The main benefits are less rework, higher productivity and efficiency, and more satisfaction from both the team and the customer.

Note
That makes sense. A team that is making a high quality product will be really proud of their work.
Benchmarking means using the results of Plan Quality on other projects to set goals for your own. You might find that the last project your company did had 20% fewer defects than the one before it. You would want to learn from a project like that and put in practice any of the ideas they used to make such a great improvement. Benchmarks can give you some reference points for judging your own project before you even get started with the work.
Design of experiments is where you apply the scientific method to create a set of tests for your project’s deliverables. It’s a statistical method, which means you use statistics to analyze the results of your experiments to determine how your deliverables best meet the requirements. A lot of quality managers use this technique to produce a list of tests that they’ll run on the deliverables, so they have data to analyze later.
Flowcharting means coming up with a graphical depiction of the the process you’re doing so that you can anticipate where quality activities might help you prevent defects.
Control charts are used to figure out which processes in your company might be having quality problems. They’re used for measuring the performance of activities that are done over and over.
Properietary techniques are process frameworks and methodologies that project managers use to improve quality. (Don’t worry, the PMBOK® Guide doesn’t contain a list of them that you need to memorize.)
Cost of quality is what you get when you add up the cost of all of the prevention and inspection activities you are going to do on your project. It doesn’t just include the testing. It includes any time spent writing standards, reviewing documents, meeting to analyze the root causes of defects, rework to fix the defects once they’re found by the team—absolutely everything you do to ensure quality on the project.
Statistical sampling is when you look at a representative sample of something to make decisions. For example, you might take a look at a selection of widgets produced in a factory to figure out which quality activites would help you prevent defects in them.

There are additional quality planning tools that project managers might use:
Brainstorming (which you’ll learn all about in Chapter 11)
Affinity diagrams (which you learned about in Chapter 5)
Force field analysis is how engineers analyze structures to see what forces affect their use
Nominal group techniques mean brainstorming with small groups, and then working with larger groups to review and expand the results
Matrix diagrams are tables, spreadsheets or pivot tables that help you analyze complex relationships
Prioritization matrices let you analyze multiple issues and prioritize so you can attack the important ones first
Read each of these scenarios and identify which tool or technique is being used.
You look through your company’s asset library and find that a recent project was able to reduce defects by 20% by inserting defect prevention meetings early in the construction phase. You put the same process in your quality plan and set the target for shipped defects to be 20% lower than the company average for your project.
Tool/technique: _________________________________
You add up all of the costs projected for quality activities and track that number in your quality plan. You use this number to gauge the health of your project compared to other projects in your company.
Tool/technique: _________________________________
You write up a list of all of the tests you are going to run on the Black Box 3000™ when it rolls off the assembly line. You determine what kinds of failures might cause you to stop testing, what it would take for you to resume test activities, and requirements that the product would need to fulfill to be considered accepted into test.
Tool/technique: _________________________________
![]() Answers in Exercise Solution.
Answers in Exercise Solution.
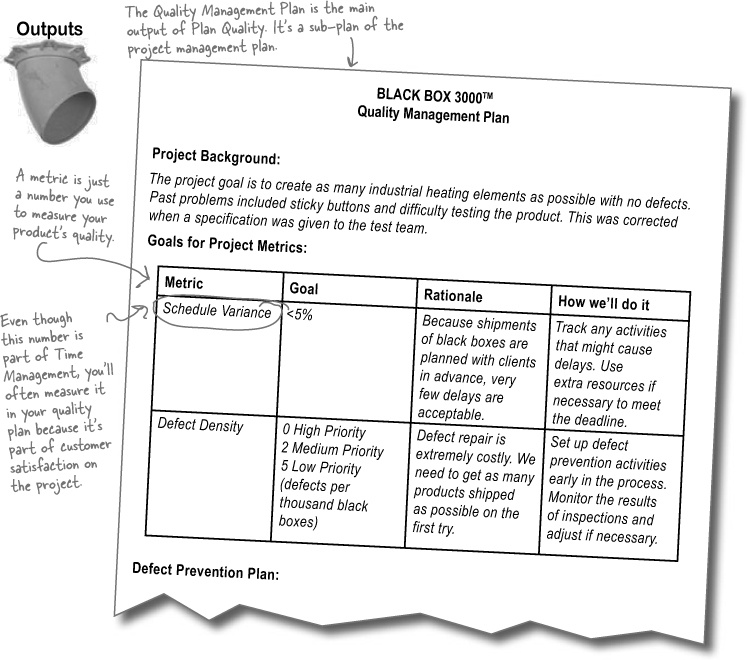
The quality management plan gives you what you need to manage quality
Once you have your quality management plan, you know your guidelines for managing quality on your project. Your strategies for monitoring your project quality should be included in the plan, as well as the reasons for all of the steps you are taking. It’s important that everyone on the team understands the rationale behind the metrics being used to judge success or failure of the project.
The Quality Management Plan is the main tool for preventing defects on your project.
Checklists are there to help people head off mistakes that might cause defects. You can create checklists to avoid common errors as part of your Plan Quality process and then put them to use throughout your project as a defect prevention technique. Checklists can also be used for inspecting products to be sure that they display specific characteristics.

Process Improvement Plan is a plan for improving the process you are using to do the work. In it, you come up with strategies for finding inefficiencies and places where the way you work might be slowing you down or creating a low quality product. You set goals for how you can monitor the process during your project and make recommendations to make it better.
Note
This means you need to think about more than just building the product of the project. You also need to think about how your company does all of its projects.
Quality Metrics are the kinds of measurements you’ll take throughout your project to figure out its quality. If you’re running a project to install windows in a skyscraper, and 15% of them have to be reinstalled because they were broken, that’s an important metric. You’ll probably want to work with your company to bring that number down.
Here’s where you document how you’ll be figuring out the product’s quality. You need to write down the formulas you’ll use, when you will do the measurements, why you are taking them, and how you will interpret them.
Project Document Updates might need to be made because you have found new information in the course of planning your quality activities that affects one of the other plans you’ve already made. That’s why this process includes an output for making those kinds of changes.
Match each Plan Quality output to its description.
Quality Management Plan | Helps you to make sure that each deliverable is up to the project’s standards. |
Process Improvement Plan | Helps you to plan out all of your quality activities |
Quality Checklists | Describes how you’ll measure a particular attribute of a deliverable during testing. |
Quality Metrics | Helps you change the way you work for the better. |
![]() Answers in Exercise Solution.
Answers in Exercise Solution.
Inspect your deliverables
It’s not enough to inspect the final product. All of the things that you make throughout a project should be looked at to find bugs. In fact, the earlier you find them, the easier they are to fix. The Perform Quality Control process is all about inspecting work products to find defects.
Quality Control is in the Monitoring & Controlling process group. Like Scope Control and Cost Control, you look at the work performance information that is coming from your project and compare it to your plan. If there are problems, you recommend a change. That way you can either fix the problem or make sure that it doesn’t happen again.

Use the planning outputs for Perform Quality Control
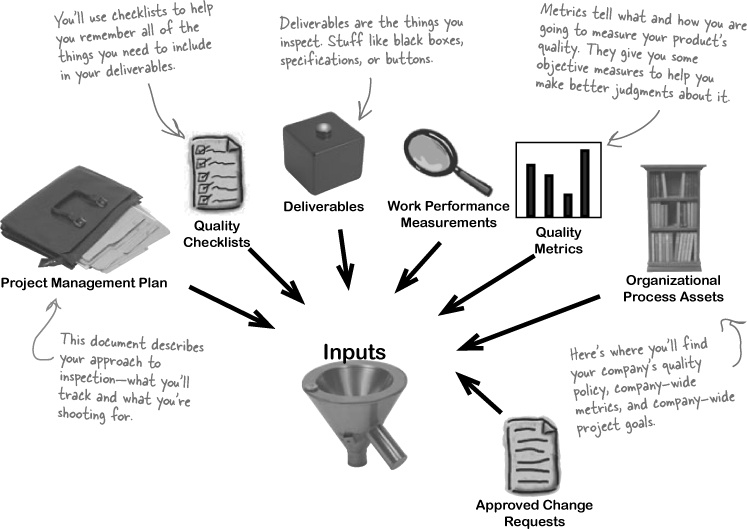
You’ve come up with a plan to make sure each deliverable is right. Now it’s time to monitor the work that’s being done to the requirements—and that’s just a matter of following your plan! You’ll need to look at everything that is being produced and make sure that it stands up to all of the requirements that have been gathered. And you’ll need nearly everything you produced in Plan Quality in order to get a handle on your product’s quality.
Metrics make it easy for you to check how well your product meets expectations.
The seven basic tools of quality
These charts and tools are so common in quality control that they have a name. They’re called the seven basic tools of quality. Expect a bunch of questions on these in the exam!
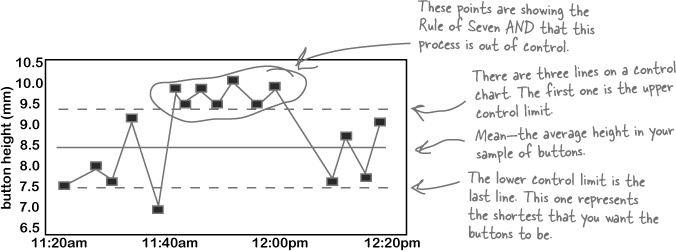
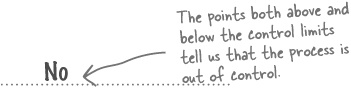
Control Charts are a way of visualizing how processes are doing over time. Let’s say that the button on each black box needs to be between 7.5 and 9.5 millimeters tall, and the chart above represents sample height measurements of boxes being made. We want the boxes to all be between 7.5mm and 9.5mm. The lower control limit of the chart is 7.5mm, and the upper control limit is 9.5mm. The chart above shows control limits as dashed lines. The mean is the solid line in the middle, and it shows the average height of all of the buttons in the sample. By looking at the chart above, you can see that there are a lot of buttons that were taller than 9.5mm manufactured and only one that was shorter than 7.5mm. When a data point falls outside of the control limits, we say that data point is out of control; and when this happens we say that the entire process is out of control.
It’s pretty normal to have your data fluctuate from sample to sample. But when seven data points in a row fall on one side of the mean, that’s an uncommon enough occurrence that it means your process might have a problem. So when you see this, you need to look into it and try to figure out what’s going on. That’s called the rule of seven, and you’ll definitely see questions about it on the PMP exam.
Note
When you’re looking at the whole process, that’s called Quality Assurance—and it’s coming up next.
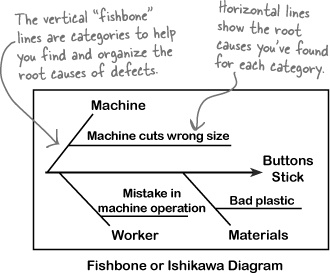
Cause and effect diagrams are also called Fishbone and Ishikawa diagrams. They are used to figure out what caused a defect. You list all of the categories of the defects that you have identified and then write the possible causes of the defect you are analyzing from each category.
Fishbone diagrams help you see all of the possible causes in one place so you can think of how you might prevent the defect in the future.
Pareto charts, flowcharts, and histograms
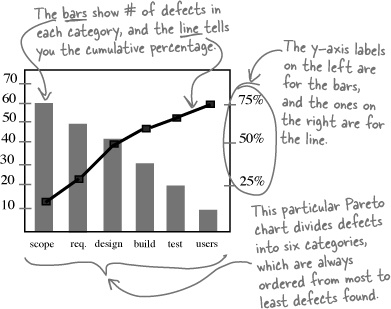
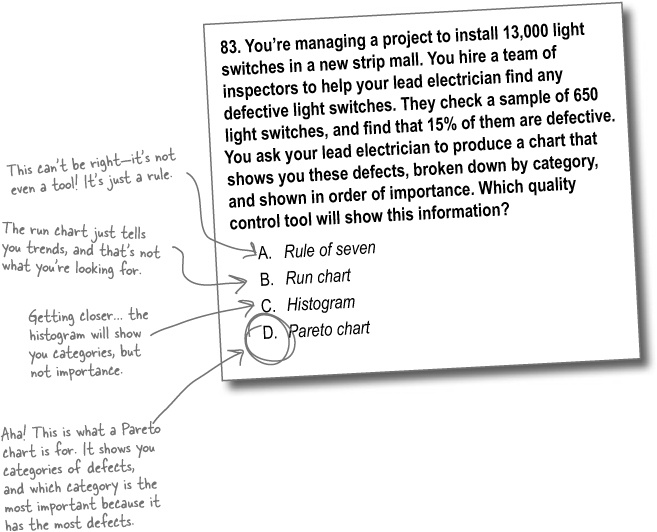
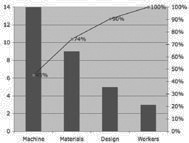
Pareto charts help you to figure out which problems need your attention right away. They’re based on the idea that a large number of problems are caused by a small number of causes. In fact, that’s called the 80/20 rule—80% of the defects are usually caused by 20% of the causes. Pareto charts plot out the frequency of defects and sort them in descending order. The right axis on the chart shows the cumulative percentage. For the example here, the most defects are caused by scope issues. So, improving the way projects are scoped would be the best way to prevent defects in upcoming projects.
Flowcharts let you show how processes work visually. You can use a flowchart to show how the tasks in your project interrelate and what they depend on. They are also good for showing decision-making processes.
The example on the left shows a high-level view of a software development process. First, the high-level scope is decided, then the requirements, and then the design. After design there is a decision to be made: Does the design pass a review? If yes, then move on to the build phase; if no, there’s still some design work to do. After the build process, the product needs to pass its unit tests to make it into the test phase.
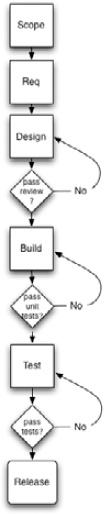
The flowchart helps you to see how all of the phases relate to each other. Sometimes the way you are working is responsible for defects in your product. Flowcharts help you get a handle on the way you are working by showing you a picture of the whole process.
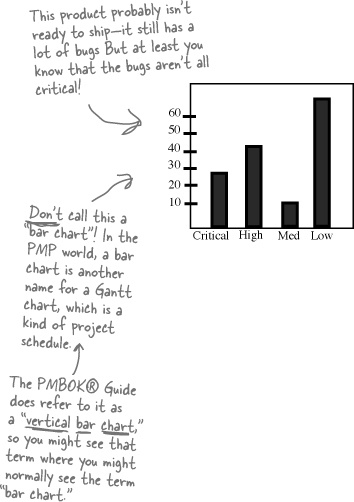
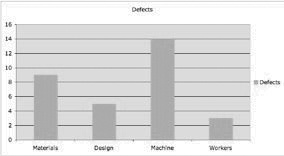
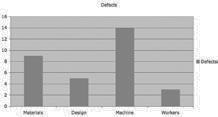
Histograms give you a good idea of how your data breaks down. If you heard that your product had 158 defects, you might think that they were all critical. So looking at a chart like the one above would help you to get some perspective on the data. A lot of the bugs are low priority. It looks like only 28 or so are critical. Histograms are great for helping you to compare characteristics of data and make more informed decisions.
Run charts and scatter diagrams
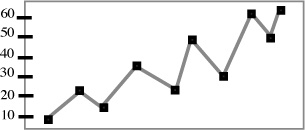
Run charts tell you about trends in your project by showing you what your data looks like as a line chart. If the line in the chart were the number of defects found in your product through each quality activity, that would tell you that things were getting worse as your project progressed. In a run chart, you are looking for trends in the data over time. Does it seem to be going up or down as the project progresses? Is there a steady climb or a spike when a particular activity occurs?
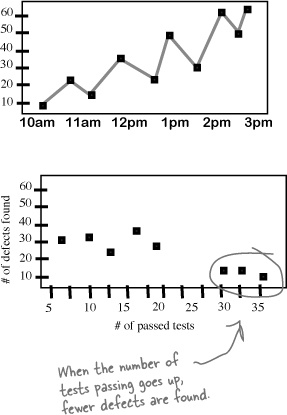
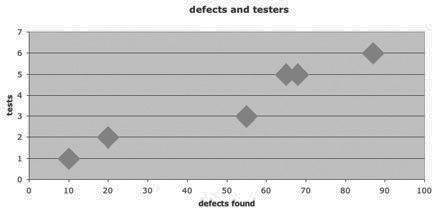
Scatter diagrams show how two different types of data relate to each other. If you worked with your test team to create a bunch of new tests, you might use a scatter diagram to see if the new test cases had any impact on the number of defects you found. The chart here shows that as more test cases pass, fewer defects are found.
More quality control tools
Inspection is what you’re doing when you look at the deliverables and see if they conform to requirements. It’s important to remember that you don’t just inspect the final product. You also look at all of the deliverables that are made along the way.
Approved change request review is when you inspect a repaired defect to be sure that it is actually fixed.
Note
It’s not enough to fix defects. You need to be sure that they don’t cause more damage once they’re fixed.
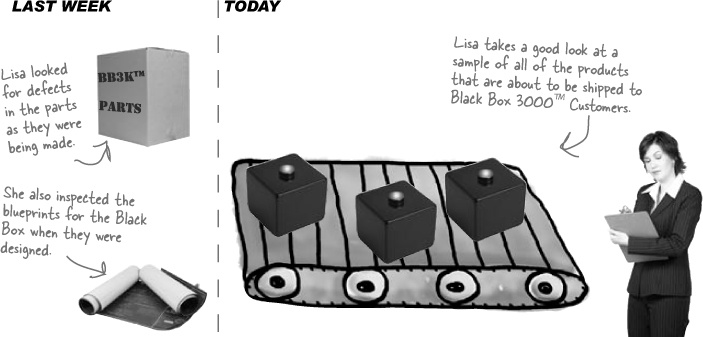
Statistical sampling helps you make decisions about your product without looking at each and every thing you make. Lisa is responsible for the quality of the Black Box 3000TM, but there’s no way she can inspect each one as it comes off the assembly line. It makes sense for her to take a sample of the products and inspect those. From that sample she can learn enough about the project to make good judgments.
Answer the questions about the Black Box 3000TM using the Quality Control Charts below.
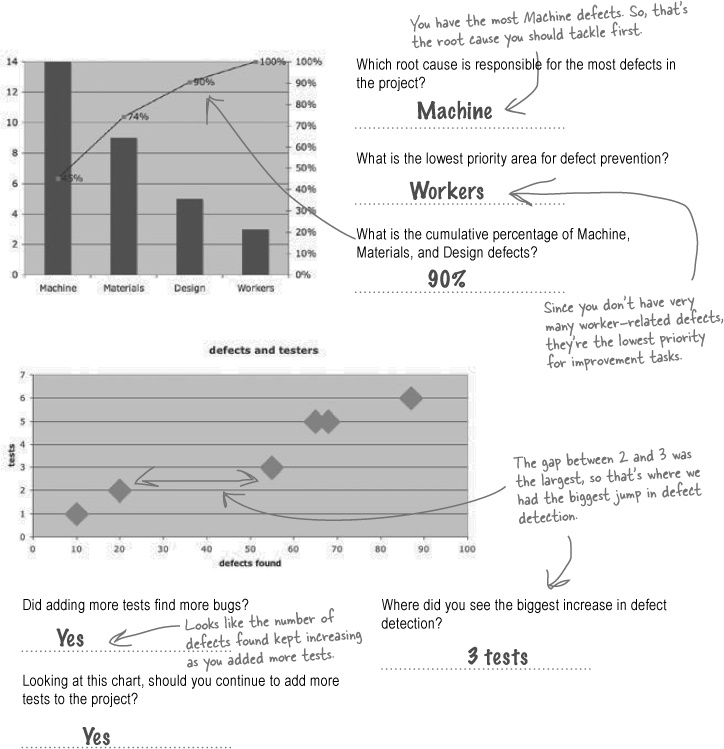
Which root cause is responsible for the most defects in the project?
___________________________

What is the lowest priority area for defect prevention?
___________________________
What is the cumulative percentage of Machine, Materials, and Design defects?
___________________________
Note
Hint: Look for a gap in the chart that shows you how adding an extra test caught a lot more defects.
Did adding more tests find more bugs?
___________________________
Looking at this chart, should you continue to add more tests to the project?
___________________________
Where did you see the biggest increase in defect detection?
___________________________
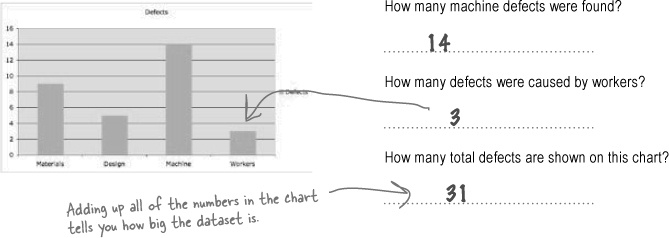
How many machine defects were found?
___________________________
How many defects were caused by workers?
___________________________
How many total defects are shown on this chart?
___________________________

Circle the data points that make up the rule of seven.
Is this process in control?
___________________________
What’s the mean temperature reading?
___________________________
What’s the upper control limit?
___________________________
What’s the lower control limit?
___________________________

Question Clinic: The “Which-One” Question

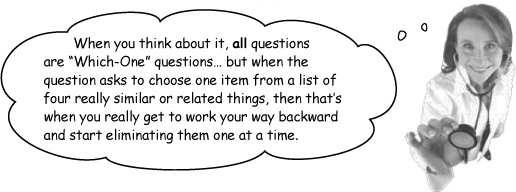
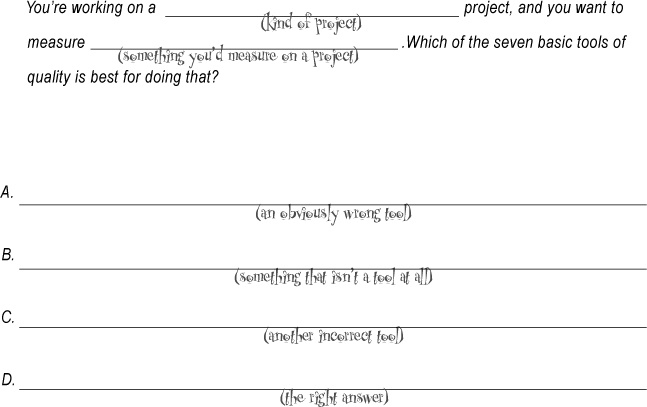
Fill in the blanks to come up with your own “Which-One” question! Start by thinking of the correct tool and then figure out three really similar answers that sound right, but can’t be because the question gives more specific details allowing you to eliminate the wrong ones.
Join the Head First PMP community at http://www.headfirstlabs.com/PMP You can add your Head Libs answer, and see what Head Libs other project managers came up with!

Quality control means finding and correcting defects
When you look for bugs in your deliverables, you produce two kinds of things: outputs from the inspections and outputs from the repairs you’ve made. All of the outputs of the Perform Quality Control process fall into those two categories.

Quality control measurements are all of the results of your inspections: the numbers of defects you’ve found, numbers of tests that passed or failed—stuff like that. You’ll use them when you look at the overall process you are using in your company to see if there are trends across projects.
Lessons Learned Updates are where you keep a record of all of the major problems that you solve in the course of your project so that you can use them later.
Completed Checklists are records of quality activities that are performed through the course of the project and what happened. It’s a good idea to keep records of the results of reviews and quality tests.
Note
There’s just one output here, Organizational Process Assets Updates. You’ll store your lessons learned and records of your completed checklists in your Organizational Process Asset library.
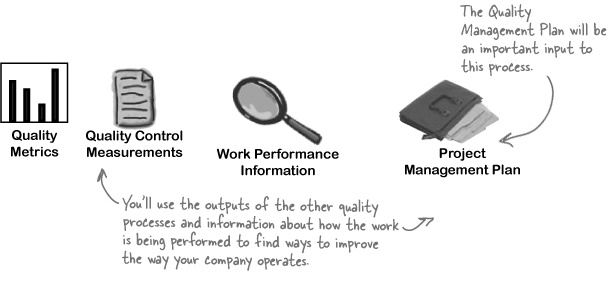
Project management plan updates You may need to update the Quality Management Plan and the Process Improvement Plan, which are both sub-plans of the Project Management Plan.
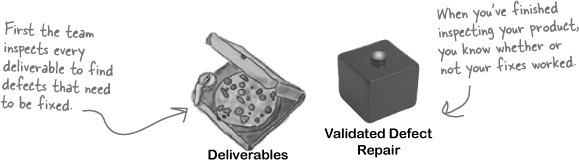
Validated deliverables and validated changes are two of the most important outputs of Perform Quality Control. Every single deliverable on the project needs to be inspected to make sure it meets your quality standards. If you find defects, the team needs to fix them—and then those repairs need to be checked, to make sure the defects are now gone.
Change Requests are recommended or preventative actions that also require changes to the way you are doing your project. Those kinds of changes will need to be put through change control, and the appropriate baselines and plans will need to be updated if they are approved.
Project document updates might need to be made. You might discover that your company’s quality standards need to be updated, because something you thought was a defect might not be a defect after all!
Trouble at the Black Box 3000TM factory
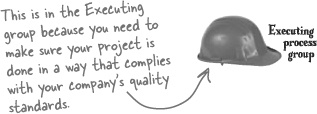
It’s not enough to inspect your deliverables. Sometimes it’s the way you work that’s causing your problems. That’s why you need to spend some time thinking about how you will make sure you are doing the work efficiently and with as few defects as possible. The Perform Quality Assurance process is about tracking the way you work and improving it all of the time.
Introducing Quality Assurance
In the Perform Quality Assurance process, you take all of the outputs from Plan Quality and Perform Quality Control and look at them to see if you can find ways to improve your process. If you find improvements, you recommend changes to your process and your individual project plan to implement them.

Plan Quality tools and techniques are all of the tools you used in Plan Quality. They come in handy when reviewing your process, too.
Perform Quality Control tools and techniques are all of the tools from Perform Quality Control. You can use histograms, control charts, and flowcharts—all of them can be used to help you figure out how your process is working.
Quality Audits are reviews of your project by your company. They figure out whether or not you are following the company’s process.
Process Analysis is when you look at your process to find out how to make it better. You use your process improvement plan to do this one.

A closer look at some tools and techniques
Fixing the bugs in your project solves the problems that give you trouble. But fixing bugs in your process means that other projects can learn from the problems you’ve faced and avoid your project’s bugs altogether. The tools that are used in quality assurance are the same as the ones in quality control, but they’re used to examine the process rather than the project.
Note
Even if your company has the best process in the world, it doesn’t do your project any good if you don’t follow it!.
Quality Audits are when your company reviews your project to see if you are following its processes. The point is to figure out if there are ways to help you be more effective by finding the stuff you are doing on your project that is inefficient or that causes defects. When you find those problem areas, you recommend corrective actions to fix them.
Note
A lot of companies have Quality Assurance departments whose job is to perform these audits and report findings from projects to a process group.
Process Analysis means following your process improvement plan to compare your project’s process data to goals that have been set for your company. If you find that the process itself needs to change, you recommend those changes to the company and sometimes update Organizational Process Assets as well as your own project management plan to include your recommendations.
Note
When Lisa noticed that the warehouse was full of black box parts that weren’t needed yet, she was really noticing a problem with the process. Why spend money on overstocked inventory?
Note
Here’s another example. If you created a Pareto chart that showed all of the defects in all of your projects, you could find the one or two categories of defects that caused problems for the whole company. Then you could get all of the PMs together to figure out an improvement that they could all make that would help the whole company.
Perform Quality Control tools and techniques are the same ones you already know about from earlier in this chapter. But instead of using them to look for problems with specific defects, you’ll use them to look at your overall process. A good example of this is using a control chart to see if your whole process is in control. If it’s not, then you’ll want to make a change to the whole way you do your work in order to bring it under control.
More ideas behind quality assurance
There are a couple more things you need to know about quality assurance. These are some of the most important ideas behind modern quality and process improvement.
Kaizen means continuous improvement. It’s all about constantly looking at the way you do your work and trying to make it better. Kaizen is a Japanese word that means improvement. It focuses on making small improvements and measuring their impact. Kaizen is a philosophy that guides management, rather than a particular way of doing quality assurance.
Just-In-Time means keeping only the inventory you need on hand when you need it. So, instead of keeping a big inventory of parts sitting around, the Black Box company might have only the parts they need for that day. Some companies have done away with warehouses all together and had production lines take the parts directly off the trucks to do the work. If you’re working in a Just In Time shop, quality is really important because there isn’t any extra inventory to deal with mistakes.
Note
Plan-Do-Check-Act was created by Walter Shewhart, who also created the control chart while he was working at Bell Labs in the 1920s.
Plan-Do-Check-Act is one way to go about improving your process, and it’s used by a lot of Kaizen practitioners. It was popularized by a well known quality theorist named W. Edwards Deming and is also known as The Deming Cycle. Plan-Do-Check-Act is about making small improvements, and measuring how much benefit they make before you change your process to include them. Here’s how it works:


You’re right. The Perform Quality Assurance process is all about improving the process, and that isn’t what most of project management is about. But your project is really affected by the process you are working in, so you should really understand it and help to make it better wherever you can. The bottom line is that your project has a better chance of succeeding if you stay involved with process improvement and keep your eye on how your project stacks up to your company’s expectations of quality and process.
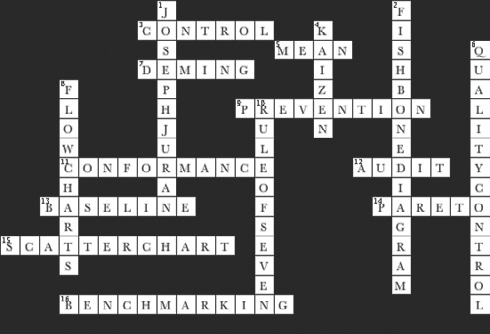
Take some time to sit back and give your right brain something to do. It’s your standard crossword; all of the solution words are from this chapter.

Across | Down |
3. When a process has data points above the upper limit or below the lower limit, those data points are out of _________. 5. The middle line on a control chart. 7. The quality theorist who popularized Plan-Do-Check-Act. 9. ______________ is more important than inspection in Quality Management. 11. An important definition of quality is ________________ to requirements. 12. Tool used to make sure your project is following the company’s process. 13. What you compare your work performance information to. 14. Tool for finding the 20% of root causes responsible for 80% of defects. 15. Tool for comparing two kinds of data to see if they are related. 16. Tool used in Plan Quality to set numeric goals for your project. | 1. Quality theorist who came up with the idea of Fitness For Use 2. Tool for finding the root cause of a defect. 4. Synonym for continuous improvement. 6. Process where you inspect deliverables to look for defects. 8. Tools that help you visualize processes and all of their decision points. 10. Heuristic that says that seven data points on one side of the mean requires investigation. |
![]() Answers in Qualitycross.
Answers in Qualitycross.
Choose whether the tools are being used for Perform Quality Control or Perform Quality Assurance.
You use a Pareto chart to figure out which root causes are responsible for the most defects in the current batch of Black Boxes. It looks like most of them are coming from a Machine Calibration problem. So you run them back through the machine after recalibrating it.
You use a histogram to look at the root cause category for all defects that have been found over the past year. You find that Machine errors are habitually responsible for the largest number of errors across all batches of Black Boxes. You schedule Machine calibration checks at the start of every shift to be sure that the machine is always set properly.
You look at defects in all of the inspection runs for the past year and notice that you seem to be finding more and more defects per inspection as time goes on. You create a quality task force to try to figure out what is causing these defects.


![]() Answers in Exercise Solution.
Answers in Exercise Solution.
The Black Box 3000TM makes record profits!
People who bought the product were thrilled with it. They were happy that the Black Box company always kept its promises and the products were always high quality. The company managed to save a lot of money by implementing process improvement measures that caught defects before they cost too much money to fix. And Lisa got a big promotion—now she’s in charge of quality assurance for the whole company. Great job, Lisa!

Take a look at each of these situations and figure out if they’re talking about quality or grade.
You ordered mushrooms on your pizza, but you got onions.
You called the pizza parlor to complain and the guy yelled at you.
The pizza arrived but it had canned mushrooms.
The pizza was cold.
You just got a brand new luxury car that cost a whole lot of money.
But it’s in the shop every two weeks.
Your neighbors make fun of you because your chrome hubcaps aren’t very classy...
... even though they do a great job of protecting the wheels from dirt, which is why you bought them in the first place.

Take some time to sit back and give your right brain something to do. It’s your standard crossword; all of the solution words are from this chapter.
Across
3. When a process has data points above the upper limit or below the lower limit, those data points are out of _________.
5. The middle line on a control chart.
7. The theorist who came up with Plan-Do-Check-Act.
9. ______________ is more important than inspection in Quality Management.
11. An important definition of quality is ________________ to requirements.
12. Tool used to make sure your project is following the company’s process.
13. What you compare your work performance information to.
14. Tool for finding the 20% of root causes responsible for 80% of defects.
15. Tool for comparing two kinds of data to see if they are related.
16. Tool used in Plan Quality to set numeric goals for your project.
Down
1. Quality theorist who came up with the idea of Fitness For Use.
2. Tool for finding the root cause of a defect.
4. Synonym for continuous improvement.
6. Process where you inspect deliverables to look for defects.
8. Tools that help you visualize processes and all of their decision points.
10. Heuristic that says that seven data points on one side of the mean requires investigation.
Choose whether the tools are being used for Perform Quality Control or Perform Quality Assurance.
You use a Pareto chart to figure out which root causes are responsible for the most defects in the current batch of black boxes. It looks like most of them are coming from a Machine Calibration problem. So you run them back through the machine after re-calibrating it.
You use a histogram to look at the root cause category for all defects that have been found over the past year. You find that Machine errors are habitually responsible for the largest number of errors across all batches of Black boxes. You schedule Machine calibration checks at the start of every shift to be sure that the machine is always set properly.
You look at defects in all of the inspection runs for the past year and notice that you seem to be finding more and more defects per inspection as time goes on. You create a quality task force to try to figure out what is causing these defects.

1. Answer: C
It’s important for projects to produce a valuable product, but value isn’t really a part of quality. That’s why earned value is part of Cost Management, not Quality Management.
2. Answer: B
In the Perform Quality Control process, the team inspects the product for defects and uses the seven basic tools to analyze them. Since the defects came from inspection, you know it’s Perform Quality Control.
3. Answer: B
Cost of Quality is the time and money that you spend to prevent, find, or repair defects.
4. Answer: C
The Perform Quality Assurance process is all about how well your company meets its overall quality goals.
5. Answer: A
A manufacturer that uses Just In Time management is relying on its suppliers to deliver parts exactly when they’re needed. This saves costs, because they don’t have to warehouse a lot of spare parts.
Note
But those parts had better not have a lot of defects, because there aren’t a lot of spare parts lying around to do repairs!
6. Answer: D
Your project team needs to inspect ALL of the deliverables! That means every single thing that gets produced needs to be reviewed by team members, so they can find and repair defects.
7. Answer: B
A Pareto chart divides your defects into categories, and shows you the percentage of the total defects each of those categories represents. It’s really useful when you have a limited budget for Plan Quality and want to spend it where it’s most effective!
Note
Don’t forget that ALL deliverables need to be inspected, including the stuff you create—like the schedule, WBS, and project management plan. So you’ll get defects for them, too!
Watch it!
Don’t assume that just because you’re using a fishbone diagram, you’re always doing quality control! It’s also used in Risk Management; you’ll see that in Chapter 11. The key thing to watch for here is that the fishbone diagram is being used to find the root cause of a DEFECT, not a risk or something else.
8. Answer: C
Keep your eye out for questions asking you about Ishikawa or fishbone diagrams. When you use those tools to analyze defects, you’re in quality control.
9. Answer: B
A run chart is one of the seven basic tools of quality. It’s a long line graph that shows you the total number of defects that were found over time.
10. Answer: B
Inspection is when your team examines something that they produced for defects... and every single deliverable needs to be inspected! That’s what “prevention over inspection” means: if you produce a deliverable that’s needed later in the project today, it’s a lot cheaper to fix defects in it now than it will be when that deliverable is used later on in the project.
11. Answer: D
A lot of people get Quality Control and Verify Scope confused because they seem really similar. Both of them involve looking closely at deliverables to make sure that they meet requirements. But they serve really different purposes! You use Quality Control to find defects that you’re going to repair. Verify Scope happens at the very end of the Executing phase; it’s when you work with the stakeholder to get their formal acceptance for the deliverables.
12. Answer: B
Benchmarking is when you use previous projects to set quality guidelines for your current project. You can always find the results of the past projects in the Organizational Process Assets.
13. Answer: A
The rule of seven tells you that when seven consecutive data points on your control chart come out on the same side of the mean, you’ve got a process problem. That sounds a little complicated, but it’s actually pretty straightforward. Defects tend to be scattered around pretty randomly; in any project that makes a lot of parts, even if they’re all within the specification, you’ll get a couple of parts that are a little bigger, and a couple that are a little smaller. But if you have a bunch of them in a row that all run a little big, that’s a good indication that something’s gone wrong on your assembly line!
14. Answer: C
Going back and repairing defects can be a pretty risky activity, because it’s really easy to introduce new defects or not fully understand why the defect happened in the first place. Answer C says exactly that: you go back and review the defects to make sure they’re fixed.
15. Answer: D
A lot of times it’s impractical to check every single product that rolls off of your assembly line. Statistical sampling is a great tool for that; that’s when you pull out a small, random sample of the products and inspect each of them. If they’re all correct, then there’s a very good chance that your whole product is acceptable!
16. Answer: C
A lot of people get confused about the difference between Perform Quality Control and Perform Quality Assurance. Quality Control is where you inspect deliverables for defects, while Quality Assurance is where you audit the project to make sure the quality activities were performed properly.
Note
You inspect products for defects, and you can remember that because you’ll find an “inspected by #8” tag in a product. You audit processes, and you can remember that because when you get audited, they’re making sure you did your taxes correctly—they’re auditing your actions, not a product.
17. Answer: B
A flowchart is one of the seven basic tools of quality. You use it to analyze processes that are part of your project in order to look for quality problems and inefficiencies.
18. Answer: B
You’re analyzing the process, so you are using Perform Quality Assurance.
Note
Just because you see a Perform Quality Control tool, that doesn’t mean you’re in the Perform Quality Control process... because they’re also tools used in Perform Quality Assurance! You always need to figure out what you’re using them for.
19. Answer: D
Pareto charts are based on the 80/20 rule. They sort your defects in descending order by root cause. So you always know which 20% of root causes are responsible for 80% of defects on your project.
20. Answer: C
Perform Quality Control is where you inspect your work, including your repairs!