CHAPTER 15
Picking the Best Market Themes, Sectors, and Industry Groups
The majority of the leading stocks are usually in leading industries. Studies show that 37% of a stock’s price movement is directly tied to the performance of the industry group the stock is in. Another 12% is due to strength in its overall sector. Therefore, roughly half of a stock’s move is driven by the strength of its respective group. Because specific industry groups lead each market cycle, you can see how worthwhile it is to consider a stock’s industry before making a purchase.
For the purposes of this discussion, there are three terms we will use: sector, industry group, and subgroup. A sector is a broad grouping of companies and industries. These include, for example, basic industries (or “cyclicals”), consumer goods and services, transportation, finance, and high technology. An industry group is a smaller, more specific grouping of companies; there normally are several industry groups within a sector. A subgroup is even more specific, dividing the industry group into several very precise subcategories.
For example, if we were to look at Viacom, it could be described as follows: Sector: Leisure and Entertainment Industry; Group: Media; and Subgroup: Radio/TV. For clarity and ease of use, industry group and subgroup names are generally combined, with the result simply being called “industry groups.” For example, the industry group for Viacom is known as “Media—Radio/TV.”
Why Track 197 Industry Groups?
Why does IBD divide securities into 197 industry groups rather than, say, the smaller number of groups used by Standard & Poor’s? It’s simple really. The stocks within a given sector do not all perform at the same rate. Even if a sector is outperforming other sectors, there may be segments of that sector that are performing extremely well and others that are lagging the market. It’s important that you be able to recognize what industry group within the sector is acting the very best, since this knowledge can mean the difference between superior and mediocre results.
Early in our study of the market, we realized that many of the investment services available at the time did not adequately dissect the market into enough industry groups. It was therefore difficult to determine the specific part of a group where the true leadership was. So we created our own industry groups, breaking down the market into 197 different subcategories and providing you, the investor, with more accurate and detailed insights into the makeup of an industry. For example, the medical industry can be divided into hospital companies, generic drugs, dental, home nursing, genetics, biotech, and HMOs, plus a few other unique modern areas.
How You Can Decide Which Industry Groups Are Leading the Market
When analyzing industries, we’ve found that some are so small that signs of strength in the group may not be relevant. If there are only two small, thinly traded companies within a subindustry, that’s not enough to consider them a group. On the other hand, there are industries with too many companies, such as chemicals and savings and loans. This excessive supply does not add to these industries’ attractiveness, unless some extremely unusual changes in industry conditions occur.
The 197 industry groups mentioned earlier can be found each business day in Investor’s Business Daily. There we rank each subgroup according to its six-month price performance so that you can easily determine which industry subgroups are the true leaders. Buyers operating on the “undervalued” philosophy love to do their prospecting in the worst-ranked groups. But analysis has shown that, on average, stocks in the top 50 or 100 groups perform better than those in the bottom 100. To increase your odds of finding a truly outstanding stock in an outstanding industry, concentrate on the top 20 groups and avoid the bottom 20.
Both Investor’s Business Daily and the Daily Graphs Online charting services offer an additional, proprietary source of information to help you determine whether the stock you’re thinking about owning is in a top-flight industry group. The Industry Group Relative Strength Rating assigns a letter grade from A+ to E to each publicly traded company we follow, with A+ being best. A rating of A+, A, or A– means the stock’s industry group is in the top 24% of all industry groups in terms of price performance.
Every day I also quickly check the “New Price Highs” list in IBD. It is uniquely organized in order of the broad industry sectors with the most individual stocks that made new price highs the previous day. You can’t find this list in other business publications. Just note the top six or so sectors, particularly in bull markets. They usually pick up the majority of the real leaders.
Another way you can find out what industry groups are in or out of favor is to analyze the performance of a mutual fund family’s industry funds. Fidelity Investments, one of the nation’s successful mutual fund managers, has more than 35 industry mutual funds. A glance at their performance provides yet another excellent perspective on which industry sectors are doing better. I’ve found it worthwhile to note the two or three Fidelity industry funds that show the greatest year-to-date performance. This is shown in a small special table in IBD every business day.
For William O’Neil + Co.’s institutional clients, a weekly Datagraph service is provided that arranges the 197 industry groups in order of their group relative price strength for the past six months. Stocks in the strongest categories are shown in Volume 1 of the O’Neil Database books, and stocks in the weaker groups are in Volume 2.
During a time period in which virtually all daily newspapers, including the Wall Street Journal, significantly cut the number of companies they covered in their main stock tables every business day and/or drastically cut the number of key data items shown daily for each stock, here’s what Investor’s Business Daily did.
IBD’s stock tables are now organized in order of performance, from the strongest down to the weakest of 33 major economic sectors, such as medical, retail, computer software, consumer, telecom, building, energy, Internet, banks, and so on. Each sector combines NYSE and Nasdaq stocks so you can compare every stock available in each sector to find the best stocks in the best sectors based on a substantial number of key variables.
IBD now gives you 21 vital time-tested facts on up to 2,500 leading stocks in its stock tables each business day . . . more than virtually all other daily newspapers in America. These 21 facts are
1. An overall composite ranking from 1 to 99, with 99 best.
2. An earnings per share growth rating comparing each company’s last two quarters and last three years’ growth with those of all other stocks. A 90 rating means the company has outperformed 90% of all stocks in a critical measurement, earnings growth.
3. A Relative Price Strength rating comparing each stock’s price change over the last 12 months with those of all other stocks. Better firms rate 80 or higher on both EPS and RS.
4. A rating comparing a stock’s sales growth rate, profit margins, and return on equity to those of all other stocks.
5. A highly accurate proprietary accumulation/distribution rating that uses a price and volume formula to gauge whether a stock is under accumulation (buying) or distribution (selling) in the last 13 weeks. “A” denotes heavy buying; “E” indicates heavy selling.
6 & 7. Volume % change tells you each stock’s precise percentage change above or below its average daily volume for the past 50 days along with its total volume for the day.
8 & 9. The current and recent relative performance of each stock’s broad industry sector.
10–12. Each stock’s 52-week high price, closing price, and change for the day.
13–21. Price/earnings ratio, dividend yield, if the company repurchased its stock in the last year, if the stock has options, if company earnings will be reported in the next four weeks, if the stock was up 1 point or more or made a new high, if the stock was down 1 point or more or made a new low, if the stock had an IPO in the last fifteen years and has an EPS and RS rating of 80 or higher, and if a recent IBD story on the company is archived at Investors.com.
Not only does IBD follow more stocks and provide more vital data, but the table print size is much larger and easier to read.
As of this writing in February 2009, the medical sector is number one. These ratings will change as the weeks and months go by and market conditions, news, and data change. I believe these significant and relevant data for serious investors, regardless of whether they are new or experienced, are light-years ahead of the data provided by most of IBD’s competitors. IBD is the #1 daily business newspaper for investors.
Considering some of the seeming disasters coming out of Wall Street and the big-city banking community in 2008, we believe we are and have been providing the American public—with our many books like the one you’re reading, home study courses, more than a thousand seminars and workshops nationwide, plus Investor’s Business Daily—a source of relevant, sound education, help, and guidance in an otherwise complex but key area that much of the investment community and Washington may not have always handled as well.
The Importance of Following Industry Trends
If economic conditions in 1970 told you to look for an improvement in housing and a big upturn in building, what stocks would you have included in your definition of the building sector? If you had acquired a list of them, you’d have found that there were hundreds of companies in that sector at the time. So how would you narrow down your choices to the stocks that were performing best? The answer: look at them from the industry group and subgroup levels.
There were actually 10 industry groups within the building sector for investors to consider during the 1971 bull market. That meant there were 10 different ways you could have played the building boom. Many institutional investors bought stocks ranging from lumber producer Georgia Pacific to wallboard leader U.S. Gypsum to building-products giant Armstrong Corp. You could have also gone with Masco in the plumbing group, a home builder like Kaufman & Broad, building-material retailers and wholesalers like Standard Brands Paint and Scotty’s Home Builders, or mortgage insurers like MGIC. Then there were manufacturers of mobile homes and other low-cost housing, suppliers of air-conditioning systems, and makers and sellers of furniture and carpets.
Do you know where the traditional building stocks were during 1971? They spent the year in the bottom half of all industry groups, while the newer building-related subgroups more than tripled!
The mobile home group crossed into the top 100 industry groups on August 14, 1970, and stayed there until February 12, 1971. The group returned to the top 100 on May 14, 1971, and then fell into the bottom half again later the following year, on July 28, 1972. In the prior cycle, mobile homes were in the top 100 groups in December 1967 and dropped to the bottom half only in the next bear market.
The price advances of mobile home stocks during these positive periods were spellbinding. Redman Industries zoomed from a split-adjusted $6 to $56, and Skyline moved from $24 to what equaled $378 on a presplit basis. These are the kind of stocks that charts can help you spot if you learn to read charts and do your homework. We study the historical model of all these past great leaders and learn from them.
From 1978 to 1981, the computer industry was one of the leading sectors. However, many money managers at that time thought of the industry as consisting only of IBM, Burroughs, Sperry Rand, Control Data, and the like. But these were all large mainframe computer manufacturers, and they failed to perform during that cycle. Why? Because while the computer sector was hot, older industry groups within it, such as mainframe computers, were not.
Meanwhile, the computer sector’s many new subdivisions performed unbelievably. During that period, you could have selected new, relatively unknown stocks from groups such as minicomputers (Prime Computer), microcomputers (Commodore International), graphics (Computervision), word processors (Wang Labs), peripherals (Verbatim), software (Cullinane Database), or time-sharing (Electronic Data Systems). These fresh new entrepreneurial winners increased five to ten times in price. (That’s the “New” in CAN SLIM.) No U.S. administration can hold back America’s inventors and innovators for very long—unless it is really stifling business and the country.
During 1998 and 1999, the computer sector led again, with 50 to 75 computer-related stocks hitting the number one spot on Investor’s Business Daily’s new high list almost every day for more than a year. If you were alert and knew what to look for, it was there to be seen. It was Siebel Systems, Oracle, and Veritas in the enterprise software group, and Brocade and Emulex among local network stocks that provided new leadership. The computer–Internet group boomed with Cisco, Juniper, and BEA Systems; and EMC and Network Appliance had enormous runs in the memory group; while the formerly leading personal computer group lagged in 1999. After their tremendous increases, most of these leaders then topped in 2000 along with the rest of the market.
Many new subgroups have sprung up since then, and many more will spring up in the future as new technologies are dreamed up and applied. We are in the computer, worldwide communications, and space age. New inventions and technologies will spawn thousands of new and superior products and services. We’re benefiting from an endless stream of ingenious offshoots from the original mainframe industry, and in the past they came so fast we had to update the various industry categories in our database more frequently just to keep up with them.
There is no such thing as “impossible” in America’s free enterprise system. Remember, when the computer was first invented, experts thought the market for it was only two, and one would have to be bought by the government. And the head of Digital Equipment later said he didn’t see why anyone would ever want a computer in her home. When Alexander Graham Bell invented the telephone, he was struggling and offered a half-interest in the telephone to the president of Western Union, who replied, “What could I do with an interesting toy like that?” Walt Disney’s board of directors, his brother, and his wife didn’t like Walt’s idea to create Disneyland.
In the bull market from 2003 to 2007, two of the best leaders in 1998 and 1999, America Online and Yahoo!, failed to lead, and new innovators like Google and Priceline.com moved to the head of the pack. You have to stay in phase with the new leaders in each new cycle. Here’s a historical fact to remember: only one of every eight leaders in a bull market reasserts itself as a leader in the next bull market. The market usually moves on to new leadership, and America keeps growing, with new entrepreneurs offering you, the investor, new opportunities.
A Look at Industries of the Past and What’s Coming in the Future
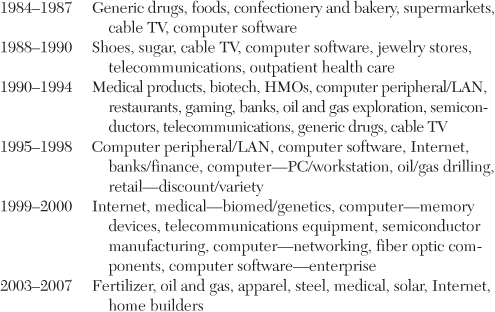
At one time, computer and electronic stocks may outperform. In another period, retail or defense stocks will stand out. The industry that leads in one bull market normally won’t come back to lead in the next, although there have been exceptions. Groups that emerge late in a bull phase are sometimes early enough in their own stage of improvement to weather a bear market and then resume their advance, assuming leadership when a new bull market starts.
These were the leading industry groups in each bull market from 1953 through 2007:

As you might imagine, industries of the future create gigantic opportunities for everyone. While they occasionally come into favor, industries of the past offer less dazzling possibilities.
There were a number of major industries, mainly cyclical ones, that were well past their peaks as of 2000. Many of them, however, came back from a poor past to stronger demand from 2003 to 2007 as a result of the enormous demand from China as it copied what the United States did in the early 1900s, when we created and built an industrial world leader.
China, with its long border with Russia, witnessed firsthand the 70-year-old communist Soviet Union implode and disappear into the ash heap of history. The Chinese learned from the enormous growth and higher standard of living created in America that its model had far more potential for the Chinese people and their country. Most Chinese families want their one child to get a college education and learn to speak English. Families in India have many of the same aspirations.
Here is a list of these old-line industries:
1. Steel
2. Copper
3. Aluminum
4. Gold
5. Silver
6. Building materials
8. Oil
9. Textiles
10. Containers
11. Chemicals
12. Appliances
13. Paper
14. Railroads and railroad equipment
15. Utilities
16. Tobacco
17. Airlines
18. Old-line department stores
Industries of the present and future might include
1. Computer medical software
2. Internet and e-commerce
3. Laser technology
4. Defense electronics
5. Telecommunications
6. New concepts in retailing
7. Medical, drug, and biomedical/genetics
8. Special services
9. Education
Possible future groups might include wireless, storage area networking, person-to-person networking, network security, palmtop computers, wearable computers, proteomics, nanotechnology, and DNA-based microchips.
Tracking Nasdaq and NYSE Stocks Together Is Key
Groups that emerge as leaders in a new bull market cycle can be found by observing unusual strength in one or two Nasdaq stocks and relating that strength to similar power in a listed stock in the same group.
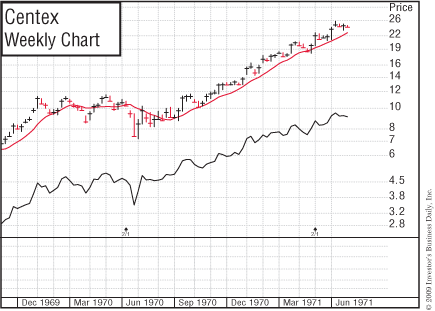
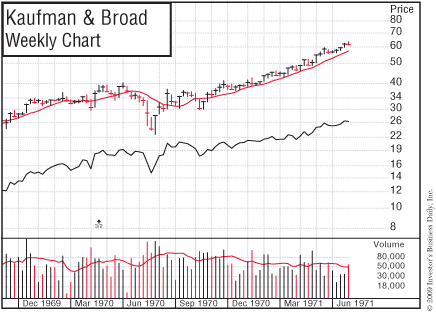
Initial strength in only one listed stock is not sufficient to attract attention to a category, but confirmation by one or two kindred Nasdaq issues can quickly steer you to a possible industry recovery. You can see this by looking at the accompanying charts of home builder Centex’s OTC-traded stock from March to August of 1970, and of home builder Kaufman & Broad’s NYSE-listed shares from April to August of the same year:
1. Centex’s relative strength in the prior year was strong, and it made a new high three months before the stock price did.
2. Earnings accelerated (by 50%) during the June 1970 quarter.
3. The stock was selling near an all-time high at the bottom of a bear market.
4. A strong Centex base coincided with the base in Kaufman & Broad.
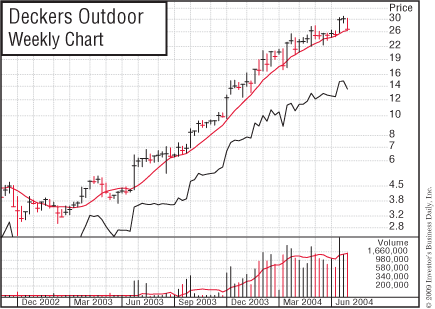
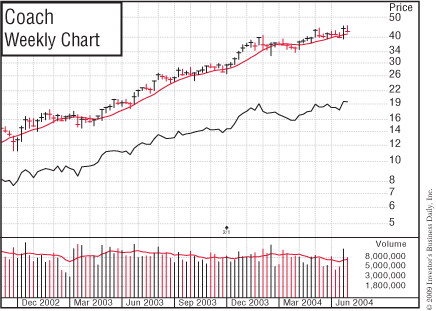
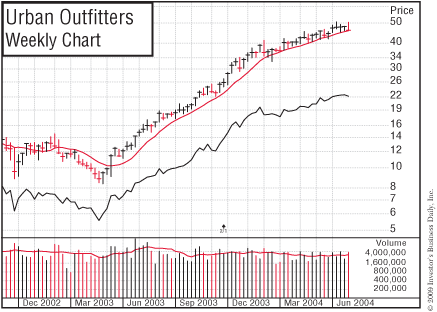
In the 2003 bull market, Coach (COH) was a NYSE-listed stock that we found on our weekly review of charts as it broke out of its base on February 28. It gave another buy point on April 25 when it bounced off its 10-week
moving average price line. However, this time the new bull market had begun in earnest after a major market follow-through day in the market averages, and on April 25 two other leaders in the retail clothing industry—Urban Outfitters (URBN) and Deckers Outdoor (DECK)—broke out at the same time as the Coach move. Now there was plenty of evidence, from one NYSE stock and two Nasdaq issues in the same industry group, of a powerful new group coming alive for the new bull market that had just started. This is one more reason IBD’s NYSE and Nasdaq tables are combined and the stocks are shown by industry sectors. You can spot all the leaders more easily when they’re together in a group.
A Key Stock’s Weakness Can Spill Over to the Group
Grouping and tracking stocks by industry group can also help you get out of weakening investments faster. If, after a successful run, one or two important stocks in a group break seriously, the weakness may sooner or later “wash over” into the remaining stocks in that field. For example, in February 1973, weakness in some key building stocks suggested that even stalwarts such as Kaufman & Broad and MGIC were vulnerable, despite the fact that they were holding up well. At the time, fundamental research firms were in unanimous agreement on MGIC. They were sure that the mortgage insurer had earnings gains of 50% locked in for the next two years, and that the company would continue on its merry course, unaffected by the building cycle. The fundamental stock analysts were wrong; MGIC later collapsed along with the rest of the deteriorating group.
In the same month, ITT traded between $50 and $60 while every other stock in the conglomerate group had been in a long decline. The two central points overlooked by four leading research firms that recommended ITT in 1973 were that the group was very weak and that ITT’s relative strength was trending lower, even though the stock itself was not.
Oil and Oil Service Stocks Top in 1980–1981
This same “wash-over effect” within groups was also seen in 1980–1981. After a long advance in oil and oil service stocks, our early warning criteria caused our institutional services firm to put stocks such as Standard Oil of Indiana, Schlumberger, Gulf Oil, and Mobil on the “sell/avoid” side, meaning we felt they should be avoided or sold.
A few months later, data showed that we had turned negative on almost the entire oil sector, and that we had seen the top in Schlumberger, the most outstanding of all the oil service companies. Based objectively on all the historical data, you had to conclude that, in time, the weakness would wash over into the entire oil service industry. Therefore, we also added equities such as Hughes Tool, Western Co. of North America, Rowan Companies, Varco International, and NL Industries to the sell/avoid list even though the stocks were making new price highs and showed escalating quarterly earnings—in some cases by 100% or more.
These moves surprised many experienced professionals on Wall Street and at large institutions, but we had studied and documented how groups historically had topped in the past. Our actions were based on historical facts and sound principles that had worked over decades, not on analysts’ personal opinions or possibly one-sided information from company officials.
Our service is totally and completely different from that of all Wall Street research firms because we do not hire analysts, make buy or sell recommendations, or write any research reports. We use supply-and-demand charts, facts, and historical precedents that now cover all common stocks and industries from the 1880s through 2008.
The decision to suggest that clients avoid or sell oil and oil service stocks from November 1980 to June 1981 was one of our institutional firm’s more valuable calls at the time. We even told a Houston seminar audience in October 1980 the entire oil sector had topped. A full 75% of those in attendance owned petroleum stocks. They probably didn’t believe a word we said. We were not aware at the time, or even in the several months following, of any other New York Stock Exchange firm that had taken that same negative stand across the board on the energy and related drilling and service sectors. In fact, the exact opposite occurred. Because of such decisions, William O’Neil + Co. became a leading provider of historical precedent ideas to many of the nation’s top institutional investors.
Within a few months, all these stocks began substantial declines. Professional money managers slowly realized that once the price of oil had topped and the major oil issues were under liquidation, it would be only a matter of time before drilling activity would be cut back.
In the July 1982 issue of Institutional Investor magazine, ten energy analysts at eight of the largest and most respected brokerage firms took a different tack. They advised purchasing these securities because they appeared cheap and because they had had their first correction from their price peak. This is just another example of how personal opinions, even if they come from the highest research places or bright young MBAs from outstanding Ivy League universities, are quite often wrong when it comes to making and preserving money in the stock market.
The same situation repeated again in 2008 when we put Schlumberger on the sell/avoid list at $100 on July 3. It closed below its 10-week average and fell to $35 in eight months. Most of the oils were removed from our list on June 20th and they all slowly began their topping process as a group. Many institutions, on analysts’ recommendations, bought the oils too soon on the way down because they seemed a bargain. Oil itself was midway in the process of collapsing from $147 a barrel to its eventual low of $35.
In August 2000, a survey showed many analysts had high-tech stocks as strong buys. Six months later, in one of the worst markets in many years, roughly the same proportion of analysts still said tech stocks were strong buys. Analysts certainly missed with their opinions. Only 1% of them said to sell tech stocks. Opinions, even by experts, are frequently wrong; markets rarely are. So learn to read what the market is telling you, and stop listening to ego and personal opinions. Analysts who don’t understand this are destined to cause some substantial losses for their clients. We measure historical market facts, not personal opinions.
We do not visit or talk to any companies, have analysts to write research reports, or have or believe in inside information. Nor are we a quantitative firm. We tell our institutional subscribers who have teams of fundamental analysts to have their analysts check with their sources and the companies concerned to decide which of our rather unusual ideas based on historical precedent may be sound and right fundamentally and which are possibly not right. Institutions have always had a prudent personal responsibility for the stocks they invest in. We make our mistakes too, because the stock market is never a certainty. But when we make mistakes, we correct them rather than sit with them.
The Bowling Boom Tops in 1961
Beginning in 1958 and continuing into 1961, Brunswick’s stock made a huge move. The stock of AMF, which also made automatic pinspotters for bowling alleys, gyrated pretty much in unison with Brunswick. After Brunswick peaked in March 1961, it rallied back to $65 from $50, but for the first time, AMF did not recover along with it. This was a tip-off that the entire group had made a long-term top, that the rebound in Brunswick wasn’t going to last, and that the stock—as great as it had been—should be sold.
One practical, commonsense industry rule is to avoid buying any stock unless its strength and attractiveness are confirmed by at least one other important stock in the same group. You can get away without such confirmation in a few cases where the company does something truly unique, but these situations are very few in number. From the late 1980s to the late 1990s, Walt Disney fell into this category: a unique high-quality entertainment company rather than just another filmmaker in the notoriously unsteady, less-reliable movie group.
Two other valuable concepts turned up as we built historical models in the stock market. The first we named the “follow-on effect,” and the second, the “cousin stock theory.”
The “Follow-On Effect”
Sometimes, a major development takes place in one industry and related industries later reap follow-on benefits. For example, in the late 1960s, the airline industry underwent a renaissance with the introduction of jet airplanes, causing airline stocks to soar. A few years later, the increase in air travel spilled over to the hotel industry, which was more than happy to expand to meet the rising number of travelers. Beginning in 1967, hotel stocks enjoyed a tremendous run. Loews and Hilton were especially big winners. The follow-on effect, in this case, was that increased air travel created a shortage of hotel space.
When the price of oil rose in the late 1970s, oil companies began drilling like mad to supply the suddenly pricey commodity. As a result, higher oil prices fueled a surge not only in oil stocks in 1979, but also in the stocks of oil service companies that supplied the industry with exploration equipment and services.
The roaring success of small- and medium-sized computer manufacturers during the 1978–1981 bull market created follow-on demand for computer services, software, and peripheral products in the market resurgence of late 1982. As the Internet took off in the mid-1990s, people discovered an insatiable demand for faster access and greater bandwidth. Soon networking stocks surged, with companies specializing in fiber optics enjoying massive gains in their share prices.
The “Cousin Stock” Theory
If a group is doing exceptionally well, there may be a supplier company, a “cousin stock,” that’s also benefiting. As airline demand grew in the mid-1960s, Boeing was selling a lot of new jets. Every new Boeing jet was outfitted with chemical toilets made by a company called Monogram Industries. With earnings growth of 200%, Monogram stock had a 1,000% advance.
In 1983, Fleetwood Enterprises, a leading manufacturer of recreational vehicles, was a big winner in the stock market. Textone was a small cousin stock that supplied vinyl-clad paneling and hollow-core cabinet doors to RV and mobile home companies.
If you notice a company that’s doing particularly well, research it thoroughly. In the process, you may discover a supplier company that’s also worth investing in.
Basic Conditions Change in an Industry
Most group moves occur because of substantial changes in industry conditions.
In 1953, aluminum and building stocks had a powerful bull market as a result of pent-up demand for housing in the aftermath of the war. Wallboard was in such short supply that some builders offered new Cadillacs to gypsum board salespeople for just letting them buy a carload of their product.
In 1965, the onrush of the Vietnam War, which was to cost $20 billion or more, created solid demand for electronics used in military applications and defense during the war. Companies such as Fairchild Camera climbed more than 200% in price.
In the 1990s, discount brokerage firms continued to gain market share relative to full-service firms as investing became more and more mainstream. At that time, a historical check proved that Charles Schwab, one of the most successful discount brokerage firms, had performed as well as market leader Microsoft during the preceding years—a valuable fact few people knew then.
Watch for New Trends as They Develop
In our database research, we also pay attention to the areas of the country where corporations are located. In our ratings of companies as far back as 1971, we assigned extra points for those headquartered in Dallas, Texas, and other key growth or technology centers, such as California’s Silicon Valley. Recently, however, California’s high-cost, high-tax business environment has caused a number of companies to move out of the state to Utah, Arizona, and the Southwest.
Shrewd investors should also be aware of demographic trends. From data such as the number of people in various age groups, it’s possible to predict potential growth for certain industries. The surge of women into the workplace and the gush of baby boomers help explain why stocks like The Limited, Dress Barn, and other retailers of women’s apparel soared between 1982 and 1986.
It also pays to understand the basic nature of key industries. For example, high-tech stocks are 2½ times as volatile as consumer stocks, so if you don’t buy them right, you can suffer larger losses. Or if you concentrate most of your portfolio in them, they could all come down at the same time. So, be aware of your risk exposure if you get overconcentrated in the volatile hightech sector or any other possibly risky area.
Sometimes Defensive Groups May Flash General Market Clues
It’s also important for investors to know which groups are “defensive” in nature. If, after a couple of bull market years, you see buying in groups such as gold, silver, tobacco, food, grocery, and electric and telephone utilities, you may be approaching a top. Prolonged weakness in the utility average could also be signaling higher interest rates and a bear market ahead.
The gold group moved into the top half of all 197 industries on February 22, 1973. Anyone who was ferreting out such information at that time got the first crystal-clear warning of one of the worst market upheavals up to that point since 1929.
60% or More of Big Winners Are Part of Group Moves
Of the most successful stocks from 1953 through 1993, nearly two out of three were part of group advances. So remember, the importance of staying on top of your research and being aware of new group movements cannot be overestimated.
