CHAPTER 14
More Models of Great Stock Market Winners
Throughout this book, I’ve shown you and discussed many of the greatest winning stocks of the past. Now that you’ve been introduced to the CAN SLIM system of investing, you should know that we actually suggested some of these same companies to clients through our institutional services firm or bought them ourselves.
Regardless of your current position in life or your financial standing, it’s clearly possible for you to make your dreams come true using the CAN SLIM system. You may have heard or read about the thousands of individuals who have changed their lives using this book and Investor’s Business Daily. It really happens, and it can happen to you if you are determined and have an overpowering desire, no matter how large or small your account . . . as long as you make up your mind, work at it, and don’t ever let yourself get discouraged.
This chapter will introduce you to a few early examples of success using this system. There are many, many others. In addition, it will also introduce you to more of the great winning stocks since 1952. Study this chapter closely; you’ll find these patterns repeat over and over again throughout time. If you learn to recognize them early, you could get in on some future big profits, even if it takes some time.
Tracing the Growth of a Small Account
In 1961, with $10 from each of my classmates at Harvard’s Program for Management Development (PMD), we started the first PMD Fund with the grand total of $850. It was mostly for fun. Each classmate began with one $10 share in the fund. Marshall Wolf, then with National Newark & Essex Bank, and later an executive vice president at Midatlantic National Bank, had the thankless job of secretary-treasurer, keeping the records, informing the gang, and filing and paying taxes each year. I got the easy job of managing the money.
It’s an interesting account to study because it proves you can start very small and still win the game if you stick with sound methods and give yourself plenty of time. On September 16, 1986 (some 25 years later), after all prior taxes had been paid and with Marshall having later kept some money in cash, the account was worth $51,653.34. The profit, in other words, was more than $50,000, and each share was worth $518. That is nearly a 50-fold after-tax gain from less than $1,000 invested.
The actual buy and sell records in the accompanying table illustrate in vivid detail the execution of the basic investment methods we have discussed up to this point.
Note that while there were about 20 successful transactions through 1964, there were also 20 losing transactions. However, the average profit was around 20%, while the average loss was about 7%. If losses in Standard Kollsman, Brunswick, and a few others had not been cut, later severe price drops would have caused much larger losses. This small cash account was concentrated in only one or two stocks at a time. Follow-up buys were generally made if the security moved up in price.
The account made no progress in 1962, a bad market year, but it was already up 139% by June 6, 1963, before the first Syntex buy was made. By the end of 1963, the gain had swelled to 474% on the original $850 investment.
The year 1964 was lackluster. Worthwhile profits were made in 1965, 1966, and 1967, although nothing like 1963, which was a very unusual year. I won’t bore you with 20 pages of stock transactions. Let me just say that the next 10 years showed further progress, despite losses in 1969 and 1974.
Another period of interesting progress started in 1978 with the purchase of Dome Petroleum. All decisions beginning with Dome are picked up and shown in the second table.
Dome offers an extremely valuable lesson on why most stocks sooner or later have to be sold. While it was bought, as you can see, at $77 and sold near $98, it eventually fell below $2! History repeated itself in 2000 and 2001 when many Internet big winners like CMGI dropped from $165 to $1. Note also that the account was worn out of Pic ’N’ Save on July 6, 1982, at $15, but we bought it back at $18 and $19, even though this was a higher price, and made a large gain by doing so. This is something you will have to learn to do at some point. If you were wrong in selling, in a number of cases, you’ll need to buy the stock back at higher prices.
PMD Fund Transactions, 1961–1964
PMD Fund Transactions, 1978–1986
The U.S. Investing Championship
Another engaging example of the CAN SLIM principles being properly applied is the story of one of our associates, Lee Freestone. Lee participated in the U.S. Investing Championship in 1991, when he was just 24 years old. Using the CAN SLIM technique, he came in second for the year, with a result of 279%. In 1992, he gained a 120% return and again came in second. Lee was doing what David Ryan, another associate at the time, had done when he participated in the U.S. Investing Championship in prior years and won. The U.S. Investing Championship is not some paper transaction derby. Real money is used, and actual transactions are made in the market. Lee continued to invest successfully with even larger returns in the late 1990s.
So if it is followed with discipline, the CAN SLIM system has been battle-tested successfully through thick and thin from 1961 to 2009.
More Examples of Great Winners to Guide You
Graphs for an additional selected group of the greatest stock market winners follow. They are models of the most successful investments in the United States from 1952 through 2009. Study them carefully and refer to them often. They are further examples of what you must look for in the future. The thin wavy line with RS at the end shown below the prices is a relative price strength line. When the line moves up, the stock is outper forming the market. All the models show the stock’s chart pattern just before the point where you want to take buying action.
If you think you’re just looking at a bunch of charts, think again. What you are seeing are pictures of the price accumulation patterns of the greatest winning stocks—just before their enormous price moves began. The charts are presented in five configurations: cup-with-handle pattern, cup-without-handle pattern, double-bottom pattern, flat-base pattern, and base-on-topof-a-base pattern. You need to learn to recognize these patterns.
Cup-With- Handle Pattern

Telex 283% increase in 27 weeks

Houston Oil 1004% increase in 54 weeks

Waste Management 1180% increase in 242 weeks

Storage Technology 371% increase in 52 weeks

Ford 889% increase in 262 weeks
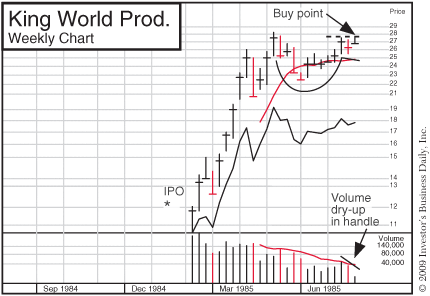
King World Prod. 588% increase in 116 weeks
Reebok 246% increase in 18 weeks

Compaq 352% increase in 46 weeks

Macromedia 486% increase in 49 weeks
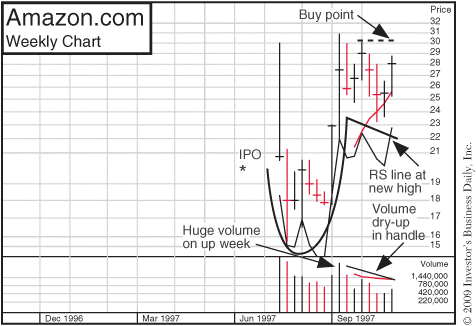
Amazon.com 3805% increase in 70 weeks

Comverse Technology 564% increase in 67 weeks

Verisign 2250% increase in 66 weeks

ARM Holdings 1385% increase in 57 weeks

Veritas Software 1097% increase in 62 weeks
Qlogic 803% increase in 44 weeks
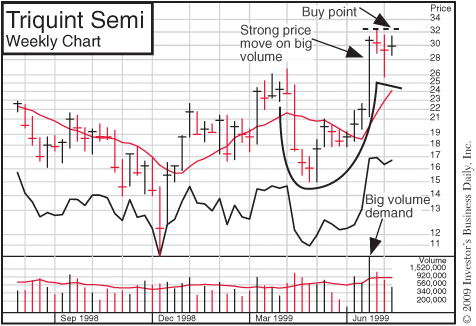
Triquint Semiconductor 1078% increase in 41 weeks

Checkpoint Software 1104% increase in 40 weeks

RF Micro Devices 444% increase in 36 weeks

Broadvision 823% increase in 30 weeks

E-Tek Dynamics 507% increase in 28 weeks

Siebel Systems 466% increase in 28 weeks

Business Objects 480% increase in 26 weeks
Microstrategy 1414% increase in 24 weeks

Vistacare 115% increase in 31 weeks
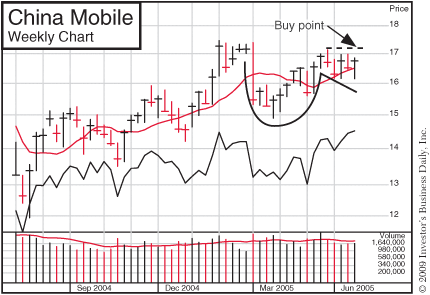
China Mobile 484% increase in 131 weeks

McDermott 703% increase in 128 weeks

Research in Motion 382% increase in 60 weeks

Baidu 225% increase in 25 weeks
Cup-Without-Handle Pattern

Wards 267% increase in 38 weeks

T C B Y 2189% increase in 77 weeks

C-Cube 509% increase in 41 weeks

P M C Sierra 1949% increase in 70 weeks

P E Celera 2281% increase in 32 weeks

Gen-Probe 122% increase in 20 weeks
Double Bottom Pattern

AMF 82% increase in 23 weeks
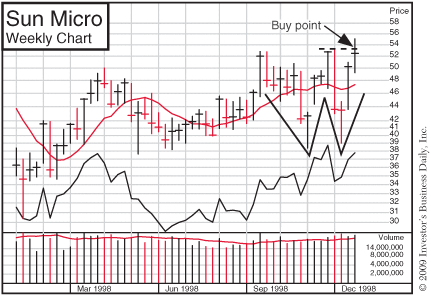
Sun Micro 701% increase in 74 weeks

Nokia 486% increase in 87 weeks

Omnivision Tech 256% increase in 39 weeks

Quality Systems 177% increase in 44 weeks

Chicago Merc. Exch. 208% increase in 132 weeks
Flat Base Pattern
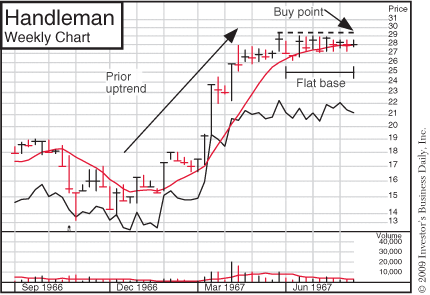
Handleman 328% increase in 139 weeks

Hilton 232% increase in 60 weeks
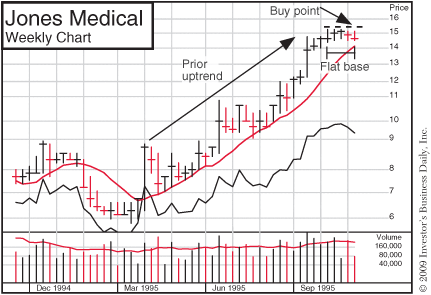
Jones Medical 447% increase in 36 weeks

S D L Inc 814% increase in 39 week

Starbucks 126% increase in 70 weeks

American Movil 730% increase in 205 weeks
Base-on-Base Pattern

Prime Computer 1564% increase in 169 weeks

Surgical Care Affiliates 1632% increase in 150 weeks

Optical Coating Labs 1957% increase in 58 weeks

Network Appliance 517% increase in 18 weeks
