Visualizing Strategic Insight
Value Proposition Canvas
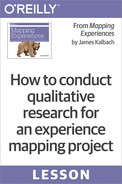
The basic grid structure of the business model canvas inspired the development of similar tools. One such example is the value proposition canvas (see Figure 1-1), also created by Alexander Osterwalder. It is directly related to the business model canvas and plugs into two business model elements: the customer segments you wish to create value for and the value proposition you believe will attract customers.
The value proposition canvas allows you to design and test the fit between what you offer and what customers want.
There are two parts. On the right is the customer profile with three components:
- Jobs to be done
These are the important issues people want solved and the needs they are trying to satisfy.
- Pains
These are the barriers, hurdles, and annoyances people have in trying to get a job done. This includes negative emotions and risks they may encounter.
- Gains
These are positive outcomes or benefits the individual desires.
The other half of the canvas on the left side details the three features of your value proposition.
- Products and services
These represent your offering, including the features and support you provide.
- Pain relievers
This is a description of how your offering will alleviate the customer’s pains. These show which problems you’re addressing.
- Gain creators
These make explicit how your products and services benefit customers.
By mapping the left side to the right side, you can make explicit how you are creating value for your customers. When the pain relievers and gain creators correlate to the pains and gains of customers, you have a potential strong fit. Validate your assumptions with your markets once you have formed a clear position.

Figure 1-1. The value proposition canvas, created by Alexander Osterwalder and his company, Strategizer, complements the business model canvas.
Summary
As organizations mature, they develop strategy myopia—a failure to see the broader landscape of their business and how they can continue to create meaningful value. Successful enterprises start with insights about customer needs and work backward to their strategy. This reverses many existing practices in business that seek to push products and service through traditional sales channels.
To change, organizations need to consider additional sources of insight often left out of strategy creation. This includes a deep understanding of how customers perceive value. Visualizations of various kinds broaden your field of vision and offer a new way of seeing.
First, consider how to reframe competition. In the eyes of your customer, anything that gets the job done is your rival.
Also consider how you contribute back to society and create shared value. Shared value is about creating societal benefits with every customer interaction, going far beyond corporate social responsibility.
The Internet of Things forces us to reimagine value delivery. Connected, smart products inevitably become part of a larger ecosystem. The value you create is delivered and experienced as part of that context.
Finally, organize to innovate. First, separate protecting existing value from creating new value by setting up different divisions in the organization. Then, organize teams to align with the customer experience.
Visualizations tend to open up strategy, making it not only more understandable but also more inclusive across the organization. Several techniques help illustrate strategy graphically. These include strategy maps, strategy canvases, the strategy blueprint, and the business model canvas and value proposition canvas. They complement and extend alignment diagrams.