|
|
The information that we have about the visual world, and our perceptions of objects and visual events in the world, depend only indirectly upon the state of that world. They depend directly upon the nature of the images formed on the backs of our eyeballs, and these images are different in many important ways from the world itself.
T. N. Cornsweet
1970
For an organism to operate effectively within any environment, natural or artificial, it must be able to get information about that environment using its senses. Likewise, the organism must be able to act on that information and to perceive the effect of its action on the environment. How people perceive environmental information is of great importance in human factors. Because the performance of a person in any human–machine system will be limited by the quality of the information he perceives, we are always concerned about how to display information in ways that are easily perceptible.
We must understand the basic principles of sensory processing and the characteristics of the different sensory systems when considering the design of displays, controls, signs, and other components of the human–machine interface (e.g., Proctor & Proctor, 2012). A good display will take advantage of those features of stimulation that the sensory systems can most readily transmit to higher-level brain processes. In this chapter we give an overview of the visual system and the phenomena of visual perception, with an emphasis on characteristics that are most important for human factors.
It is important to distinguish between the effect of a stimulus on a person’s sensory system and her perceptual experience of the stimulus. If someone looks at a light, the sensory effect of the intensity of the light (determined by the number of photons from the light falling on the retina) is quite different from the perceived brightness of the light. If the light is turned on in a dark room, he may perceive it as being very bright indeed. But if that same light is turned on outside on a sunny day, he may perceive it as being very dim. In the discussion to follow, we will distinguish between sensory and perceptual effects. By the end of this chapter, you should be able to determine whether a phenomenon is sensory or perceptual.
Before we discuss the visual system specifically, we will consider some general properties of sensory systems (Møler, 2014). In this section, we describe the basic “cabling” of the nervous system and how information is coded by this system for processing by the brain.
Sensation begins when a physical stimulus makes contact with the “receptors” of a sensory system. Receptors are specialized cells that are sensitive to certain kinds of physical energy in the environment. For example, the light emitted by a lamp takes the form of photons that strike the receptor cells lining the back of the eye. A sound takes the form of a change in air pressure that causes vibrations of the tiny bones in the middle ear. These vibrations result in movement of receptor cells located in the inner ear.
Receptor cells transform physical energy into neural signals. Highly structured neural pathways carry these signals to the brain. A pathway is a cable of sorts: a chain of specialized cells called neurons that produce tiny electrical currents. Neural pathways act as filters, sorting and refining incoming information according to specific characteristics, such as color, shape, or intensity. There is no simple, passive transmission of information from the receptors to the brain. Information processing begins at the moment a sensation begins.
The pathways’ first stop within the brain is the thalamus, a walnut-sized lump of tissue located in the center of the brain (Sherman & Guillery, 2013). One of the functions of the thalamus is to serve as a kind of switching station, sending neural signals to the appropriate areas in the cortex for further processing. The cortex is the outermost surface of the brain, a wrinkled layer of highly interconnected neurons only a few millimeters thick. Different areas on the cortex are highly structured and sensitive to specific kinds of stimulation. When a neural signal reaches the cortex it is very refined, and the operations that take place in the cortex refine it even more.
Any single neuron has a baseline level of activity (firing or spike rate) and receives excitatory and inhibitory input from many other neurons. An increase in activity for neurons with excitatory input will increase the firing rate of the neuron, whereas an increase in activity for those with inhibitory inputs will decrease the firing rate. These inputs determine the specific features of stimulation (e.g., color) to which the neuron is sensitive. The neurons in the cortex respond to very complicated aspects of a stimulus (e.g., specific shapes) as a result of inputs from lower-level neurons responsive to simpler aspects of the stimulus (e.g., lines and spots). The cortical neurons send very complicated signals to many different brain areas responsible for motor coordination, memory, emotion, and so forth. By the time a signal is completely processed, it has probably traveled through most of the major areas of the brain.
Consider the vast amount of visual information received by your brain when you open your eyes in the morning. Somehow, all the patterns of light and movement that fall on your retinas organize themselves into a representation of the world. What kinds of stimulation do you need to be able to get out of bed? What kinds of stimulation can you ignore? It turns out that a good deal of stimulation is simply ignored. Our perceptions of the world are made up of a very limited amount of the information that we actually receive.
Take as an example the visual information received by the brain while you drive (Castro, 2009). Certain features of the world are important for your task, such as the location of the roadway, the yellow line down the center of the road, the locations of other vehicles on the road, and so forth. Rarely do you perceive the shapes of clouds or the color of the sky, even though this information is impinging on your senses.
The visual system is unique among our senses in that it provides us with information about where objects are in our environment without requiring that we actually touch those objects. This gives us many abilities, including the ability to reach for an object and also to avoid objects we do not wish to touch. The ability to negotiate around objects in an environment without actually touching anything is the basis for our ability to guide moving vehicles, as well as our own movement.
Vision lets us read written information in books, magazines, and newspapers, not to mention signs or television images. The visual modality is the most common and most reliable format for transmitting information from a machine to an operator in a human–machine interface. For example, all of the dials and gauges on an automobile dashboard require that the driver can see them to obtain the information they convey. In this and in all cases of visual sensation, information is conveyed by photons projected or reflected into the eye (Schwartz, 2010).
All light is electromagnetic radiation, which travels from a source in waves of small particles at a speed of 3.0 × 10⁸ m/s (Hecht, 2016). A particular kind of electromagnetic radiation, such as a radio-station signal, an X-ray, or visible light, is defined by its range of wavelengths within the electromagnetic spectrum. Visible light, the range of wavelengths to which the human eye is sensitive, is a tiny range within the entire electromagnetic spectrum. The light that reaches the eye can be characterized as waves of photons that are either emitted by or reflected from objects in the environment. The intensity of a light is determined by the number of photons it produces. The color of a light is determined by its wavelength.
The range of wavelengths to which humans are sensitive runs from approximately 380 to 760 billionths of a meter, or nanometers (nm). Long wavelengths are perceived as red, whereas short wavelengths are perceived as violet (see Figure 5.1). Most colors that we experience are not composed of a single wavelength, but are mixtures of many different wavelengths. White light, for example, is composed of approximately equal amounts of all the different wavelengths.

FIGURE 5.1The visual spectrum, as located within the electromagnetic spectrum.
When photons enter the eye, they are absorbed by the layer of receptor cells that line the back of the eye (Remington, 2012). These cells are located in the retina (see the next section), which acts like a curved piece of photosensitive paper. Each individual receptor cell contains a photopigment that is chemically reactive to photons of different wavelengths. When struck by a photon, the receptor cell generates an electrochemical signal that is passed to the nerve cells in the retina. A visual image results from a complex pattern of light that falls on the retina. For that pattern to be interpretable as an image, the light waves must be focused in the same way that an image must be focused through the lens of a camera.
A schematic diagram of the eye is shown in Figure 5.2. Light is projected by a source or reflected from a surface into the eye. It enters the eye through the transparent front covering, called the cornea, and passes through the pupil, which varies in size. The light then is directed through the lens and focused on the retina. When the eyes are not moving and a person is attempting to look at something specific, we say that the eyes are fixated, or that an object has been fixated by the eyes. The location in space of a fixated object is the point of fixation. Once an object is fixated, its image must be brought into focus.

FIGURE 5.2The human eye and optic nerve.
Most of the focusing power of the eye comes from the cornea and the lens (Bowling, 2016). The shape of the cornea does most of the work by strongly bending the light before it even gets into the eye. After the light passes through the pupil, it must then pass through the lens. The lens is a transparent, gelatinous structure that makes fine adjustments, depending on the distance of the object that is being fixated and brought into focus.
More power (bending) is needed to focus an image when an object is close than when it is far away. The lens provides this additional power through the process of accommodation. During accommodation, the lens changes its shape (see Figure 5.3). When a fixated object is approximately 3 m or further away, the lens is relatively flat. The distance at which the lens no longer accommodates is called the far point. As the distance to the object decreases from the far point, tiny muscles attached to the lens relax, decreasing their tug on the lens and allowing the lens to become progressively more spherical. The more spherical the lens, the more the light is bent. Accommodation has a near point, which is approximately 20 cm in young adults. For objects closer than the near point, further increases in power are impossible and the image degrades.

FIGURE 5.3The process of accommodation.
It takes time and, sometimes, noticeable effort to accommodate to a change in an image’s distance. For example, while driving, taking your eyes from the roadway to look at your speedometer requires a change from the far point of accommodation to a nearer point to bring the speedometer into focus. Accommodative changes in young adults are usually accomplished within about 900 ms after an object appears in the field of vision (Campbell & Westheimer, 1960).
The accommodative process is influenced by the amount of light in the environment. Accommodation is different in full light than in darkness. In darkness, the muscles of the lens are in a resting state, or dark focus. This is a point of accommodation somewhere between the near and far points (Andre, 2003; Andre & Owens, 1999). The dark focus point differs among different people and is affected by a number of different factors, such as the distance of a prior sustained focus and the position of the eyes (Hofstetter, Griffin, Berman, & Everson, 2000). On average, the dark focus is less than 1 m. The distance between a person’s dark focus and the distance of an object to be accommodated is called the lag of accommodation. Eye strain can be caused by the placement of displays at distances that require continuous changes in accommodation, even for very small accommodative lags. This is especially true when conditions such as a low level of ambient lighting or the nature of the task encourage fixation at the dark focus (Patterson, Winterbottom, & Pierce, 2006). The constant tug of the eye muscles required to maintain focus when the lens muscles drift toward dark focus is the cause of the strain.
The pupil is the hole in the middle of the iris. The iris, the colored part of your eye, is a doughnut-shaped muscle that controls how much light enters the eye. When the pupil dilates, it increases in size up to a maximum of 8 mm in diameter, and more light is allowed in. When the pupil contracts, it decreases in size to a minimum of 2 mm, and less light is allowed in. The amount of light entering the eye when the pupil is completely dilated is about 16 times the amount of light entering the eye when the pupil is completely contracted.
Dilation and contraction have been thought to be mostly reflexive behaviors determined by the amount of light falling on the eye (Watson & Yellott, 2012). However, recent evidence suggests that “the pupillary light response is far more than the low-level reflex that it was historically thought to be” (Mathôt & Van der Stigchel, 2015). Rather, it is affected by cognitive factors, including whether or not you are consciously aware of the stimulus, whether you are attending to the stimulus, and its apparent brightness. The size of the pupil also varies with a person’s state of arousal, with an increase in arousal level resulting in dilation (Bradley, Miccoli, Escrig, & Lang, 2008).
The size of the pupil determines the depth of field of a fixated image (Marcos, Moreno, & Navarro, 1999). Suppose that you fixate an object some distance away, and so its image is clearly in focus. For some distance in front of the object and for some distance behind it, other objects in the image will also be clearly in focus. The total distance in depth for which objects in a scene are in clear focus is the depth of field. When the pupil is small, depth of field is greater than when the pupil is large. Consequently, for situations in which the pupil is large, such as when illumination is low, accommodation must be more precise (Randle, 1988) and there is an increased likelihood of eye strain.
Another factor in focusing that occurs as a function of the distance of a fixated object is the degree of vergence of the two eyes (Morahan, Meehan, Patterson, & Hughes, 1998). Take a moment right now and look at the end of your nose. You should find that, in trying to bring your nose into focus, you crossed your eyes. Your eyes rotated toward each other. If you look from the end of your nose to an object some feet away, your eyes rotate away from each other. Vergence refers to the degree of rotation of the eyes inward or outward required to cause the light from a fixated object to fall on the central regions (the foveas) of the left and right eyes (see Figure 5.4). The vergence process allows the images from the two eyes to be fused and seen as a single object.

FIGURE 5.4Vergence angle at near and far points.
We can talk about the line of sight for each eye: a line drawn from the center of the back of each eye outward to the point of fixation in the world. When the point of fixation changes from far to near, the eyes turn inward and the lines of sight intersect at the point of fixation. Conversely, when the point of fixation changes from near to far, the eyes diverge and the lines of sight become almost parallel. Beyond fixated distances of approximately 6 m, the lines of sight remain parallel and there is no further divergence. The near point of convergence is approximately 5 cm; at this distance, objects become blurred if they are moved any closer. Look again at the end of your nose. Although you can probably fixate it easily enough, unless you have a very long nose you will not be able to bring it into clear focus.
Vergence is controlled by muscles that are attached to the outer surface of the eye. There is a reflexive connection between these muscles and the muscles that attach to the lens. This means that accommodation will change when eye position changes (Schowengerdt & Seibel, 2004). Remember that the muscles attached to the lens that control accommodation have a resting state, the dark focus. Similarly, the muscles controlling the degree of vergence have a resting state, which is measured as the degree of vergence assumed in the absence of light. This state is called dark vergence (Jaschinski, Jainta, Hoormann, & Walper, 2007). The angle formed by the lines of sight in dark vergence is somewhere between the angles formed by vergence on near and far objects (Owens & Leibowitz, 1983).
Different people have very different dark vergence angles (Jaschinski et al., 2007), and these individual differences can affect the performance of visual inspection tasks. In one study, students performed a task for more than half an hour in which they inspected enlarged images of contact lenses for defects, at viewing distances of 20 and 60 m (Jebaraj, Tyrrell, & Gramopadhye, 1999). The students took more than twice as long to inspect the lenses at the near viewing distance as at the far distance, and reported greater visual fatigue, even though the sizes of the images on the retina were equal (see our discussion of visual angle later in this chapter). This effect was correlated with dark vergence distance but not with dark focus. In another study, people sat 20 cm from a video display terminal and searched the screen for a target letter among distractors (Best, Littleton, Gramopadhye, & Tyrrell, 1996). People with near dark vergence angles performed the search task faster than those with far dark vergence angles. Because everyone was positioned close to the display, this outcome suggests that the performance of visual inspection tasks is best when the difference between the viewing distance and the dark vergence posture is minimized.
Accurate perception depends on the proper functioning of the focusing system, which includes the cornea, pupil, and lens. The most common flaw in this system is in the shape of the eye (Naess, 2001). An eye that is too long or too short can result in an inability to focus an image on the receptors, regardless of the amount of accommodation attempted. In other words, the receptors are not at a position where an image can be focused (see Figure 5.5). The main purpose of glasses and contact lenses is to provide the extra focusing power necessary to correct this problem.

FIGURE 5.5Focusing for normal, nearsighted, and farsighted eyes.
For nearsightedness, or myopia, the eye is too long, resulting in a focal point that is in front of the receptors when the lens is relaxed. For farsightedness, or hyperopia, the eye is too short, resulting in a focal point that is behind the receptors when the lens is fully flexed. As people become older, the speed and extent of their accommodation decrease continually. With age, the lens becomes harder and less responsive to the pulls of the muscles in the eye, so accommodative ability decreases and essentially all people become hyperopic. This condition is called presbyopia, or old-sightedness. The near point can increase from as close as 10 cm for 20-year-olds to as far as 100 cm by age 60. Presbyopia can be corrected with reading glasses or bifocals, which typically are not prescribed until age 45 years or older. A person can have perfect vision in all other respects but still need reading glasses to compensate for the decreased accommodative ability of the lens.
A problem similar to presbyopia is accommodative excess, which results in either accommodative insufficiency or accommodative infacility. These disorders are tied to the muscles that control accommodation. These muscles can spasm, reducing accommodative ability and greatly increasing the time required for accommodative adjustments. Accommodative insufficiency is sometimes called early presbyopia, and results in an inability to properly adjust accommodation for close objects. Accommodative infacility refers to difficulty changing from near to far focus (and vice versa), resulting in poor accommodation and significantly slowed accommodation times. Sometimes accommodative excess can be improved by making changes to a person’s corrective lenses, but it can also be treated with vision therapy, a program of exercises designed to reduce the tendency of the lens muscles to spasm.
Eye discomfort or eye strain is usually caused by fatigue of accommodative and vergence muscles. This sort of discomfort is particularly problematic for people who engage in a lot of close work or spend a lot of time at a computer monitor. Displays that are close to the viewer require both more vergence and more accommodation, and if fixation on such displays is required for an entire workday, the eye muscles can (not surprisingly) get very tired.
We mentioned that the amount of eye strain experienced from close visual work varies as a function of individuals’ dark vergence and dark focus postures. People with far dark vergence angles report experiencing more visual fatigue after prolonged near work than do people with close vergence angles (Owens & Wolf-Kelly, 1987; Tyrrell & Leibowitz, 1990). Similarly, people whose dark focus point is further show more visual fatigue during close work than those with a nearer focus point. For people using a visual display screen, those people with more distant dark foci have the greatest visual fatigue when viewing the screen from 50 cm. However, at a viewing distance of 100 cm, people with longer dark foci experience no more or less fatigue than anyone else (Jaschinski-Kruza, 1991). Also, people with far dark foci tend to position themselves further from a visual display screen than do people with near dark foci, perhaps in an attempt to reduce vergence effort (Heuer, Hollendiek, Kroger, & Romer, 1989).
Working at a computer monitor induces another kind of eye strain that seems to be due to the accommodation muscles. Text on a computer monitor is different from printed text. Whereas printed text has sharp edges, the text on a computer monitor is sharp in the middle but has blurry edges because of the way the light fades out around the edge of an image on the screen. The combination of in- and out-of-focus signals that the eyes receive causes the state of accommodation to drift to the dark focus. This means that a person who spends a long time reading text on a computer monitor must continuously work to keep the text on the screen in focus. The tug-of-war between near and dark focus can cause significant discomfort.
Finally, a person can have problems focusing because he has an astigmatism. This problem is similar to myopia and hyperopia, which are caused by problems in the shape of the eye. For astigmatism, the problem is due to irregularities in the shape of the cornea. These irregularities cause light to be bent asymmetrically as it passes through the cornea. This means that contours in certain orientations will be in clear focus on the retina whereas those in other orientations will not. No matter how much the eye accommodates, some parts of the image will always be blurred. As with myopia and hyperopia, astigmatism can be corrected by glasses.
The cornea and lens must be transparent to allow light to pass into the eye. Injury to the eye and disease can cloud these organs and interfere with vision. The cornea can be scarred, which results in decreased acuity and an increase in the scattering of light. This can cause the perception of halos around light sources, especially at night. Another common problem is cataracts, which are hard, cloudy areas in the lens that usually occur with age. Seventy-five percent of people over 65 have cataracts, although in most cases the cataracts are not serious enough to interfere with the person’s activities. Sometimes surgical intervention is necessary to correct major corneal and lens problems.
Research on accommodation, vergence, and other aspects of the focusing system plays an important role in human factors. The focusing system determines the quality of the image that is received by the eyes and limits the extent of visual detail that can be resolved. The system is also susceptible to fatigue, which can be debilitating for an operator. One of the most interesting things about the focusing system is that the degree of accommodation and vergence varies systematically with the distance of fixated objects. Therefore, the state of the focusing system can provide information about how far away an object is and how big it is. This means that an operator’s judgments about distant objects will be influenced by the position and focus of his eyes. When accurate judgments about distant objects are critically important, such as while driving a car or piloting a plane, designers must take into account how vergence and accommodation will be influenced by the displays in the vehicle, the operator’s position relative to those displays, the light environment in which the displays will most likely be viewed, and how judgments about objects outside of the vehicle will be influenced by all of these other factors.
In a healthy eye, visual images are focused on the retina, which is the organ that lines the back of the eye (Ryan et al., 2013). The retina contains a layer of receptor cells, as well as two other layers of nerve cells that perform the first simple transformations of the retinal image into a neural signal. Most people are surprised to learn that the receptor cells are located behind the nerve cell layers, so a lot of the light that enters the eye never reaches the receptors at all. The light must penetrate these other layers first, as well as the blood supply that supports the retina. Consequently, only about half of the light energy that reaches the eye has an effect on the photoreceptors, which initiate the visual sensory signal.
The retina contains two types of receptors, rods and cones (Packer & Williams, 2003). The receptors of both types are like little pieces of pH-paper. At the end of each photoreceptor there is a little bit of photosensitive pigment. These photopigments absorb photons of light, which results in the photoreceptor being “bleached” and changing color. This change initiates a neural signal.
Rods and cones respond to different things. While cones are responsive to different colors, rods are not. All rods have the same kind of photopigment, whereas there are three types of cones, each with different photopigments. The four photopigments are most sensitive to light of different wavelengths (rods, 500 nm; short-wavelength cones, 440 nm or bluish; middle-wavelength cones, 540 nm or greenish; and long-wavelength cones, 565 nm or reddish), but each responds at least a little bit to light falling within fairly broad ranges of wavelength. There are many more rods (approximately 90 million) than cones (approximately 4–5 million; Packer & Williams, 2003).
The most important part of the retina is the fovea, which is a region about the size of a pinhead that falls directly in the line of sight. Its total area, relative to the area of the entire retina, is very tiny (approximately 1.25° diameter). There are only cones in the center of the fovea. Both rods and cones are found outside of the fovea, but there the rods greatly outnumber the cones. As we will discuss in more detail later, the rod system is responsible for vision in dim light (scotopic vision), whereas the cone system is responsible for vision in bright light (photopic vision). The cone system is responsible for color vision and perception of detail. The rod system is unable to provide any information about color and fine detail, but it is much more sensitive than the cone system in that rods can detect tiny amounts of light that cones cannot.
Another landmark of the retina is the blind spot. The blind spot is a region located on the nasal side of the retina that is approximately 2–3 times as large as the fovea. It is the point at which the fibers that make up the optic nerve leave the eye, and so there are no receptor cells here. Consequently, any visual stimulus that falls entirely on the blind spot will not be seen. You can “see” the blind spot for yourself. Close one eye, hold a pencil upright at arm’s length and look at the eraser. Now, keeping the pencil at arm’s length, move the pencil slowly away from your nose without moving your eyes. After you have moved the pencil about a foot, you should notice that the top part of the pencil has disappeared. At this point, you can move the pencil around a little bit, and watch (without moving your eyes!) the eraser pop in and out of view. As you move the pencil around in this way, you will realize that the blind spot is actually relatively large: there is a great empty hole in your visual field.
Although the blind spot is rather large, we rarely even notice it. One reason for this is that the region of the image that falls on one eye’s blind spot falls on a part of the retina for the other eye that contains receptors. However, even when we look at the world with only one eye, the blind spot is rarely evident. If a pattern falls across the blind spot, it is perceived as continuous and complete under most circumstances (Baek, Cha, & Chong, 2012; Kawabata, 1984). Pick up your pencil again and find your blind spot. If the pencil is long enough, you should be able to move it so that the top of the pencil sticks above the blind spot and your hand holding the other end is below. You will probably notice that it becomes much harder to see the blind spot in the middle of the pencil: the pencil tends to look whole. This is the first example of an important principle that will recur in our discussion of perception: the perceptual system fills in missing information (Ramachandran, 1992).
After the receptor cells respond to the presence of a photon, they send a signal to the nerve cells in the retina (Lennie, 2003). An important characteristic of these nerve cells is that they are extensively connected to each other, so that light falling on one area in the retina may have at least some small effect on the way that the nerve cells respond in another area of the retina. These “lateral” connections (“lateral” here meaning connections within the same layer of tissue) are responsible for some of the different characteristics of rods and cones, as well as several interesting visual illusions.
A phenomenon called Mach bands, which can be seen in Figure 5.6, is thought to be due to interactions between nerve cells in the retina (e.g., Keil, 2006). The figure shows a graduated sequence of gray bars ranging in lightness from light to dark. Although the bars themselves are of uniform intensity, darker and lighter bands are perceived at the boundaries of transition from one region to another. These bands arise from cells responding to brighter areas decreasing the activity of cells in a nearby darker area, and cells in darker areas tending to increase the activity of cells in a nearby lighter area. In short, the light and dark bands that are perceived are not actually present in the physical stimulus. They are induced by the competing activities of retinal neurons.

FIGURE 5.6Mach bands.
The difference in sensory characteristics between rods and cones also comes from the neural structure of the retina. While there are approximately 95 million rods and cones on the retina, these receptors are connected to only approximately 6 million nerve cells. Consequently, the signals from many receptors are pooled onto a single nerve cell. Approximately 120 rods converge on a single nerve cell, whereas only approximately 6 cones on average converge on a single nerve cell.
The relatively small amount of convergence in the cone system allows the accurate perception of details. Because light falling on different cones tends to be sent to different nerve cells, the spatial details of the retinal image are faithfully reproduced in the neurons that convey this information. However, each of the cones in the system must absorb its own photons for the image to be complete. In contrast, the relatively large amount of convergence in the rod system results in a loss of fine detail. Because information from many spatial locations is sent to a single cell, that cell cannot “know” anything about where on the retina the signal it receives originated. However, because so many rods converge on that cell, photons falling on only a few of them are sufficient to produce a signal. So, while the cone system needs a lot of light to function well, the rod system needs very little.
The sensory pathways subsequent to the receptors are specialized to process distinct characteristics of the stimulation along at least three parallel streams: the parvocellular, magnocellular, and koniocellular streams (Percival, Martin, & Grünert, 2013). Because we don’t yet understand the function of the cells in the koniocellular stream in sensation and perception, we will restrict our consideration to the first two streams. The cells in the parvocellular stream (p cells) have small cell bodies, exhibit a sustained response in the presence of light stimuli (i.e., they continue to fire as long as light is falling on the retina), are concentrated around the fovea, show sensitivity to color, have a slow transmission speed, and have high spatial resolution but low temporal resolution. In contrast, those in the magnocellular stream (m cells) have large cell bodies, show a transient response to light stimuli (i.e., these neurons produce an initial burst of firing when light falls on the retina but the response rate decreases gradually as long as the light remains on), are distributed evenly across the retina, are broadband (i.e., not sensitive to color), show a fast speed of transmission, and have low spatial resolution and high temporal resolution (i.e., sensitivity to movement).
These properties have led researchers to speculate that the parvocellular stream is important for the perception of pattern and form, whereas the magnocellular stream is important for the perception of motion and change (McAnany & Alexander, 2008). As we will see, the distinction between the parvocellular and magnocellular streams extends through the primary visual cortex and forms the basis for two systems involving many areas of the brain that perform parallel analyses of pattern and location information.
As we have now noted, the structure of the retina determines many characteristics of perception. One of the most important of these is the ability to perceive detail as a function of retinal location. This ability to resolve detail is called acuity. An example of a task that requires good visual acuity is detecting a small gap between two lines. If the gap is very small, the two lines may look like a single line, but when it is larger it is easier to see two lines. Figure 5.7 shows how acuity is highest at the fovea and decreases sharply as the image is moved further into the periphery. The acuity function is similar to the distributions of cone receptors and p cells across the retina, suggesting that it may be determined by the parvocellular system. The smaller degree of convergence for these cells results in better acuity.
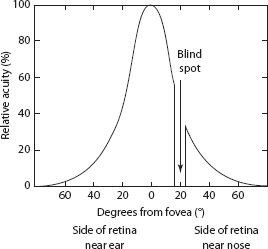
FIGURE 5.7Acuity as a function of retinal location.
It is not surprising that acuity varies with ambient light levels. Under photopic viewing conditions, the cone system is doing a lot of the work, and so acuity is great. Under scotopic viewing conditions, only the rods are operating. Because the rod system has a much higher degree of convergence than the cone system, acuity is much worse. Fine detail cannot be discriminated in the dark, only in full light.
The acuity function is relevant to many human factors problems. For example, in determining the design of instrument faces and where instruments should be located on an instrument panel, the human factors specialist must take into account where images will fall on the retina and the level of detail that must be resolved by the operator. Gauges and dials and so forth in the peripheral field of view will need to be larger, with less fine detail, than those located in the center of the visual field. Some electronic displays use gaze-contingent multiresolution (Reingold, Loschky, McConkie, & Stampe, 2003). These displays adjust so that the part of the display at which the operator is looking has higher resolution than the rest of the display (see Box 5.1). We will discuss other factors that affect acuity later in the chapter.
Once the optic nerve leaves the eye, visual signals become progressively more refined. The optic nerve splits, sending half of the information from each eye to one half of the brain and the other half to the other. Information about objects located in the right visual field first goes to the left half of the brain, while information about objects in the left visual field goes to the right half of the brain. These separate signals are put back together later in processing. After passing through a region of the thalamus called the lateral geniculate nucleus (LGN), where the parvocellular and magnocellular pathways are kept distinct and all neurons are monocular (i.e., they respond to light at only one eye), the next stop for visual information is the primary visual cortex. Put your hand on the back of your neck: the bump from your skull that hits the top edge of your hand is approximately where the visual cortex is located.
The visual cortex is highly structured (Hubel and Wiesel, 1979). It consists of several layers that contain approximately 108 neurons. The cortical neurons are spatiotopic, which means that if one cell responds to stimulation at one area on the retina, cells very close to it will be responsive to stimulation at nearby locations on the retina. The magnocellular and parvocellular inputs from the LGN have their effects on neurons in distinct layers of the visual cortex.
BOX 5.1GAZE-CONTINGENT MULTIRESOLUTIONAL DISPLAYS
Many human–computer interaction tasks require users to search for information on large screens and monitors. Overall, high-resolution displays are more desirable than low-resolution displays, because it is easier to identify objects using high-resolution displays. However, high-resolution displays are expensive, and their processing requirements may exceed the processing capacity and/or transmission bandwidth for some computer systems or networks. Consequently, a high-resolution display is not always practical or feasible.
Gaze-contingent multiresolutional displays (GCMRDs) take into account the fact that high resolution is only useful for foveal vision and is wasted to a large extent in peripheral vision because of low acuity in the periphery (see Reingold, Loschky, McConkie, & Stampe, 2003). For a GCMRD, only a limited region of the display is presented in high resolution, and this region corresponds to the area falling in or about the fovea. The user viewing the display wears an eye-tracker, which monitors where he is looking, and the display updates in real time, presenting in high resolution only the area that is currently fixated.
How tasks and displays are designed has consequences for perception and performance when GCMRDs are used. A considerable amount of human factors research can be conducted to investigate these consequences. Consider, for example, the basic idea behind GCRMDs: the user only needs high resolution in central vision and can use peripheral cues just as effectively whether they are of low or high resolution. Loschky and McConkie (2002) investigated this hypothesis by manipulating the size of the high-resolution area to see how performance of searching for a target object in a scene was affected. If low resolution is just as good as high resolution in the periphery, then the size of the high-resolution area should not have any effect on response times. Contrary to this hypothesis, a smaller high-resolution area actually led to longer search times than a larger area. The reason for this seems to be due to eye movements. Because the distance between successive eye movements was shorter for smaller high-resolution areas, observers made more fixations until the target was found. Apparently, people had to make more eye movements with the smaller high-resolution area because the target object did not stand out well when it was in the low-resolution region.
Although GCMRDs may be useful, Loschky and McConkie’s (2002) results suggest that performance of tasks that require visual search may not be as good with such displays as with high-resolution displays. However, their study used images with only two levels of resolution: high and low. There was a sharp boundary between the low- and high-resolution areas of each image. Because the decrease in a person’s visual acuity from the fovea to the periphery is continuous, it may be that little decrement in performance would occur with only a small high-resolution area if the image instead used a gradient of resolutions from high to low, so that there was a more gradual drop-off in resolution better matching these changes in visual acuity.
Loschky, McConkie, Yang, and Miller (2005) obtained evidence consistent with this hypothesis. The people in their experiments viewed high-resolution displays of scenes. Occasionally, for a single fixation, GCMRD versions with decreasing resolution from fixation to periphery appeared. The person was to push a button as fast as possible when he or she detected blur. When the decrease in resolution from fixation to periphery was slight, and less than the limits imposed by the retina, people did not detect any blur. The image looked normal to them. Moreover, across different amounts of decrease in resolution, the blur detection results and eye fixation durations were predicted accurately by a model in which contrast sensitivity decreases gradually from fovea to periphery.
GCMRDs can be used as a research tool to investigate other human factors issues. One example is to measure the useful field of view (UFOV), which is the region from which a person can obtain visual information during a single fixation. The UFOV is influenced by many factors, including the moment-to-moment cognitive load imposed on the person. Because a restricted UFOV may lead to increased crash risk when driving, Gaspar et al. (2016) devised a task to measure the UFOV dynamically for people in a driving simulator. For this purpose, they used a gaze-contingent task in which a participant had to periodically discriminate the orientation of a briefly presented grating. The performance of this task yielded a good measure of transient changes in the UFOV as a function of cognitive load, leading Gaspar et al. to conclude: “The GC-UFOV paradigm developed and tested in this study is a novel and effective tool for studying transient changes in the UFOV due to cognitive load in the context of complex real-world tasks such as simulated driving” (p. 630).
The cells in the cortex are distinctive in terms of the kinds of information to which they respond. The earliest, most fundamental cortical cells have circular center-surround receptive fields. This means that they respond most strongly to single spots of light on preferred locations on the retina, and they tend to fire less when light is presented around that location. However, other cells are more complex. Simple cells respond best to bars or lines of specific orientations. Complex cells also respond optimally to bars of a given orientation, but primarily when the bar moves across the visual field in a particular direction. A subclass of simple and complex cells will not fire if the stimulus is longer than the receptive field length. Therefore, the cortical cells may be responsible for signaling the presence or absence of specific features in visual scenes.
There are many interesting effects in visual perception that have their origins in the orientation-sensitive cells in the visual cortex. If you look at a vertical line over a field of tilted lines, it will appear to be tilted in the opposite direction from the field (see Figure 5.8a), a phenomenon called tilt contrast (Tolhurst & Thompson, 1975). A related effect occurs after you fixate for a while on a field of slightly tilted lines (see Figure 5.8b). If you look at a field of vertical lines after staring at the tilted field, the vertical lines will appear to be tilted in the opposite direction from the field (Magnussen & Kurtenbach, 1980). Tilt aftereffect and tilt contrast are due to the interactions between the neurons in the visual cortex (see, e.g., Bednar & Miikkulainen, 2000; Schwartz, Sejnowski, & Dayan, 2009), just as Mach bands are due to interactions between the cells in the retina.

FIGURE 5.8(a) Tilt contrast and (b) the tilt aftereffect.
Another perceptual phenomenon attributable to the orientation-sensitive cells of the visual cortex is called the oblique effect. People are much better at detecting and identifying horizontally or vertically oriented lines than lines of any oblique orientation. This effect seems to be due to a larger proportion of neurons in the visual cortex that are sensitive to vertical and horizontal orientations. Not as many cortical neurons are sensitive to oblique orientations (Gentaz & Tschopp, 2002). Because more neurons are devoted to horizontal and vertical orientations, these orientations can be detected and identified more easily.
The primary visual cortex is just the first of more than 30 cortical areas involved in the processing of visual information (Frishman, 2001). This information is processed in two streams, called the dorsal (top) and ventral (bottom) streams, which are sometimes called the “where” and “what” streams, respectively. The dorsal stream receives much of its input from the magnocellular pathway and seems to be involved primarily in perception of spatial location and motion and in the control of actions. In contrast, the ventral stream receives both parvocellular and magnocellular input and is important for perception of forms, objects, and colors. Because “what” and “where” are analyzed by distinct systems, we should expect to find situations in which people make “what” and “where” decisions better, depending on which pathway is used.
For example, Barber (1990) examined performance measures of short-range air defense weapon operators in simulated combat together with measurements of the operators’ basic visual perception abilities. The combat task involved detection of aircraft, identification of the aircraft as friendly or hostile, aiming the guns at the hostile aircraft, and tracking the hostile aircraft with the gun system once an initial fix was obtained. He correlated how well each operator performed each component of the task with the operators’ scores on simple visual perception tasks. This analysis suggested that the dorsal system helps to control detection and acquisition, and the ventral system helps to control detection and identification. Barber proposed that a third subsystem, which receives both magnocellular and parvocellular input, helps to control identification and tracking.
In other studies, Leibowitz and his associates (Leibowitz, 1996; Leibowitz & Owens, 1986; Leibowitz & Post, 1982; Leibowitz, Post, Brandt, & Dichgans, 1982) examined how the different visual pathways influence night driving performance. To do this, they have classified perceptual tasks according to whether they require “focal” processing (primarily in the central visual field, requiring the ventral system) or “ambient” processing (across the entire visual field, requiring the dorsal system). They hypothesize that focal processing is required for object recognition and that ambient processing is required for locomotion and orientation in space. For driving, the focal mode is involved in the identification of road signs and objects in the environment, whereas the ambient mode directs guidance of the vehicle.
Night driving fatality rates are three to four times higher than daytime rates (after adjusting for the fewer dark hours in a day). Why should an accident at night be more likely to lead to a fatality than an accident during the day? Leibowitz and his associates suggest that this occurs because the focal system is adversely affected under low illumination levels but the ambient system is not. Because the focal system does not function well in the dark, drivers can’t recognize objects as easily or accurately. However, because the ambient system is relatively unaffected, drivers can steer vehicles as easily at night as during the day. Moreover, most objects that require recognition, for example road signs and dashboard instruments, are illuminated or highly reflective. Consequently, drivers underestimate the extent to which focal perception is impaired and do not reduce speed accordingly.
An impairment of the focal system becomes obvious only when a non-illuminated obstacle, such as a parked car, fallen tree, or pedestrian, appears in the road. Drivers may take much more time to identify these objects than they have to be able to stop safely. In many cases, drivers report not even seeing an obstacle before their accidents. Leibowitz and Owens (1986) suggest that night accidents might be reduced if drivers were educated about the selective impairment of recognition vision at night.
As we mentioned earlier, while you drive your car from home to work, a lot of different visual stimuli impinge on your eyes, but you actually perceive very few of those stimuli and use information about these few to make driving decisions. Furthermore, it is not the physical properties of the important stimuli, such as intensity or wavelength, on which our decisions are based, but rather, their corresponding perceptual properties, like brightness or color. While some perceptual properties of visual stimuli correspond directly to physical properties of the stimulus, some do not, and others might arise under more than one set of conditions. However, all (visual) perceptual phenomena can be traced to the structure of the visual sensory system, whether directly or indirectly.
In the rest of this chapter we discuss the basic properties of visual perception, beginning with brightness and acuity, and how our perceptions of brightness and acuities depend on the environment in which perception is taking place.
Automobile drivers must share the road with other wheeled vehicles, including bicycles and motorcycles. For various reasons, drivers often “don’t see” these other vehicles, and because of the smaller and less protective nature of a motorcycle or a bicycle, the riders of these alternative vehicles can be seriously injured or killed in accidents with cars. For this reason, several U.S. states mandate that motorcycle headlamps shall be turned on even in the daylight hours, in an attempt to increase motorcycle visibility.
Assuming that the problem with car–motorcycle accidents really is one of visibility, is such a law effective? For the headlamp to increase the visibility of the motorcycle, we might consider whether the headlamp increases the perceived brightness of the motorcycle. The primary physical determinant of brightness is the intensity of the energy produced by a light source (luminance). The physical measurement of light energy is called radiometry, with radiant intensity being the measure of total energy. The measurement process that specifies light energy in terms of its effectiveness for vision is called photometry. Photometry involves a conversion of radiant intensity to units of luminance by weighting a light’s radiance according to the visual system’s sensitivity to it. Different conversion functions, corresponding to the distinct spectral sensitivity curves (see below), are used to specify luminance in candelas per square meter (see also Chapter 17).
On a warm, sunny day (the best sort of day for riding a motorcycle), a shiny new motorcycle reflects a lot of sunlight from its chrome and highly polished surfaces. It looks bright already, even without turning on the headlamp. We can determine perceived brightness by measuring the intensity of the light reflecting from its surface. The relation between brightness and light intensity is generally described well by a power function
where: |
|
B |
is brightness, |
I |
is the physical intensity of the light, and |
a |
is a constant, which might be different for different automobile drivers (see Chapter 4). |
Although the power function relationship is useful in a theoretical sense, pragmatically, different people will judge the same physical intensity to be of different levels of brightness. The bril scale is a way to quantify brightness that measures everyone’s perceived brightness on the same scale (Stevens, 1975). To understand the bril scale, it is important to understand the concept of a decibel. You have probably heard the term “decibel” used before in relation to noise levels, but it can be used for any perceptual effect related to stimulus intensity. A decibel (dB) is a unit of physical intensity that is defined as
where S is the intensity of some standard stimulus. Notice, then, that a measurement in decibels is entirely dependent on the intensity S. For the bril scale, one bril is the brightness of a white light that is 40 dB above a person’s absolute threshold for detecting light. So, for one bril, S is the intensity of a white light at absolute threshold.
One question we might ask about motorcycle headlamps is whether turning them on increases the brightness noticeably. We already know from earlier chapters that as luminance increases, greater changes are needed to produce equivalent changes in brightness. This means that we might not perceive much, if any, change in brightness between a motorcycle with its headlamp turned off and one with its headlamp turned on if the sun is already making the motorcycle appear very bright. However, on a cloudy day, when the sunlight reflecting off the motorcycle is greatly reduced, turning on the headlamp may greatly increase perceived brightness, even though the headlamp has exactly the same physical intensity on sunny and cloudy days.
It is clear, then, that although brightness is primarily a function of stimulus intensity, it is influenced by many other factors (Fiorentini, 2003). Although in some situations keeping the motorcycle headlamp on might not increase perceived brightness, in others it might, so perhaps the headlamp law is not such a bad idea. There are other factors that can contribute to perceived brightness, and we turn to a discussion of them now. Of particular importance are the state of adaptation of the observer and the wavelength of the perceived light, the duration of the light, and its contrast with the background illumination.
We discussed earlier in this chapter the major differences between rods and cones. One important factor is convergence: because many rods converge on a single nerve cell, rods are much better at detecting small amounts of light than cones are. Light presented on the periphery of the visual field appears brighter for this reason. You can verify this prediction by looking at the night sky. Find a dim star and look at it both directly and out of the corner of your eye. Sometimes you can even see a star peripherally that you cannot see while looking straight at it.
The differences between rods and cones are responsible for the phenomenon of dark adaptation (Reuter, 2011). When you first enter a dark room, it is very difficult to see anything at all. However, during the first few minutes in the dark, your ability to see improves substantially and then levels off (see Figure 5.9). After about 8 minutes, you will experience another improvement, and your ability to see will again get better and continue to do so until approximately 45 minutes have passed since you entered the room. At this time, your sensitivity to light is close to 100,000 times greater than it was when you entered the room!

FIGURE 5.9Dark adaptation function, which shows sensitivity to light as a function of time in the dark.
Why does this happen? When you enter the dark, many of your photoreceptors, both rods and cones, are bleached. They have absorbed photons from the lighted environment from which you came and have yet to regenerate new photopigment. The cones regenerate their pigment the fastest, resulting in the first improvements in your ability to see. At the end of 3 minutes, the cones have finished regenerating their pigment, but remember that cones are not very good for seeing in the dark. For your vision to improve, you have to wait a little longer for the rods to start helping out. After about 8 minutes in the dark, the rods catch up with the cones, and your ability to see again starts to improve. The remainder of the increase in sensitivity as time progresses is due to the rods continuing to regenerate photopigment.
We can do experiments that can verify that rods and cones are responsible for the different stages of dark adaptation. For instance, we could take you into a completely dark room and then only allow little bits of light energy to fall on your fovea (where there are no rods) and measure your sensitivity to this light over time. We would find that your ability to see never improves much after the first 3 minutes in the dark. Also, there are some people who have no cones (called rod monochromats). If we brought one of these people into the dark room, she would remain relatively blind until 8 minutes had passed, when her rods had regenerated enough photopigment for her vision to begin to improve.
The opposite of dark adaptation is light adaptation. Light adaptation happens after you come out of the dark room. If you have dark adapted, it is usually uncomfortable to return to a fully lighted environment. This discomfort arises because your eyes are far more sensitive to light. In fact, if we were to measure your ability to detect small amounts of light, your threshold would be very low if you were dark adapted. After you return to a lighted environment, your threshold begins to increase. After about 10 minutes, your threshold will have stabilized to a relatively high level, meaning that you can no longer detect the small lights that you could see while dark adapted (Hood & Finkelstein, 1986). The reason for your increased threshold has to do with the number of bleached photoreceptors in your retina. The more light that enters your eye, the more photoreceptors get bleached. Bleached photoreceptors do not respond to light, so sensitivity decreases.
For any environment, light or dark, your eyes will adapt. Light adaptation is a concern in night driving, where a driver needs to dark adapt to maintain maximal sensitivity to light. If the light intensity created by a driver’s own headlights close to his vehicle is too high, the driver’s eyes will light adapt, and he will not be as able to see objects farther in front of the car (Rice, 2005). However, the brighter and wider the headlight beam pattern can be farther from the vehicle, the better the driver will be able to see (Tiesler-Wittig, Postma, & Springer, 2005). However, this increased distance and intensity must be accomplished without creating too much glare for other drivers.
In some situations, changes in the environment will force rapid changes in adaptation level. Again, we find an example of this in driving. Highway tunnels, however well lit, force drivers to change from one level of adaptation, that required by the environment outside of the tunnel, to another, that required by the tunnel lighting. Problems in light sensitivity are particularly severe just upon entering a tunnel and just after leaving a tunnel. During daytime driving, the roadway will appear very dark at the tunnel entrance and very bright at its exit. Brighter lights placed at the beginning and end of a tunnel provide more gradual changes of illumination and less visual impairment (Oyama, 1987).
The different photoreceptors have different spectral sensitivities. Figure 5.10 shows how the photopigments for both rods and cones are broadly tuned, stretching between 100 and 200 nm, depending on the photopigment. The peak for the combined absorption spectra of the three cone photopigments is around 560 nm, whereas the peak rod absorbance is approximately 500 nm.

FIGURE 5.10Pigment absorption spectra for rod (dotted line) and cone (solid lines) photopigments.
Recall that rods are important for scotopic viewing conditions and cones are important for photopic viewing conditions. The wavelength difference in peak sensitivities for rods and cones can be seen in spectral sensitivity curves (see Figure 5.11). These curves are the absolute thresholds for the detection of a light as a function of its wavelength. The sensitivity curve for photopic vision is similar to that of the combined cone photopigment absorption curve, and the sensitivity curve for scotopic vision is similar to that of the rod photopigment absorption curve. These curves indicate that at either photopic or scotopic levels of illumination, sensitivity to light energy varies across the spectrum.

FIGURE 5.11Scotopic and photopic spectral sensitivity functions illustrating the Purkinje shift.
One interesting thing to notice is that rods are not sensitive to low-intensity, long-wavelength (red) light. In the presence of red light, only long-wavelength cones will be bleached. A dark-adapted person can enter a room lit with red light and remain dark adapted. There are many situations where someone might want to see and still preserve his or her state of dark adaptation. Astronomers might need to read charts without losing their ability to see dim objects through a telescope. Military personnel on night missions may need to read maps or perform other tasks while preserving dark adaptation. This need has led to the design of low-intensity red flashlights, red-lit cockpits and control rooms, red finger-lights for map reading, and red dials and gauges in vehicle control systems.
Look again at Figure 5.11. The difference between the rod and cone peak sensitivities is the source of a perceptual effect called the Purkinje shift (Wolfe & Ali, 2015), a subtle perceptual effect that you may never have noticed. This shift refers to the fact that when two light sources, one short and one long wavelength, appear equally bright under photopic conditions, they will not do so under scotopic conditions. The short-wavelength light will look brighter than the long-wavelength light under conditions of dark adaptation because of the contribution of the rods. The long-wavelength light will look dimmer. You can notice the Purkinje shift at dusk. During the day, red and yellow objects may appear brighter than green and yellow objects. As day fades into night and the rod system takes over, blue and green objects will tend to appear brighter than red and yellow objects.
Temporal and Spatial Summation
Brightness is also influenced by how long a light is on and how big it is. For lights that are on only very briefly (100 ms or less), brightness is a function of both the intensity and the exposure time. This relation, known as Bloch’s law (Gorea, 2015), is
where: |
|
T |
is the exposure time, |
I |
is light intensity, and |
C |
is a constant brightness. |
In other words, a 100 ms light that is half the intensity of a 50 ms light will appear equally bright, because the energy of both lights over a 100 ms period is equal. For these flickering or very short-duration lights, it is the total amount of light energy during the presentation period that determines brightness.
The area or size of a light also affects its detectability and brightness. For very small areas of approximately 10 min of visual angle (discussed later in this chapter), Ricco’s law states that
where A is area. For larger stimuli, Piper’s law states that
Whereas Bloch’s law describes how light energy is summed over time, Ricco’s and Piper’s laws describe how light energy is summed over space (Khuu & Kalloniatis, 2015). Spatial summation occurs because of the convergence in the rod system. Perception of brightness is less influenced by stimulus size or area in the fovea than in the periphery (Lie, 1980), because the degree of convergence is much greater in the periphery.
The amount of light reflected from an illuminated surface is a function of both the level of illumination and the degree to which the surface reflects light. While brightness is the perceptual attribute associated with overall light intensity, the term lightness refers to the perceptual attribute associated with reflectance (Gilchrist, 2006). Lightness describes how dark or light an object appears on a scale from black to white. Black surfaces have low reflectance and absorb most of the light that falls on them, whereas white surfaces have high reflectance and reflect most of the light that falls on them.
Lightness is very different from brightness in a number of ways. For instance, brightness is a function of intensity: As intensity increases, brightness increases. Consider, however, the reflectance of two surfaces under two levels of illumination. Under high levels of illumination, both surfaces will reflect much more light energy than under low levels of illumination, yet their relative lightness will tend to remain the same (Soranzo, Galmonte, & Agostini, 2009). This phenomenon is called lightness constancy.
For example, pieces of white and black paper will look white and black whether viewed inside or outside in the sun. Because the intensity of illumination outside typically is greater than inside, the black paper may actually be reflecting more light outside than the white paper does inside. The perception of lightness is tied to the reflectance properties of the objects rather than the absolute amount of light reflected from them.
Lightness contrast refers to the fact that the perceived lightness of an object is affected by the intensity of surrounding areas (e.g., Soranzo, Lugrin, & Wilson, 2013). The key difference to note between lightness contrast and lightness constancy is that the former occurs when only the intensity from surrounding regions is changed, whereas the latter occurs when the intensity of illumination across the entire visual field is changed. Figure 5.12 shows lightness contrast, because the center squares of constant intensity appear progressively darker as the surround becomes lighter.

FIGURE 5.12Lightness contrast.
In general, two stimuli will appear equally light when the intensity ratio of each stimulus to its respective surround is the same (Wallach, 1972). Lightness contrast in Figure 5.12 arises because this ratio is changed. While the center square is of a constant gray level, the gray level of the surround is changed. Gelb (1929) demonstrated the importance of the contrast ratio. He suspended a black disc in black surroundings. A hidden light source projected light only onto the disc. In this situation, the black disc looked white. In terms of the constant-ratio rule, the conditions for constancy were violated because the disc had a source of illumination that its background did not. However, when he placed a small piece of white paper next to the black disc so that it also was illuminated by the hidden light source, the black disc then looked black.
Gilchrist (1977) made one of the most compelling demonstrations of this type. He arranged a situation in which a white card was seen as white or dark gray, depending on the card’s apparent position in space. As shown in Figure 5.13, the observer looked at three cards through a peephole. Two of the cards (a white test card and a black card) were in a front chamber that was dimly illuminated, while the third card (also white) was in a back chamber that was brightly illuminated. By changing the shape of the white test card, Gilchrist made the third card look as if it was either behind (panel a in Figure 5.13) or in front of (panel c) the other two cards.

FIGURE 5.13Gilchrist’s apparatus with the test stimulus constructed to appear in the front room (a) or in the back room (b and c).
Observers judged the lightness of the test card (the white card in the front room). When the test card looked as if it was in the front room with the black card, it was seen as white. However, when the shape of the card made it look as if it was in the back room with the more brightly illuminated white card, it was seen as almost black. This phenomenon suggests that the perception of illumination is important to lightness. If the test card really had been in the brightly lit back chamber, it would have been reflecting less light than the white card and so appeared dark. Apparently, the perceptual system uses “logic” like this to compute lightness. Thus, even the basic aspects of sensory experience of the type covered in this chapter are subject to computations performed by higher-level brain processes.
SPATIAL AND TEMPORAL RESOLUTION
We discussed acuity in general terms earlier in this chapter. To discriminate objects in the visual field, differences between regions of different intensity must be resolved. More formally, acuity can be measured by finding the minimum visual angle for a detail that can be resolved. Visual angle is a measure of stimulus size that does not depend on distance: it is a measure of the size of the retinal image. Because of this property, it is the most commonly used measure of stimulus size. As shown in Figure 5.14, the size of the retinal image is a function of the size of the object and its distance from the observer. The visual angle is given by

FIGURE 5.14Visual angle of a quarter viewed at 70 cm.
where: |
|
S |
is the size of the object, and |
D |
is the viewing distance, in equivalent units. |
There are several types of acuity. Identification acuity can be measured by the use of a Snellen eye chart, which is the chart you’ve probably seen in your doctor’s office. It consists of rows of letters that become progressively smaller. Acuity is determined by the smallest letters that the observer can identify. Identification acuity is often specified in terms of the distance at which the person could identify letters that an observer with normal vision could identify at a standard distance. In the U.S., this standard distance is 20 ft (6.1 m); thus, a person with 20/20 vision can identify letters at 20 ft that a normal observer could from 20 ft away, whereas a person with 20/40 vision can only identify letters that a normal observer could from as far as 40 ft away.
Other kinds of acuity are vernier and resolution acuity. Vernier acuity is based on a person’s ability to discriminate between a broken line and an unbroken line (Westheimer, 2005). Resolution acuity is a measure of the person’s ability to distinguish multiple bars (or gratings) from a single area of the same average intensity (Chui, Yap, Chan, & Thibos, 2005).
Acuity varies as a function of many of the factors that influence brightness. As we already discussed, acuity decreases as the location of a shape is moved out from the fovea to the periphery. This decrease is even more drastic if irrelevant random shapes are presented nearby (Mackworth, 1965) or if a person’s attention is focused on other stimuli in the center of the visual field (Williams, 1985).
Acuity is better under photopic viewing conditions than under scotopic conditions. Like Bloch’s law for brightness, acuity is a function of time and contrast for durations of up to 300 ms (Kahneman, Norman, & Kubovy, 1967). In other words, for shapes presented for less than 300 ms, we can increase a person’s acuity by increasing the contrast (difference in intensity between light and dark regions) or by increasing exposure duration.
Usually, we think of acuity as the ability to resolve detail in static displays, or images that do not change over time. However, motion can affect acuity. Dynamic acuity is measured when there is relative motion between an object and the observer (Miskewicz-Zastrow, Bishop, Zastrow, Cuevas, & Rainey, 2015). Typically, dynamic acuity is poorer than static acuity (Morgan, Watt, & McKee, 1983; Scialfa et al., 1988), but they are highly correlated. That is, a person with good static acuity will probably have good dynamic acuity. Both types of acuity decline with age, although the decline is greater for dynamic acuity.
Acuity is an important consideration for any task that requires processing of detailed visual information, like driving. All states in the U.S. require that applicants for driver’s licenses pass identification acuity examinations. These examinations are tests of static identification acuity under high levels of illumination, and typically a minimum acuity of 20/40 is required for a license to drive without corrective lenses. Because driving involves dynamic vision, and night driving occurs under low levels of illumination, the traditional driving acuity test does not measure acuity under anything like actual driving conditions. You should not be surprised to learn, then, that dynamic acuity predicts driving performance better than static acuity measures (Sheedy & Bailey, 1993). A study of young adult drivers showed high correlations between dynamic visual acuity and identification of highway signs under dynamic viewing conditions, suggesting that at least part of the relation between dynamic visual acuity measures and driving performance may be due to the ease and accuracy with which highway signs can be read (Long & Kearns, 1996).
The standard acuity test seems particularly inappropriate for older drivers. People over the age of 65 show little deficiency on the standard acuity test, but show significant impairment relative to younger drivers when static acuity is measured under low illumination (Sturr, Kline, & Taub, 1990). Moreover, the elderly report specific problems with dynamic vision, such as difficulty reading signs on passing buses (Kosnik, Sekuler, & Kline, 1990), which correlates with the larger problem of reduced dynamic acuity (Scialfa et al., 1988). To provide assessment of visual ability for driving, Sturr et al. (1990) have recommended a battery of acuity tests involving static and dynamic situations under high and low levels of illumination.
Another way to view acuity is in terms of spatial contrast sensitivity, or sensitivity to fluctuations between light and dark areas. The spatial distribution of light in a visual scene is a complex pattern that can be analyzed according to how quickly the fluctuations between light and dark occur. Parts of a scene may fluctuate very quickly whereas other parts may fluctuate more slowly. These different parts have different spatial frequencies. It turns out that people are not equally sensitive to all spatial frequencies.
This fact can be seen in the human contrast sensitivity function. This function reflects the ability of a person to discriminate between a sine-wave grating and a homogeneous field of equal average illumination. A sine-wave grating is a series of alternating light and dark bars that, in contrast to a square-wave grating, are fuzzy at the edges (see Figure 5.15). High-frequency gratings are composed of many fine bars per unit area, whereas low-frequency gratings are composed of few wide bars per unit area. We can measure a threshold for contrast detection by finding the lowest amount of contrast between the light and dark bars necessary for the observer to discriminate a grating from a homogeneous field.

FIGURE 5.15Sine-wave gratings of (a) low, (b) medium, and (c) high spatial frequencies.
The contrast sensitivity function for an adult (see Figure 5.16) shows that we are sensitive to spatial frequencies as high as 40 cycles per degree of visual angle. Sensitivity is greatest in the region of 3–5 cycles per degree and decreases sharply as spatial frequencies become lower or higher. The visual system is less sensitive to very low spatial frequencies and high spatial frequencies than to intermediate ones. Because the high frequencies convey the fine details of an image, this means that under low levels of illumination, such as those involved in driving at night, we will not be able to see details well.

FIGURE 5.16Spatial contrast sensitivity function for an adult.
The contrast sensitivity function specifies how both size and contrast limit perception, whereas standard visual acuity tests measure only size factors. Ginsburg, Evans, Sekuler, and Harp (1982) compared the ability of standard acuity measures and contrast sensitivity functions to predict how well pilots could see objects under conditions of reduced visibility (like twilight or fog). Pilots flew simulated missions and then landed. On half of the landings, an object blocked the runway, and the landing had to be aborted. Their results indicated that the pilots who saw the object at the greatest distance were those with the highest contrast sensitivity.
Contrast sensitivity to intermediate and low spatial frequencies can predict how well people see stop signs at night (Evans & Ginsburg, 1982) and recognize faces (Harmon & Julesz, 1973). Such results suggest that measurement of contrast sensitivity may be useful in screening applicants for jobs that require a lot of visually oriented tasks. Measurement of contrast sensitivity under dynamic viewing conditions may provide a better overall indicator of a person’s visual functioning than any other acuity measure, and it may allow improved prediction of performance at driving and other dynamic visual-motor tasks (Long & Zavod, 2002). Unfortunately, getting measurements of both static and dynamic contrast sensitivity is expensive and time-consuming relative to measurements of simple static acuity, and so evaluation of contrast sensitivity is often neglected in favor of the cheap and easy Snellen eye chart.
Lights that flicker and flash are present everywhere in our environment. In some cases, as with train-crossing signals, the flicker provides an important message that drivers need to see. In other cases, such as video display screens, flicker is undesirable. The visibility of a continuously flickering light is determined by a person’s critical flicker frequency (CFF), or the highest rate at which flicker can be perceived (Brown, 1965; Davranche & Pichon, 2005). With high-luminance stimuli of relatively large size, like a computer monitor, the CFF can be as high as 60 Hz. It is lower for stimuli of lower luminance and smaller size. Many other factors, such as retinal location, influence the CFF.
Video displays or sources of illumination that are intended to be seen as continuous should be well above the CFF, whereas displays intended to be seen as intermittent should be well below it. For example, fluorescent lamps flicker continuously at 120 Hz (cycles per second), a rate that is sufficiently high for new lamps that flicker is not detectable. However, because the CFF decreases for lower luminance, when a lamp needs to be replaced, the decrease in luminance of the old lamp makes the flicker visible.
Using methods similar to those used to determine spatial contrast sensitivity, we can ask how well an observer can distinguish between a light whose luminance level increases and decreases sinusoidally (flickers) and a constant light. This ability depends on the overall intensity of the light (Watson, 1986). We can measure temporal contrast sensitivity for different temporal frequencies and luminance levels and plot it as a temporal contrast sensitivity function (see Figure 5.17). As with spatial contrast sensitivity, temporal contrast sensitivity increases with temporal frequency to an intermediate value (around 8 Hz for a bright light), then decreases with further increases in temporal frequency up to the CFF of about 60 Hz (de Lange, 1958). The form of the function is influenced by factors such as the intensity of ambient lighting and the spatial configuration of the light relative to its background.

FIGURE 5.17Temporal contrast sensitivity functions for an adult at several background intensities.
When two visual images are presented to the retina in close spatial or temporal proximity to each other, the perception of one of those images (which we will call the mask) can interfere with the perception of the other (the target). Such interference, called masking, occurs in a variety of situations (Breitmeyer & Öğmen, 2006). We refer to simultaneous masking when the target and mask occur simultaneously, while we use the terms forward masking and backward masking to describe perceptual problems that arise when the mask precedes or follows the target, respectively. With forward and backward masking, the amount of time between the onsets of the two stimuli will determine the degree of masking.
We can distinguish at least three broad categories of masking situations for which the location of the mask on the retina overlaps the location of the target stimulus (Breitmeyer & Öğmen, 2000). For homogeneous light masking, the mask is an equiluminant patch of light flashed before, during or after a target; for structure masking, the mask shares many features with the target; for visual noise masking, the mask consists of a clump of random contours. The effects of these types of masking are usually most pronounced when the target and mask are presented together, as is the case under conditions of glare, where the light energy from a glare source (the sun reflected off a driver’s rearview mirror, the headlamps of an oncoming car) decreases the contrast of an image (the view of the roadway in front of your car). As the time between the target and the masking image increases, the masking effect decreases. Part of this effect appears to be due to temporal integration. That is, even when presented separately, the light energy of both the target and the mask is at least partially summed, reducing the visibility of the target.
A fourth type of masking occurs when the target and mask do not overlap. This is called metacontrast or lateral masking. The magnitude of metacontrast masking decreases as the spatial separation between the stimuli increases. Moreover, when the target and mask are of approximately equal luminance, the largest masking effect occurs when the target precedes the mask by 50–100 ms. Theories of metacontrast focus on lateral connections in the visual system, attributing the effect to the different properties of the parvocellular and magnocellular systems (e.g., Breitmeyer & Ganz, 1976) or to the temporal dynamics of the neurons involved in the formation of boundaries and contours (Francis, 2000). However, it also is possible that metacontrast reflects, at least in part, higher-level attention and decision processes (e.g., Shelley-Tremblay & Mack, 1999). Regardless of the causes for visual masking, the human factors specialist needs to be aware that masking can occur when an operator must process multiple visual stimuli in close spatial and temporal proximity.
Machines in the environment communicate with humans by displaying information in at least one sensory modality, most often vision. The first step toward the optimization of information displays is to understand the sensitivities and characteristics of these sensory input processes. Because the senses are not equally sensitive to all aspects of stimulation, a good display must be based on those aspects that will be readily perceived. For example, if a display is intended for use under low levels of illumination, it makes no sense to use color coding, because the user’s cones will not be responsive in the dark.
The human factors specialist needs to know the properties of the physical environment to which the visual sensory receptors are sensitive, the nature of the process involved in the conversion of the physical energy into a neural signal, and the way in which the signal is analyzed in the sensory pathways. It is also important for her to know how vision is limited, so that the displays she designs can compensate for those limitations.
Although the visual sensory system constrains what can be perceived, perception involves more than a passive registration of the results of the sensory analyses. Perception is often characterized as a highly constructive process in which the sensory input serves as the basis for the construction of our perceptual experience. In the next chapter, we will examine the factors that influence the way in which we organize and perceive the world around us.
Boff, K. R., Kaufman, L., and Thomas, J. P. (Eds.) (1986). Handbook of Perception and Human Performance: Volume 1, Sensory Processes and Perception. New York: Wiley.
Coren, S., Ward, L. M., and Enns, J. T. (2004). Sensation and Perception (6th edn.) San Diego, CA: Harcourt Brace.
Goldstein, E. R. (Ed.) (2001). Blackwell Handbook of Perception. Malden, MA: Blackwell.
Goldstein, E. R. (2016). Sensation and Perception (10th edn). Belmont, CA: Wadsworth.
Wade, N. J., and Swanston, M. T. (2013). Visual Perception: An Introduction (3rd edn.) New York: Psychology Press.
Wolfe, J. M., Kluender, K. R., Levi, D. M., Bartoshuk, L. M., Herz, R. S., Klatzky, R. L., Lederman, S. J., & Merfeld, D. M. (2015). Sensation and Perception (4th edn.) Sunderland, MA: Sinauer Associates.