

Information Quality and big data
Big data was initially described as driven by the three Vs: volume, variety, and velocity. Organizations were trying to address extreme volumes of information to incorporate a wider variety of information into their analysis, and to consume event-driven information arriving at high velocity. However, it was not long until a fourth V, veracity, was added to this list. In part, veracity represents a wanted state for all of the high-volume, high-velocity, and high-variety data. Organizations are using big data to drive analysis to achieve better and faster decision making. Therefore, they need confidence in the results of the analysis, for the results to be worthy of their trust.
There was a time when more data meant more trust. Business people wanted more information about their customers, their products, and their markets to support sound decisions. Today, though, in this new era of computing, you want more data up to a point; then, you move into this new and unsettling terrain where more data does not mean more trust. In fact, it is often the opposite. Addressing this issue of trust is the domain of Information Quality in the realm of big data.
This chapter explores key aspects of veracity in big data, specifically understanding big data content, and providing techniques to ensure and monitor that big data is fit for your purposes.
8.1 Information quality and information governance
Chapter 2, “Information Governance foundations for big data” on page 21 explored the Information Governance framework and its primary disciplines. Figure 2-1 on page 23, the Information Governance Maturity Model, showed that Information Quality is one of the core disciplines of the model. At the same time, the changing volume, variety, velocity, and veracity of data alter the requirements and risks for Information Quality. Data stewards, data scientists, and data analysts must be aware of these risks and considerations to ensure that information that is used in business decisions can be trusted and used with confidence.
Traditionally, Information Quality is defined as a set of identified dimensions, such as Completeness, Validity, Uniqueness (non-duplication), Timeliness, Accessibility, and Auditability (lineage).1 When Information Quality is applied to big data, particularly to the largely unstructured set of social media data feeds, it is easy to dismiss Information Quality as irrelevant, that these measures do not apply, and there is no need to evaluate Information Quality. This argument assumes that these big data sources are either usable as is, present no risk, or both. Ultimately, big data is used to drive business decisions. If the information is incomplete or incorrect, it still impacts the business decision. You must step back and ask: “Given the context in which I want to use this set of data, what information about the set do I require to have trust or confidence in that data?”
This shift, or stepping back, allows you to ask relevant questions, identify potential risks, and define the relevant measures or dimensions for Information Quality for all types of data, whether within a big data or traditional data context. If you examine the big data use cases, you can identify the type of data that is used, some of the potential risks, and some of the relevant Information Quality measures for each type.
In this broader information governance context, several key roles must be considered:
•Data owners, often line-of-business executives, drive much of the usage and decision making based on the data. These individuals must communicate the broad requirements for the data, ask appropriate questions, and consider the risks with particular data in the decision-making process.
•Data stewards put in place the practices and disciplines of information governance and information quality around the data sources. They evaluate which sources need regular monitoring for quality, particularly where those sources are used for ongoing business processes, and ensure that practices are in place to monitor the information quality measures.
•Data scientists and their teams focus on identifying which sources might be of use given the business requirements, which sources might provide additional insight or mitigate risk, review data content to identify deficiencies, and test out hypotheses to ensure that the data is of use and value in decision making.
•Data analysts act on behalf of the above individuals and teams to put appropriate information quality practices, rules, measures, and processes in place to ensure that the data continuously supports the needs of the organization and to review and remediate issues that are found with the data, rules, measures, or processes.
8.2 Exploring big data content
This section describes the activity of exploring your big data content.
8.2.1 Knowing your data
Since the early 2000s, the first capability (sometimes referred to as a “pillar”) for information integration has been “understanding”. Not only does this not change for big data, but in many cases you must dig deeper and cast aside typical assumptions from the world of structured data. Consider a typical traditional operational system, such as a payroll application. The data represents the salaries of your employees and what they have been paid each pay period. Your organization owns the data and controls how it is entered and stored (or your application system manual tells you those details), and you either have the metadata or can get it.
Now, consider an external source, perhaps statistics on typical employee salaries by various occupational classes over the last five years. Who created the source? What methodology did they follow in collecting the data? Were only certain occupations or certain classes of individuals included? Did the creators summarize the information? Can you identify how the information is organized and if there is any correlation at any level to information that you have? Has the information been edited or modified by anyone else? Is there any way for you to ascertain this information?
In addressing big data, an organization must address these questions, including aspects such as establishing the provenance (and possible lineage) of the data, the methods and biases that are used in data capture, and the methods (statistical or otherwise) that are used in data filtering and aggregation. Many of these aspects are assumed or treated as non-existent within traditional data sources, at least in relation to the contexts and purposes to which they are applied (such as reporting).
Although there is a broad range of possible data sources and types of data in big data, which is based on the use cases that are described in Chapter 4, “Big data use cases” on page 43, there are several common data types that can be used to illustrate the questions that are relevant to veracity. In our example, we look at Call Record Data, Sensor Data, Machine Data (for example, Logs), and Social Media Data.
8.2.2 Call detail records
Call detail records (CDRs) represent a large set of big data records. These records not only include data from phones and mobile phones, but also details that are related to Voice over Internet Protocol (VoIP) calls, such as conference calls and web-based seminars.
There are variations in formats depending on the provider (for example, telecommunications companies), but this data is also likely to be structured (for example, comma-separated value (CSV) or possibly hierarchical format). Information can be continuous, but most likely there are files or feeds batched from different sources at selected points in time (for example, daily). Such information can be used to integrate with other location-based data (for example, proximity of a shopper to a store), to assist with fraud or security analytics, or with solutions supporting cities or healthcare.
A call detail record can be considered a form of transactional metadata. It contains data fields that describe a specific instance of a telecommunication transaction, but does not include the content of that transaction. A call detail record contains at a minimum the following fields:
•The number making the call (party A)
•The number receiving the call (party B)
•The date and time when the call started
•The duration of the call
•The type of the call (such as voice and text)
In modern practice, though, there is much additional information that is provided. For example, with a mobile phone transaction, it is likely to include at least the global positioning system (GPS) of the cell tower the call went through. The content does differ based on the particular provider or service.
There are many different file formats or structures that are possible, such as comma-separated value (CSV) log files, extensible markup language (XML) files, or encrypted or encoded formats. These files, though, follow patterns that are familiar in traditional data.
Risks
In most cases, call data is expected to occur daily and is used to drive business processes daily. Call data can be used in a number of use cases, possibly serving to identify demand or usage patterns, or to forecast trends. Missing data certainly impacts these situations. Incorrect data, such as code values, might skew information and subsequent decisions in unexpected and incorrect directions.
Relevant measures
At a basic level, an organization must consider that when data is batched together as a file, there are quality checks for completeness of data that can occur at this level. Were all files received? Were any dates missed? Were any dates duplicated?
File type and size might provide a measure of structural integrity or consistency. It is feasible to have a broad range of file sizes, so it might be necessary to assess and understand what the typical variance is.
If the file is expected to have header or trailer records, then those records should be present, have the correct date range, and contain counts that match the detail record totals. These are measures of completeness and structural integrity of the batch file.
At the detail record level, typical information quality measures are used:
•Completeness: The required fields are populated.
•Integrity: The format should conform to a defined format.
•Validity: Many fields have standard acceptable values (for example, a field that is called Locale Country should contain a two character ISO Country Code).
•Consistency: There should be a detailed call end date within the start and end date of the header.
Additional measures might address the following items:
•Coverage and Continuity of Call Data: Receipt of data from expected sources at expected times.
•Receipt of batches/inputs per day over time.
•Gaps might indicate issues with call data source.
•Consistency of Call Data: Comparison versus data over time (for example, length of calls, number of calls, and overlaps of call data records for same user).
•Uniqueness of Call Data: Level of uniqueness for data within the batch or across batches.
Overall, Call Record Data, although of potentially high volume, falls into traditional data patterns that are related to information quality.
8.2.3 Sensor data
There is nothing like an Internet of Things (basically anything that has an embedded sensor) to help drive big data, and sensors are a significant part of this data explosion. It seems that practically any mobile device can become a sensor these days, not to mention the range of radio frequency identification (RFID) tags, machine sensors for weather, water, traffic, and so on. Apple’s iPhones (Version 4 and later) include distinct sensors, such as an accelerometer, a GPS, a compass, and a gyroscope. These types of sensors are driving new initiatives such as IBM Smarter Cities®.2 A good example of such use is SFpark,3 a program helping drivers find parking spaces in San Francisco through 8200 parking sensors.
Although there are a wide variety of possible sensors for various purposes, there are several factors to consider:
•There are varied data formats depending on the sensor type, but, in general, there is likely a consistent format for each sensor type.
•The data format is likely to be structured or hierarchical data (such as XML, CST, and Really Simple Syndication (RSS)).
•There are multiple sensors of particular types.
•Most sensors produce continuous feeds in real time, although certain sensor data may be collected/delivered at selected or different points in time.
Here are some examples of sensors:
•Mobile device recordings
•Sensors for weather, traffic, water, motion, and so on
•Sensors for RFID tags
From an information quality or governance perspective, there is a large range of possible data that is generated, but an example, such as data from the National Weather Service,4 is illustrative. The weather data comes from approximately 1800 tracking stations, and this data is generated at hourly intervals daily. Although it is feasible to look at some raw text data, there are two primary forms of data available: RSS and XML (the RSS is more truncated XML). An organization can obtain individual station data or compressed files of all the data for a time period.
For example, in a three-day period (25, 27, and 28, June 2013), the National Weather Service had 4165, 4169, and 4171 files respectively by date that were available in either the format XXXX.xml or XXXX.rss (where XXXX is the station identifier).
From an information processing perspective for an organization processing this basic sensor data, some immediate considerations about the data can be raised:
•Was the correct file type gathered?
•Did the contents match the stated file type?
•Given the lack of date in the file name, was this new data or contents already received?
As an example, look at the XML file that is shown in Example 8-1, which is modeled on the National Weather Service readings.
Example 8-1 National Weather Service readings
<?xml version=”1.0” encoding=”IAO-8859-1”?>
<?xml-stylesheet href=”latest_ob.xsl” type=”text/xsl”?
<current_observation version=”1.0”version=”1.0”
xmlns:xsd=”http://www.w3.org/2001/XMLSchema”
xmlns:xsi=”http://www.w3.org/2001/XMLSchema-instance”
<observation>2013-07-01 10 10:10</observation>
<location>Centertown, KS</Location>
<station_id>XMPL</statuib_id>
<latitude>39.80</latitude>
<longitude>-98.50</longitude>
<weather>Cloudy</weather>
<temperature_string>85.0 F (29.4 C)</temperature_string>
<temp_f>85.0</temp_f>
<temp_c>29.4</temp_c>
<relative_humidity>77</relative_humidity>
<wind_dir>Southwest</wind_dir>
<wind_mph>12.7</wind_mph>
</current_observation>
The contents include the following data:
•Location
•Station ID
•Latitude
•Longitude
•Observation time
•Temperature (both Fahrenheit and Celsius)
•Wind (direction and speed in miles per hour)
All of these features are structured content, which means they can be checked for typical information quality measures, such as the following ones:
•Completeness (Does the data exist?)
•Format (Does the data conform to an expected structure?)
•Validity (Is the data in the correct value set or range?)
There is some variation in the fields that are provided, which is common with XML documents, which indicates that additional checks might be made for consistency versus the XML schema or consistency over time intervals.
Although not occurring in these examples, but feasible for sensor data, is the possibility of sensor diagnostic or error codes. For example, a temperature value of -200.0 can be an indicator that the sensor had an error condition and uses that available field to pass on the diagnostic data. Depending on whether the sensor is external or internal, this may be an item to note as Incomplete or might be an item to trigger some notification/alert process.
Risks
Mary Shacklett commented in a blog called Big Data Analytics: “But as this new machine-driven intelligence comes online, new risks are created that challenge the traditional thinking of IT risk management plans. Three major questions emerge:
•What happens if the mechanized automation or sensors fail?
•Is there a potential for greater security threats now that mechanized field operations flow over the Internet?
•Are there new information privacy risks?”5
Focusing on the first of these questions, what happens if a sensor fails? Perhaps nothing if the sensor is a weather station and there are other nearby stations. But if the sensor is monitoring a key component in an aircraft engine, a rail line, or a nuclear power plant, missing or incorrect information might create significant risk to public safety.
Relevant measures
It is possible that an individual sensor reading that appears complete, correctly formatted, valid, and consistent might still have quality issues. Here are some additional factors to consider:
•Are there data points for all intervals or expected intervals? This is a measure of continuity for the data and can be applied to individual sensors and groups of sensors.
•Is there consistency of data across proximate data points? For example, regarding weather readings, if St. Paul, MN and Bloomington, MN both show temperatures at 84.0 F, but Minneapolis, MN shows a temperature of 34.0 F, the latter is probably an error, as you do not expect that sharp a temperature variant at locations in close proximity.
•Is there repetition/duplication of data across multiple recording intervals? The same data can come from a given sensor over multiple time periods, but is there a point at which this data becomes suspicious and suggests an issue with the sensor?
•Is there repetition/duplication of data across multiple sensors? There might be the same temperature, humidity, and wind for St. Paul, MN and Minneapolis, MN, but do you expect the exact same measurements between two sensors hour after hour? Some marginal variation in sensor readings is expected and consistent with different recording points.
Given the volume of data points and the velocity or frequency of delivery, these measures of continuity, approximate consistency, and repetition are as important as measures of information quality as completeness or validity are, if they are critical to analytic use. All of these measures can be evaluated and monitored and tracked over time as well, giving additional insight into trends of information quality.
With an understanding of the data content and potential points of information quality failure, you come back to the question: What information about the set do you require to have trust or confidence in that data? If an organization is evaluating the impact of the weather on store-based sales versus online sales, they might want to correlate the hourly weather readings of stations that are close to their stores and close to particular customers' billing addresses. Hourly gaps might impact this analysis, but they might be able to smooth over such gaps with other nearby sensor readings.
If an organization is evaluating daily sales leading up to Christmas, they might care about only the aggregate weather for the day, such as minimum and maximum temperature and total precipitation. Two or three out of 24 possible data points might be sufficient for their needs, and the impact of specific data quality issues from a given sensor drops with an increase in available data points for the period or the general area. Conversely, if they have only one sensor with sporadic data near a given store or customer, the impact of data quality issues grows significantly.
The Internet of Things, the instrumentation of many devices, is having a profound impact on the variety, volume, and velocity of incoming data to evaluate. Although you looked at just one example of the type of information that is available from sensors, familiar data, such as weather observations, shows that not only do common information quality measures remain, but there are additional measures that can be put in place for ongoing monitoring. What becomes interesting is how the aggregation of such data might shift the quality requirements and their associated impact.
8.2.4 Machine data
Machine data fits the basic characteristics of big data: volume, variety, and velocity. Most applications and systems produce an ongoing series of data outputs (for example, logs) with variety or a different format for each one. The volume and variety of this data makes manual consumption difficult. Sifting and correlating data across multiple files is laborious and time consuming. The volume of this data continues to grow as more of the world is instrumented.6
System logs are one example of machine data. As an example, consider Figure 8-1 on page 203, which shows an IBM WebSphere Application Server log that is generated by an application of a fictitious company.7

Figure 8-1 Sample WebSphere Application Server log
This log has a number of notable characteristics:
•A time stamp begins each record and has a specific format, such as Sat July 14 03:58:13 PM.
•The time stamp is preceded by a string represented by "[". A regular expression such as "((\n)|(\r))+\[" can describe the repetitive occurrence of these characters at record boundaries.
•The time stamp is missing certain values, such as the year and the time zone. Such information may be available from the processing system.
•The log is missing other information, such as the name of the application or the server.
For further consumption and analysis, tools such as the IBM Accelerator for Machine Data Analytics might be needed to generate metadata and add in the relevant but missing information.
Risks
The risks that are identified under sensor data might be applicable to machine data, such as logs, as well. At first glance, the privacy risk appears to be minimal or non-existent, but such logs often record user IDs. But, where logs record potential issues with operational systems, missing or incomplete data might mean that critical operational responses do not occur, resulting in network or system failure.
Relevant measures
Generally, logs and similar machine data are expected to be produced at regular intervals. Completeness measures should address or look for the expected frequency of delivery and data frequencies. For example, a given log might on average produce 1000 lines of output per day. Variations above or below particular levels (such as beyond two standard deviations of the average) might signal an unusual error state that is generating many warning or error messages (when higher than expected) or the failure to record required data, such as when the log space is full (when there is a lower volume than expected).
Format and consistency checks can be applied to fields that are extracted from logs to ensure that the same type of information is produced. Extracted fields may contain defined values or codes that can be tested as valid. It is also possible to look at the raw log data for specific values or data patterns and compare them to the extracted data. Such an approach might help identify emerging situations or changes to the data that is produced by a specific application in its logs.
Evaluation of machine data, such as logs, is likely to focus on these areas of completeness and consistency to ensure that the correct information is extracted and provided to consuming applications, such as monitoring systems.
8.2.5 Social media data
Social media, such as tweets, blogs, and board messages, represent one of the rapidly expanding segments of big data, and one that organizations across many industries are taking significant advantage of, particularly for the 360° View of the Customer use case that is described in 4.3, “Enhanced 360° view of the customer” on page 49.
Many social media sites offer APIs that programmers can use to obtain public data, and there are software applications that can import various public data feeds. Often, these data feeds are returned or received in JavaScript Object Notation (JSON) format, an open standard that structures objects in a manner similar to XML. An example of data from a Twitter-based search on the topic “IBM Watson” is shown in Example 8-2. It shows the sample JSON record structure from a Twitter-based search.8
Example 8-2 Sample JSON record for a Twitter-based search
{
"completed_in": 0.021,
"max_id": 99999999111111,
"max_id_str": "99999999111111",
"next_page": "?page=2&max_id=99999999111111&q=IBM%20Watson",
"page": 1,
"query": "IBM+Watson",
"refresh_url": "?since_id=99999999111111&q=IBM%20Watson",
"results": [
{
"created_at": "Mon, 30 Apr 2012 18:42:37 +0000",
"from_user": "SomeSampleUser",
"from_user_id": 444455555,
"from_user_id_str": "444455555",
"from_user_name": "Some Sample User",
"geo": null,
"id": 000000000000000001,
"id_str": "000000000000000001",
"iso_language_code": "en",
"metadata": {
"result_type": "recent"
},
"profile_image_url":
"http://a0.twimg.com/profile_images/222222/TwitterPic2_normal.jpg",
"profile_image_url_https":
"https://si0.twimg.com/profile_images/222222/TwitterPic2_normal.jpg",
"source": "<a href="http://news.myUniv.edu/" rel="nofollow">MyUnivNewsApp</a>",
"text": "RT @MyUnivNews: IBM's Watson Inventor will present at
a conference April 12 http://confURL.co/xrr5rBeJG",
"to_user": null,
"to_user_id": null,
"to_user_id_str": null,
"to_user_name": null
},
{
"created_at": "Mon, 30 Apr 2012 17:31:13 +0000",
"from_user": "anotheruser",
"from_user_id": 76666993,
"from_user_id_str": "76666993",
"from_user_name": "Chris",
"geo": null,
"id": 66666536505281,
"id_str": "66666536505281",
"iso_language_code": "en",
"metadata": {
"result_type": "recent"
},
"profile_image_url":
"http://a0.twimg.com/profile_images/3331788339/Mug_Shot.jpg",
"profile_image_url_https":
"https://si0.twimg.com/profile_images/3331788339/Mug_Shot.jpg",
"source": "<a href="http://www.somesuite.com" rel="nofollow">SomeSuite</a>",
"text": "IBM's Watson training to help diagnose and treat cancer
http://someURL.co/fBJNaQE6",
"to_user": null,
"to_user_id": null,
"to_user_id_str": null,
"to_user_name": null
},
. . .
"results_per_page": 15,
"since_id": 0,
"since_id_str": "0"
}
The JSON format includes a heading reference with the search criteria and trailing content. The core of the format is a series of tweets, including date and time, from and to user information, and the text of the tweet.
Risks
In the aftermath of Hurricane Sandy in 2012, Kate Crawford noted in a Harvard Business Review blog, “The greatest number of Tweets about Sandy came from Manhattan. This makes sense given the city's high level of smartphone ownership and Twitter use, but it creates the illusion that Manhattan was the hub of the disaster. Few messages originated from more severely affected locations, such as Breezy Point, Coney Island, and Rockaway. As extended power blackouts drained batteries and limited cellular access, even fewer Tweets came from the worst hit areas. In fact, there was much more going on outside the privileged, urban experience of Sandy that Twitter data failed to convey, especially in aggregate. We can think of this as a signal problem: Data are assumed to accurately reflect the social world, but there are significant gaps, with little or no signal coming from particular communities.”9
She goes on to comment: “Data and data sets are not objective; they are creations of human design. We give numbers their voice, draw inferences from them, and define their meaning through our interpretations. Hidden biases in both the collection and analysis stages present considerable risks…”10
Consider the following questions from a risk perspective:
•Is there a bias in the collection method? People who have Twitter11 accounts and like to express either where they were or an opinion about a particular subject (such as IBM Watson in the example above) make tweets. But there might be a large group of customers who do not express opinions through this channel. Increasing the number and diversity of these data sources helps to overcome bias.
•Was all relevant data collected? Suppose that you forgot to include critical hashtags? Maybe a common reference to the fictitious Sample Outdoors Company is #SampleOutdoor and a failure to include it significantly skews the results because that is the hashtag that is most commonly used by people complaining about the products. A comparison of search criteria that is used for potential or available variants might be needed to identify this gap.
•Was the geography of the social media information based on the user ID for the message, the identified location of the message, the place of business, or a reference in the body of the text? Is it possible to tell? In some cases, geographic references can be broad, such as a city, state, or country. Geocoding of these locations can end up with largely defaulted information that can skew results. A good example is a recent map of global protests over the last 40 years, which shows the center of protest activity in the United States in Kansas simply because it is the geographic center of the US.12 Evaluation of skews in geographic data can be an important consideration for overall quality.
The bottom line is that biased or incomplete social media data sources can significantly impact business decisions, whether the business misses customer or population segments, misses product trends and issues, focuses attention on the wrong geography, or makes the wrong investments.
Relevant measures
From an information quality perspective, there appears little to measure. Fields might or might not have values, there are some basic data formats, and there is little to check in terms of validity. The content that has value is the creation date, the user (assuming the information can be linked to some master data), the text of the tweet (for sentiment, as an example), and, if present, the geocode or language for the tweet. If that data is not present or is in an invalid format, it is not used.
The crux of social media feeds is culling out data that you can pair with your own internal data, such as customers, products, and product sales.
Consider what you do know from this small example:
•The source
•The collection criteria
•The date and time the tweets were made
•Some identification of the user who sent the tweet
•Some content in the text that matched the collection criteria
By processing the collected file, you can also determine the following information:
•The number of tweets that are included
•The range of dates for the tweets
•The frequency of user identification with the tweets
•An analysis of the text content
This content becomes the core of its usage in data analysis. But over time, each feed can be assessed for varied measures of completeness, uniqueness, and consistency, similar to what you observed with call data and sensor data.
Measures of information quality might include or address:
•Coverage/continuity of social media data:
– Comprehensiveness of the collection criteria. (Does the data include all relevant selections or leave out relevant content?)
– Completeness of data gathering (for example, receipt of batches/inputs per day over time).
– Gaps in times can indicate issues with the social media data source where data is expected to be fairly constant; otherwise, it might simply reflect movement on other, newer topics).
•Consistency or divergence of content in specific social media data feeds: Comparison versus data over time (for example, the average length of text, the number of records, and overlaps of social media records from same user)
•Uniqueness of social media data: Level of uniqueness for data within the batch or across batches (or are there many repetitions, such as re-tweets)
Overall, social media data is a case where the quality is as much about comprehensiveness as content. The content itself might or might not contain useful pieces of information, but if you do not have the content in the first place, then you might get biased or flawed analytics downstream. Beyond this point, there is a fine line between what might reflect a quality of data dimension and an analytical or business dimension.
8.3 Understanding big data
Chapter 4, “Big data use cases” on page 43 described big data use cases in detail. The first use case, Big Data Exploration, is focused on finding the data that you need to perform subsequent analysis. It incorporates the evaluation of all the types of data that are noted above and more to determine what data sources might be useful for inclusion in other key big data use cases.
8.3.1 Big Data Exploration
The questions that were raised when you looked at examples of big data are core aspects of the Big Data Exploration use case. As you and your organization look for the correct data to incorporate into your business decisions, you must consider how well you know the data. Where did it come from? What criteria were used to create it? What characteristics can you understand in the data contents?
Several tools in the IBM Big Data Platform are available to help you understand your big data.
IBM InfoSphere BigInsights
IBM InfoSphere BigInsights is a platform that can augment your existing analytic infrastructure, enabling you to filter high volumes of raw data and combine the results with structured data that is stored in your DBMS or warehouse. To help business analysts and non-programmers work with big data, BigInsights provides a spreadsheet-like data analysis tool. Started through a web browser, BigSheets enables business analysts to create collections of data to explore. To create a collection, an analyst specifies the wanted data sources, which might include the BigInsights distributed file system, a local file system, or the output of a web crawl. BigSheets provides built-in support for many data formats, such as JSON data, comma-separated values (CSV), tab-separated values (TSV), character-delimited data, and others.13
BigInsights is designed to help organizations explore a diverse range of data, including data that is loosely structured or largely unstructured. Various types of text data fall into this category. Indeed, financial documents, legal documents, marketing collateral, emails, blogs, news reports, press releases, and social media websites contain text-based data that firms might want to process and assess. To address this range of data, BigInsights includes a text processing engine and library of applications and annotators that enable developers to query and identify items of interest in documents and messages. Examples of business entities that BigInsights can extract from text-based data include persons, email addresses, street addresses, phone numbers, URLs, joint ventures, alliances, and others. Figure 8-2 highlights the BigInsights applications, such as board readers, web crawlers, and word counts, that help you explore a range of big data sources.

Figure 8-2 Applications for exploration in BigInsights
BigInsights helps build an environment that is suited to exploring and discovering data relationships and correlations that can lead to new insights and improved business results. Data scientists can analyze raw data from big data sources with sample data from the enterprise warehouse in a sandbox-like environment. Then, they can move any newly discovered high-value data into the enterprise Data Warehouse and combine it with other trusted data to help improve operational and strategic insights and decision making.
Capabilities such as sheets facilitate working with data in a common business paradigm. BigSheets can help business users perform the following tasks:
•Integrate large amounts of unstructured data from web-based repositories into relevant workbooks.
•Collect a wide range of unstructured data coming from user-defined seed URLs.
•Extract and enrich data by using text analytics.
•Explore and visualize data in specific, user-defined contexts.
Analysts usually want to tailor the format, content, and structure of their workbooks before investigating various aspects of the data itself. Analysts can combine data in different workbooks and generate charts and new “sheets” (workbooks) to visualize their data with a number of types of sheets available, as shown in Figure 8-3.

Figure 8-3 Types of exploratory spreadsheets in BigInsights
BigSheets provides a number of macros and functions to support data preparation activities, including the built-in operators to filter or pivot data, define formulas, apply macros, join or union data, and so on. BigSheets supports a basic set of chart types to help you analyze and visualize your results. This allows an iterative exploratory process as you discover new insights and decide to drill further into your data. Analysts can also export data into various common formats so that other tools and applications can work with it.
Data scientists and analysts can use the range of features in BigInsights to support Big Data Exploration, but can also address use cases such as Data Warehouse Augmentation and 360° View of the Customer.
BigInsights includes several pre-built analytic modules and prepackaged accelerators that organizations can use to understand the context of text in unstructured documents, perform sentiment analysis on social data, or derive insight out of data from a wide variety of sources.
IBM Accelerator for Machine Data Analytics
IBM Accelerator for Machine Data Analytics is a set of BigInsights applications that speed the implementation of use cases for machine data. These applications use BigInsights runtime technologies to support their implementation.14
Machine data or log data typically contains a series of events or records. Some records are as small as one line, and others can span numerous lines. Typical examples of logs containing records that span multiple lines are application server logs, which tend to contain XML snippets or exception traces, database or XML logs, or logs from any application that logs messages spanning across multiple lines. Apache web access logs or syslogs are good examples of logs containing records fitting in one line.
Often times, machine data is configured to omit information for brevity. Information such as server name, data center names, or any other concept that is applicable to a business can be complementary when used during the analysis of the data. You can associate this information in the metadata to enrich further analysis. As shown in Figure 8-4, the log file information is extracted and standardized into a normal form with relevant metadata.

Figure 8-4 Extracted log data with metadata
The Accelerator for Machine Data Analytics includes support for commonly known log data types and for other, “unknown” logs. To extract interesting fields for the known log types, several rules are provided as standard. Customization is supported to address additional fields. Whether the data is structured, semi-structured, or unstructured, if it is time series-based textual data, it can be used for analysis. Logs can be prepared as batches of similar data and then you can associate metadata by using the generic log type.
The accelerator provides an extraction application to take in previously prepared batches of logs and extract information from each of them. In addition to the metadata with each batch, the extraction application can take additional configurations that commonly apply to multiple batches. After log information is extracted, an indexing application is used to prepare data for searching. The accelerator provides additional applications for deeper analysis.
This rich set of capabilities allows for exploration and incorporation of a wide array of machine and log data, particularly for the Operations Analysis Big Data use case.
IBM Accelerator for Social Media Data Analytics
IBM Accelerator for Social Data Analytics supports use cases for brand management and lead generation. It also offers generic applications that you can customize for your use case and industry.
At a general level, the accelerator supports the import of various social media data feeds, such as board readers and feeds from Twitter. This data can then be prepared, transformed into workbooks or BigSheets as with other data in IBM InfoSphere BigInsights, and then explored and analyzed, as shown in the core steps that are outlined in Figure 8-5.
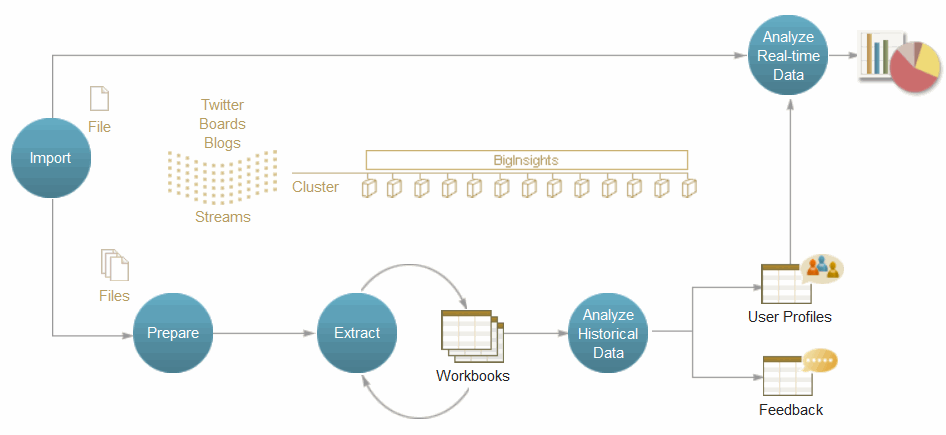
Figure 8-5 Processing with the Accelerator for Social Media Data Analytics
The range of exploratory options in BigSheets with the Accelerator for Social Media Data Analytics allows for working with the data in spreadsheets for sorting and manipulation, including the addition of functions, and the creation of chart views and visualizations of the data, as shown in Figure 8-6.

Figure 8-6 Visualization of social media data through BigSheets
Such visualization can be highly informative about specific dimensions, such as possible biases that can be exposed in the source content, and indicate where data must be supplemented by additional sources.
IBM InfoSphere Information Analyzer
You use IBM InfoSphere Information Analyzer to understand the content, structure, and overall quality of your data at a certain point in time. Understanding the quality, content, and structure of your data is an important first step when you need to make critical business decisions. The quality of your data depends on many factors. Correct data types, consistent formatting, completeness of data, and validity are just a few of the criteria that define data of good quality.
Historically, InfoSphere Information Analyzer was used to provide understanding of traditional data sources, such as relational databases and flat files, but connectivity through Hive to big data sources allows you to bring the capabilities of data profiling and data rules to bear to further and extend your exploration of big data and begin the assessment of overall information quality. Coupled with the capabilities noted in BigInsights to extract and store data sources in HDFS, you can achieve insight into the completeness, consistency, and validity of the data sources, whether working with initial incoming data or sources that hare extracted into more usable formats.
InfoSphere Information Analyzer provides a core data profiling capability to look field-by-field at the characteristics of your data. Data profiling generates frequency distributions for each field that is analyzed. From those frequency distributions, as shown in Figure 8-7, information about the cardinality, format, and domain values is generated for additional assessment.

Figure 8-7 Frequency distribution from InfoSphere Information Analyzer column analysis
From this initial assessment, InfoSphere Information Analyzer supports the development of a broad range of information quality rules, including evaluation of completeness, uniqueness, and consistency of formats or across data sources, validity of domain values, and other more complex evaluations. As an example, information quality rules can test for the presence of common formats, such as a tax identification number that is embedded in text strings, such as log messages or other unstructured fields, as shown in Figure 8-8.

Figure 8-8 Example results from an InfoSphere Information Analyzer rule validation
InfoSphere Information Analyzer supports a disciplined approach to profiling and assessing data quality, and then identifying those conditions that must be monitored on an ongoing basis to provide confidence and trust in the data that is used for key business decision making.
8.4 Standardizing, measuring, and monitoring quality in big data
You have considered the aspects of exploring and understanding big data, including examples of the types of issues that might be encountered. Ultimately, this understanding drives you back to the original business requirements and goals to identify what data is relevant and what data is fit for its designated purpose.
8.4.1 Fit for purpose
What is the quality of a tweet or text message? Or a sensor stream? Or a log file? Or a string of bits that define an image? Does the presence or absence of specific data matter? You have considered these questions based on the type of data, some of the potential risks, and some possible ways to explore and measure the different data sources.
In the world of structured data, a payroll record is complete when the employee ID, payroll date, pay amount, the general ledger account, and certain other fields contain values. It has integrity when the values in those fields have the correct formats and correctly link to data in other tables. It has validity when the payroll date is the system date and the pay amount is in an established range. You set these rules when you established what was fit for purpose. For operational purposes, that means you can pay an individual and record the transaction in the general ledger. For financial reporting, that means you can summarize the transaction as an expense.
In the world of big data, though, with such a variety and volume of data coming in at high velocity, it is hard to ascertain what information quality means, and many of the traditional information quality measures seem to fall short. Is a message complete? Is it correctly formatted? Is it valid? In some cases, the questions appear nonsensical. So, you need to step back and ask “what is fit for your purpose?”, and that leads to another question: “What business objective am I trying to address and what value do I expect from that?” If you can answer this second question, you can start building the parameters that establish what is fit for your purpose, that is, your business requirements and your relevant measures.
In some instances, the business requirements are the same or similar to traditional information quality measures. In the Data Warehouse Modernization use case, which is described in Chapter 4, “Big data use cases” on page 43, organizations store structured data over many years into a Hadoop environment beyond the traditional database. The data is still structured, but the volume is high (for example, transactions over the last 12 years).
Similarly, with the recent development of the “Data Lake”15 concept, organizations might require particular basic checks on incoming data before a file is allowed in (for example, to validate that key fields are present and, if available, to verify that the checksums match expectations). The most successful early adopters of these big data use cases have made information quality pre-eminent in their solution to ensure that the data lake does not become a “data swamp”.
The intersection of understanding of the data with your business requirements brings you back to the point where you can establish the Information Quality, that is, the veracity that is needed for your big data initiative. These measurements might not be the traditional structured data measurements. Completeness might indicate that a message or tweet contains one or more hashtags that you care about; other tweets should be filtered out. You might need to look at continuity as a dimension with sensor readings; did you receive a continuous stream of information, and if not, is there a tolerable gap for the data? In other cases, the measurements may be the same as or close to traditional data measures, but scaled and calculated across a much higher volume.
8.4.2 Techniques for Information Quality Management
As you evaluate these distinct types of data, it is important to keep in mind the techniques that are available to not only assess and measure Information Quality, but also to modify the Information Quality. You can consider this to be the domain of Information Quality Management.
Information Quality validation
From a general perspective, you can assess Information Quality at four levels:
1. The field: A discrete piece of data
2. The record: A collection of related fields, usually of some specific type of data
3. The set: A collection of related records, stored together in a database table, a file, or just a sequence of messages with some designation at the start and end of the set
4. The group of sets: A collection of related sets, stored together in a database schema or a file directory and having some cross-relationship
Data at any of these levels can be assessed and measured at the point of input to a process, within a process, at the point of exit from a process, or within its storage location. Assessing and measuring within a process offers the opportunity to standardize, correct, or consolidate data. Assessing and measuring within a storage location can identify existing patterns of issues for reporting and monitoring, but standardizing or correcting, if needed, must be performed by some additional process.
Consider two types of data from a traditional perspective: master data and transactional data.
Master data includes records about domains, such as Customer, Patient, Product, or Location. Each record for one of these entities has some set of fields, such as a key or identifier, a description, perhaps some alternative references (for example, Name), and likely some set of codes that provide more description or some dates indicating when the record was created or modified.
•Requirements at a field level might indicate whether the field is required or optional, whether it must be complete, whether it must have a specific format, and what, if any, are the rules for the field.
•At a record level, further requirements might indicate whether the record has a valid key, whether the record is complete to a minimum extent, whether the values or relationships between the fields are consistent (for example, an active product must have a unit of measure), and whether there are any other conditions that must be met.
•A set of master data might also have requirements, such as whether each record is unique, whether the data values across records are consistent, and whether aggregated totals within the set are reasonable.
•Finally, there might be evaluations that are needed across sets containing similar master data, such as whether each set has complete and consistent record counts, whether each set's records have the same level of completeness, or whether there are issues of referential integrity across associated sets (for example, corresponding Address records for each Customer).
Transactional data includes records about domains, such as Customer Orders, Shipments, Guest Visits, Patient Stays, or Product Invoices. These records typically intersect at least two master domains, if not more, but represent specific instances often with identified quantities at particular dates and times. For example, an Order indicates the quantity of a given Product that is wanted by a Customer made on a specific date. Each record for one of these entities has some set of fields, such as a transaction identifier, keys to the associated master data, date and time of creation, and some quantity or amount of the transaction.
•Requirements at a field level might indicate whether the field is required or optional, whether it must be complete, whether it must have a specific format, and what, if any, are the rules for the field.
•At a record level, further requirements might indicate whether the record has valid keys for both the transaction and the relevant master data, whether the record is completed to a minimum extent, whether the values or relationships between the fields are consistent (for example, a positive quantity must have a positive price and amount), and whether there are any other conditions that must be met.
•A set of transactional data might also have requirements, such as whether each transactional record is unique (for example, you do not want duplicate orders), whether the data values across records are consistent, and whether aggregated totals within the set are reasonable.
•Finally, there might be evaluations that are needed across sets containing similar transactional data, such as whether each set has complete and consistent record counts (particularly to compare detail and summarized sets) or whether there are issues of referential integrity across the sets (for example, the set of Order transactions is not equal to the number of Shipped Item transactions).
Any or all of these conditions can be evaluated through specific data validation rules that are implemented through specific tools against the actual data sources.
Reviewing different types of big data reveals similar patterns of data. Both call data and sensor data exhibit patterns similar to transaction data at least to the record level.
•Requirements at a field level most likely indicate whether the field is required or expected or optional, whether it is expected to be complete, whether it is expected to have a specific format, and what, if any, are the rules for the field (for example, the range for Fahrenheit temperature readings should be roughly -60 to +130 degrees).
•At a record level, there may be no connection to any master data, but the requirements might include whether the record has an identifier (for example, RFID, other sensor tag, or call numbers), whether the record is completed to a minimum extent, whether the values or relationships between the fields are consistent (for example, call data record must have both a calling and called number and they cannot be equal), and whether there are any other conditions that must be met.
Volume and velocity impact whether any subsequent levels are used or available, although aggregated patterns might potentially substitute to evaluate for duplication and consistency.
•Call data records might be delivered as sets similar to other transactional data. There might be headers and trailers to such sets or batches indicating the set or batch number (an identifier) and the period that is included. Records can be counted to confirm that the set is complete. Records can be assessed for uniqueness or duplication. Periods can be compared between the records and the set to ensure that the correct contents are included. Such sets can also be compared to the prior set, if available, to ensure that the contents were not duplicated from one interval to the next.
•Sensor data is more likely to enter as a stream of content rather than a batch, particularly if real-time analysis of and responses to sensor data are required. However, it is feasible to collect specific information from sensor content and then generate aggregate statistics at intervals for use in Information Quality assessment.
Machine and social media data often have additional metadata added and data contents of large unstructured text that is parsed into smaller domains. This gives them the characteristic of fields within records for subsequent processing.
•Requirements at a metadata or field level most likely indicate whether the field is expected or not because these sources can be highly variable, how it may be represented as complete, whether a given field conforms to a targeted format (or contains extraneous and unexpected content), and what, if any, are the rules for the field (for example, an error code, if present, should be in a given range; a geocode, if present, should conform to a standard latitude/longitude coordinate pattern).
•At a record level, the content is likely to be fairly unique, although it might follow the pattern of the given type of source, whether it is a log or social media feed. These sources are unlikely to have an internal identifier, but the requirements might indicate that a generated identifier should be added (for example, log name and date), whether the record is complete to an extent that makes it usable (for example, tags exists in the social media text), whether the values or relationships between the fields are consistent, and whether there are any other conditions that must be met.
As with other big data, the volume and velocity likely preclude developing sets beyond initial exploratory work, although new data patterns may become important for training algorithms that use and process the data. Correlations may be applied across multiple records as through they were sets or groups of sets through more advanced analytical tools. This processing is beyond the scope of this book.
For our purposes, the field and record level content of these big data sources can be evaluated along known Information Quality dimensions, taking their requirements into context.
Information Quality cleansing and transformation
Additional requirements might determine what should happen to these big data sources when the data does not satisfy the expected levels of Information Quality. A sensor reading of -200 °F is not valid or expected, but might indicate other issues with the sensor that must be handled, such as a repair or replacement of the sensor altogether. Another example is codes coming from call data sources that differ from those that are used within the organization. Beyond information validation, data might need to be variously filtered, mapped, transformed, standardized, deduplicated/linked/matched, consolidated, or aggregated, particularly to in-process data. These are all Information Quality techniques that serve to make the data usable for processes and downstream decision making. The application of these techniques can be validated as well, whether at the field, record, set, or grouped sets levels.
Filtering
With traditional data sources, all or most data is typically processed and subsequently stored. But with big data, there can be a much noise, which is extraneous information that is not required. Filtering is a basic technique to ignore or remove this extraneous content and process only that which is important. Filtering can occur on intake of data, or after particular steps are performed. Two primary filtering techniques are value-based selection and sampling.
With value-based selection, you assess a particular field or domain for specific content, such as a log date that is equal to today's date. Where the criteria are met, the data moves on to other steps. Where the criteria are not met, the data may be routed elsewhere or simply be ignored and dropped.
With sampling, you select an entire record using a sampling technique. This can be a specific interval, such as every 1000th record, or based on a randomized interval.
A third filtering technique is aggregation (see “Aggregation” on page 228), where detail records are summarized and only the summary records are processed.
Mapping and transformation
The most basic techniques of data cleansing are to change a format or map one value to another. A date field that is delivered as a string might need conversion to a specific date format. A code value of “A” might need to be changed to a code value of “1”. These mappings and transformations may also incorporate more complex processing logic across multiple fields. These techniques can be used to complete incomplete or missing data with default values.
A more complex transformation is a pivot of the data. In this case, data may be produced as an array of items or readings, but each item must be considered and processed individually.
Table 8-1 and Table 8-2 show some representative data before and after a horizontal pivot. Each Item is a field on a record in the first instance. The pivot converts each item, along with the other record data, into an individual and distinct record.
Table 8-1 Data before a pivot
|
OrderID
|
OrderDate
|
CustID
|
Name
|
Item1
|
Item2
|
Item3
|
|
123456
|
6-6-2013
|
ABCX
|
John Doe
|
notebook
|
monitor
|
keyboard
|
Table 8-2 Data after a horizontal pivot
|
PivotID
|
OrderID
|
OrderDate
|
CustID
|
Name
|
Item
|
|
1
|
123456
|
6-6-2013
|
ABCX
|
John Doe
|
notebook
|
|
2
|
123456
|
6-6-2013
|
ABCX
|
John Doe
|
monitor
|
|
3
|
123456
|
6-6-2013
|
ABCX
|
John Doe
|
keyboard
|
Data conditions typically requiring mapping and transformation include the following conditions:
•Lack of information standards
Identical information is entered differently across different information systems (for example, various phone, identifier, or date formats), particularly where the information source is outside the control of the organization, as with most big data. This makes the information look different and presents challenges when trying to analyze such information.
•Lack of consistent identifiers across different data
Disparate data sources often use their own proprietary identifiers. In addition, these sources may apply different data standards to their textual data fields and make it impossible to get a complete or consistent view across the data sources.
Standardization
Standardization is the process to normalize the data to defined standards. Standardization incorporates the ability to parse free-form data into single-domain data elements to create a consistent representation of the input data and to ensure that data values conform to an organizations standard representation.
The standardization process can be logically divided into a conditioning or preparation phase and then a standardization phase. Conditioning decomposes the input data to its lowest common denominators, based on specific data value occurrences. It then identifies and classifies the component data correctly in terms of its business meaning and value. Following the conditioning of the data, standardization then removes anomalies and standardizes spellings, abbreviations, punctuation, and logical structures (domains).
A traditional example is an address, such as “100 Main Street W, Suite 16C”. The variability in such data precludes easy comparison to other data or even validation of key components. A standardized version of this data can be what is shown in Table 8-3.
Table 8-3 Data after standardization
|
HouseNumber
|
Directional
|
StreetName
|
StreetType
|
UnitType
|
UnitNumber
|
|
100
|
W
|
Main
|
St
|
Ste
|
16C
|
Each component is parsed into specific metadata, which are unique fields that can be readily validated or used for additional processing. Further, data such as “Street” is conformed to a standard value of “St” (and “Suite” to “Ste”). Again, this facilitates validation and subsequent usage.
This approach is used to parse and work with machine data, such as log entries or social media text. Data conditions typically requiring standardization include the following ones:
•Lack of information standards.
Identical information is entered differently across different information systems (for example, various phone, identifier, or date formats), particularly where the information source is outside the control of the organization, as is the case with most big data. Where the domain is complex, standardization is a preferred and likely required technique versus mapping and transformation.
•Unexpected data in individual fields.
This situation describes a problem where data is placed in to the wrong data field or certain data fields are used for multiple purposes. For further data cleansing, the system must prepare the data to classify individual data entries into their specific data domains.
•Information is buried in free-form text fields.
Free-form text fields often carry valuable information or might be the only information source. To take advantage of such data for classification, enrichment, or analysis, it must be standardized first.
Deduplication, linking, and matching
Where mapping, transformation, and standardization focus on field level data cleansing, the processes of deduplication, linking, and matching focus on data cleansing at the record or set level. A simple example of deduplication is to identify records with the same keys or the same content across all fields. At the record level, this process can be a match to an existing data source to assess whether the record already is processed. At the set level, this process can be a comparison to all other records in the set or a match and comparison to a prior set of data.
With more free-form data, such as names and addresses, product descriptions, lengthy claim details, or call detail records with variable start and end times, such deduplication and matching becomes more complex and requires more than simple evaluation of character strings in one or more fields. Although mapping and standardization are used to reduce the complexity, aspects such as word order, spelling mistakes and variants, and overlapping date or value intervals require capabilities that use fuzzy logic and probabilistic record linkage technology.
Probabilistic record linkage is a statistical matching technique that evaluates each match field to take into account frequency distribution of the data, discriminating values, and data reliability, and to produce a score, or match weight, which precisely measures the content of the matching fields and then gauges the probability of a match or duplicate. The techniques can be used to both link data together or to exclude data from matching.
For big data, data conditions typically requiring deduplication, linkage, or matching include batched sets of data, including free-form text. Identical information might be received and processed repeatedly, particularly where the information source is outside the control of the organization. Where the information contains keys or time stamps, the comparisons might be straightforward by using deterministic matching. Where the information lacks keys, but contains multiple domains and fuzzy, variable, or unstructured content, then probabilistic matching is preferred. Social media tweets might be one example where filtering out duplicated information (for example, re-tweets) with unstructured text is wanted.
Consolidation
Consolidation (also called survivorship) creates a single representation of a record across multiple instances with the “best of breed” data. Consolidation works at the set level where more than one record is identified as similar or duplicated. The process of consolidation can be performed at:
•The field level
•The record level
•The logical domain level (that is, name, address, product, call data, and so forth)
•Any combination of these levels
For big data, data conditions typically requiring consolidation are the same as those requiring deduplication, linkage, or matching, and include batched sets of data, including free-form text. Identical information might be received and processed repeatedly, and consolidation of duplicate information is needed to filter out noise or redundancy that might skew subsequent analysis.
Aggregation
Aggregation generates summarized information of amounts/quantities, typically for a higher dimension than an individual record. Records are grouped by one or more characteristics. Aggregations may then be derived or calculated, including counts, sums, minimum/maximum/mean values, date intervals, and so on. Where aggregation is done on related, linked, or matched data, the summary might be done in tandem with a consolidation process. For example, you might group call data summaries both by day of the week and by month, and compute totals.
For big data, data conditions typically requiring aggregation include batched sets of data, whether entering as a batch or grouped through deduplication, linking, and matching. Sets of data must have aggregated summaries that are captured and stored for later use, whether for comparison, validation, or analysis.
IBM InfoSphere Information Server for Data Quality
Chapter 6, “Introduction to the IBM Big Data Platform” on page 97 touched on IBM InfoSphere Information Server as a cornerstone for cleansing, standardizing, linking, consolidating, and ultimately validating data. Together with the tools that handle big data in motion and big data at rest, the InfoSphere Information Server capabilities allow you to take advantage of several core information quality capabilities.
Filtering, mapping, standardization, and transformation
InfoSphere Information Server for Data Quality provides many techniques to filter, standardize, and transform data for appropriate and subsequent use. Figure 8-9 on page 229 highlights some of the range of standardization and transformation capabilities that can be brought together in simple or complex information integration processes.
Figure 8-9 Example capabilities to standardize and transform data in InfoSphere Information Server
For example, you can apply a Filter stage to select and pass on only certain types of data. Other filtering can be applied through database and file connection stages. With big data sources, you can add an InfoSphere Streams connector to filter high-volume real-time streams before loading them into a Data Warehouse for subsequent analysis.
With a Transformation stage you can trim data by removing leading and trailing spaces, concatenate data, perform operations on dates and times, perform mathematical operations, and apply conditional logic. These capabilities may be applied field-by-field or based on more complex conditions.
In a Standardization stage, you can cleanse and normalize many types of data, including names, email, product descriptions, or addresses. For example, the addresses 100 W. Main St and 100 West Main Street both become standardized to 100 W Main St. This capability is critical to ensure that dissimilar presentations of the same information are appropriately and consistently aligned in support downstream decisions.
Through these varied capabilities, you can collect, standardize, and consolidate data from a wide array of heterogeneous data sources and data structures and bring big data and traditional sources together, or compare current files to prior files to identify differences in data volumes (or missing data segments or ranges of data).
Deduplication and matching
With the IBM QualityStage® component of InfoSphere Information Server for Data Quality, you can use one- or two-source matching capabilities to identify duplicate records for entities such as individuals, companies, suppliers, products, or events. Matching uses a probabilistic record linkage system that identifies records that are likely to represent the same entity through a broad set of matching algorithms, including fuzzy logic, strict character comparison, interval matching (such as the overlap of start and end dates for multiple records), and geocoded distances.
Before matching can take place, a data analyst configures the specific match conditions through the QualityStage Match Designer user interface.
Survivorship and aggregation
InfoSphere Information Server for Data Quality provides the Survive stage to address consolidation of fields and records that are based on specific grouping characteristics. The Aggregator stage is used to generate summarized values, such as counts and other statistics.
Validation
Through InfoSphere Information Analyzer, a component of InfoSphere Information Server for Data Quality, you can apply a broad range of data validation rules. These data quality evaluations include checks for the following items:
•Completeness (existence of data)
•Conformance (correct structure of data)
•Validity (valid values, valid ranges, valid combinations of data, and validation versus reference sources)
•Uniqueness/Occurrence (frequency of data occurrence in a set)
•Operational calculations (arithmetic and aggregated comparisons)
•Pattern or String identification (occurrence of specific data instances)
Although such rules can be run in a stand-alone mode against data sources, particularly during exploratory phases of work, they can also be embedded directly into processes to evaluate data in motion. Figure 8-10 on page 231 shows a simple example of a Data Rule stage reading a big data source, evaluating for completeness in the data, and then separating the data that met the conditions (including source identifiers and correct dates) from the data that failed.

Figure 8-10 In-stream validation of data with InfoSphere Information Analyzer rules
By combining techniques for standardization and transformation, record matching, and data validation, many possible quality measures can be put together that meet the criteria for appropriately using big data, either by itself and in combination with traditional data sources, across the span of big data use cases.
Monitoring exceptions
The IBM InfoSphere Data Quality Console component of InfoSphere Information Server for Data Quality allows data stewards to coordinate monitoring of exceptions to the standardization, transformation, matching, and validation of data. Any data that is considered to be an exception can be routed and stored for review and potential remediation.
When exceptions arrive in the console, reviewers, review managers, and business stewards can browse the exceptions and assign an owner, priority, and status, as shown in Figure 8-11. To record status details and aid collaboration, they can add notes to an exception descriptor. They can also export the exception descriptors or exceptions to view outside the console or share with others.

Figure 8-11 Monitoring quality measures in the InfoSphere Data Quality Console
The InfoSphere Data Quality Console provides a unified view of information quality at a detailed exception level across products and components. As you identify problems with information quality, you can collaborate with other users to resolve the problems, whether through correction of data source or data issues, modification of data validation rules, or updates to critical big data processes.
Governing Information Quality
At the broader level, executives, line-of-business managers, and information governance officers must be aware of issues that might impact business decisions. The IBM InfoSphere Governance Dashboard provides a common browser-based view into the issues that are raised at lower levels and linked to relevant business policies and requirements. Figure 8-12 on page 233 shows one example of a selected set of information quality rules that are presented through the InfoSphere Governance Dashboard that is linked to their relevant policies.

Figure 8-12 Information quality trends that are viewed through the InfoSphere Governance Dashboard
Coming back to the principles of Information Governance, this stage is an intersection of people and process with the tools used to report information. The presentation of results in an InfoSphere Governance Dashboard does not drive changes to Information Quality in your big data. It merely reflects a current state that is based on the policies and rules that you have put in place. Some of these measures can be used to track progress over time, but the people responsible for Information Governance must make decisions about what data drives business decisions, what issues and considerations for veracity must be taken into account, what data must be corrected, and what data according to what rules must be monitored and tracked.
8.4.3 Governance and trust in big data
Ultimately, the capabilities of standardizing, validating, measuring, and monitoring information quality can ensure trust in big data only if these capabilities are used in a governed environment. The creation of a data governance body is an essential piece to oversee, monitor, and mitigate information quality issues. Data owners are critical to establishing the correct policies and requirements that impact business decisions. Data stewards play a crucial role in ensuring that the processes that are involved incorporate the correct information quality components to meet those policies and requirements and ensure ongoing success of the big data initiatives. Data scientists are key to understanding the data, how it can be optimally used to support the business requirements, and in laying out the foundation of how the data must be standardized and validated to meet the requirements on an ongoing basis. Data analysts establish, test, and evaluate the rules and processes that are needed to establish the veracity of big data. All these individuals must work together within the context of the broader Information Governance framework to ensure that the big data that is used meets the expectations and minimizes the risks of the organization.
1 Improving Data Warehouse and Business Information Quality by English, and Journey to Data Quality by Lee, et al.
5 Redefining risk for big data, found at: http://www.techrepublic.com/blog/big-data-analytics/redefining-risk-for-big-data/
6 IBM Accelerator for Machine Data Analytics, Part 1: Speeding up machine data analysis, found at: http://www.ibm.com/developerworks/data/library/techarticle/dm-1301machinedata1/
7 Ibid.
8 Query social media and structured data with InfoSphere BigInsights, found at: http://www.ibm.com/developerworks/data/library/techarticle/dm-1207querysocialmedia/
9 The Hidden Biases in Big Data, found at: http://blogs.hbr.org/2013/04/the-hidden-biases-in-big-data/
10 Ibid.
11 “Twitter is an online social networking and microblogging service that enables users to send and read “tweets”, which are text messages limited to 140 characters. Registered users can read and post tweets, but unregistered users can only read them.” http://en.wikipedia.org/wiki/Twitter
12 A Biased Map Of Every Global Protest In The Last 40+ Years, found at: http://www.fastcodesign.com/3016622/a-map-of-all-global-protests-of-the-last-40-years
13 Understanding InfoSphere BigInsights, found at: https://www.ibm.com/developerworks/data/library/techarticle/dm-1110biginsightsintro/
14 IBM Accelerator for Machine Data Analytics, Part 1: Speeding up machine data analysis, found at: http://www.ibm.com/developerworks/data/library/techarticle/dm-1301machinedata1/
15 Big Data Requires a Big, New Architecture, found at: http://www.forbes.com/sites/ciocentral/2011/07/21/big-data-requires-a-big-new-architecture/
..................Content has been hidden....................
You can't read the all page of ebook, please click here login for view all page.