CHAPTER 3
Hedge Fund Strategies
A BROAD RANGE OF STRATEGIES are operated under the hedge fund structure. This spectrum includes nonleveraged hedged styles and highly leveraged directional approaches.1
To comprehend these strategies, an investor must understand the different elements of investing of which they are composed. This knowledge builds a framework from which to compare the different approaches. Although some elements are not vastly different from those that constitute traditional investing methods, others are unique to hedge fund strategies. This chapter discusses five important groups of elements: tools and techniques, instruments and markets, performance, sources of return, and measures for controlling risk.
TOOLS AND TECHNIQUES
LEVERAGE
Leverage refers to taking on investment exposures that exceed the amount of assets managed. For example, a hedge fund with $100 million in assets might have $150 million in investments. This can be accomplished through borrowing funds to increase the amount invested in a particular position or through the use of derivatives. Investors use leverage with the belief that the return on the leveraged exposures will exceed the cost of the leverage. Investors who use leverage increase the risk of their investment; therefore, they usually try to use it where they perceive low-risk situations that can benefit from low-cost funding. Sometimes, managers use leverage to enable them to put on new, favorable positions without having to take off other positions prematurely. Managers who target very small price discrepancies or spreads will often use leverage to magnify the returns from these discrepancies.
SHORT SELLING
Short selling is selling a security that the manager does not own. The security is borrowed from another holder, such as a bank, an insurance company, or a major brokerage firm. To borrow the security, the fund manager needs some form of collateral, such as other equities or U.S. Treasury bills (T-bills). After borrowing the security, the manager immediately sells it on the open market with the intention of buying it back later at a lower price and returning it to the lender. Until that future date, the proceeds from the short sale usually earn interest in a money market account. If the price of the security sold short declines, then the short seller will realize profits equal to the difference between the price at which he sold the security and the price at which he buys it back, plus the interest earned on the short sale proceeds. Alternatively, if the price of the security sold short appreciates, then the manager will realize losses equal to the difference between the price at which she must buy the security and the price at which she sold it, less any interest earned on the short sale proceeds.
Different strategies use short selling in different fashions. Some use it as a trading technique from which to derive profits, and others use it as a hedge against market declines. Managers must always consider whether a security is available to sell short. The securities of larger, more liquid companies tend to be more readily available to sell short than those of smaller, less liquid entities.
HEDGING
Hedging is taking a secondary position with the express purpose of counterbalancing a known risk involved with a primary position. This can be accomplished by taking positions in specifically related securities for specific risks or by purchasing index options for market risks. These positions are taken to offset changes in economic conditions other than the core investment idea, such as a change in the overall level of stock market prices, a change in interest rates, or a change in foreign exchange rates. The basic hedging technique is to purchase a primary long position and a secondary short position in a similar security to offset the effect that any changes in the overall level of the financial market or sector will have on the long position. For example, if an investor’s rationale for buying a bond is that he thinks that the market has mispriced the credit risk of the issuing company, he would hedge against interest rate changes by buying a long position in the bond and a short position in a similar bond. If interest rates change, then any adverse effect on the long position will be offset by a positive effect on the short position. The process is reversed if a manager is trying to hedge against price increases. Alternatively, a manager can purchase index options to hedge movements in overall price levels. Hedging is a way in which an investor can neutralize the effects of systemic changes in market conditions.
ARBITRAGE
Arbitrage is the simultaneous purchase and sale of a related or similar security to profit from an expected change in the pricing relationship—for example, purchasing an undervalued convertible bond (a bond that can be converted to common stock, in which the conversion component is mispriced) and selling short the underlying common stock.
INVESTMENT INSTRUMENTS AND MARKETS
INSTRUMENTS
The assets that are available for purchase in financial markets are called investment instruments. These include stocks and bonds and all levels of financial derivatives. Derivatives are securities whose value is based on or is derived from the value of another instrument. For instance, the value of derivatives such as futures and options is based on the future value of a stock market index or the future value of Eurodollar deposits.
One way to distinguish different investment strategies is by the instruments in which they invest. Many hedge fund strategies invest in instruments avoided by traditional investment funds, such as futures; options; asset-backed securities; or the bonds, bank debt, or trade claims of companies with low credit ratings or in bankruptcy proceedings. Some hedge funds also invest in complex financial derivatives, such as interest-rate swaps, swaptions, and credit default swaps. These instruments allow for a larger degree of flexibility in hedging various risks than is available to traditional asset managers.
MARKETS
A market can refer to geography or asset classes. The grouping can be based on criteria such as an asset or instrument type (e.g., the stock market or the futures market), or on geographic location (e.g., Asian emerging market or Russian market). The term can be confusing because it is used on many different levels, but at base it refers to a mechanism by which investors and suppliers who are interested in a group of assets that share some underlying characteristic are brought together.
RISK CONTROL
Risk, quite simply, is exposure to uncertainty. There are two components of investment risk: uncertainty and exposure to that uncertainty. To control risk, managers must reduce uncertainty about future events and/or reduce the exposure of their portfolio to uncertainty about the future. Many of them will use hedging strategies to do so. Other common techniques follow.
RESEARCH
Research refers to the gathering, analysis, interpretation, and interpolation of information. Since markets act on information, a manager who obtains better or earlier information, or superior interpretation of it, has an edge on the market. Good research allows managers to take positions in instruments that are mispriced, in an absolute or relative sense, before the market reacts. The most common techniques for identifying such securities are in-depth fundamental and technical analysis.
DIVERSIFICATION
Diversification is the creation of variations in a portfolio through positions to reduce the adverse impact of a loss in any one position. Investment managers diversify their holdings to reduce exposure to risks associated with any one position, industry, sector, or type of instrument.
The logic of diversification can be implemented on many levels. Investment managers will diversify their holdings across industries, sectors, instruments, time horizons, and even investment styles.
POSITION LIMITS
Many investment managers limit the size of positions in their portfolios to restrain the damage that any individual position can cause. Position size may be based on a percentage of assets or on a specified maximum loss on each position. This ensures a certain level of diversification.
BUY/SELL TARGETS
Many investment managers perform their analyses relative to a market and estimate the value at which they think a security in which they have a position should be trading. Once it reaches that estimate, they liquidate the position because they believe the profit opportunity has run its course. Targets quantitatively articulate the investment disciplines imposed by the manager.
STOP-LOSS LIMITS
Many investment managers will not keep a security in their portfolio if it declines past a predetermined point. A stop-loss limit identifies the maximum loss a manager is willing to take on a position.
PERFORMANCE
The performance of hedge fund strategies is often presented and evaluated in terms of absolute return and risk-adjusted return. Unlike traditional investments that can be compared to, or benchmarked against, market indexes, most hedge fund strategies are not directly related to the direction of a specific market and therefore cannot be evaluated in that manner.
Increasingly, their performance is compared to indexes representing managers pursuing the same or a similar strategy.
HEDGE FUND STRATEGIES
The following paragraphs summarize the eleven hedge fund strategies covered in this book. In addition, this chapter includes charts that show how the amount of assets each strategy controls has changed from 1990 to 2004 in relation to the average annual returns of those funds. These graphs allow readers to note the relationship between assets controlled and fund performance. As might be expected, funds tend to follow performance. However, this is by no means a one-to-one relationship.
For example, there are presently more event-driven funds than there are macro funds, but the macro funds control about three times as many assets. When a strategy is producing high returns, not only are there ample investment profits that are increasing assets, but allocations from new investors will increase assets as well. New funds will be created to share in the profits and attract some of the new allocations. When the amount of assets allocated to a strategy increases, it is usually some combination of these factors. The process is reversed when a strategy is producing poor results.
FIXED-INCOME ARBITRAGE
Fixed-income strategies are “alternative” approaches to traditional, long-only fixed-income investments, and include arbitrage and opportunistic strategies. Arbitrage strategies involve investing in one or more fixed-income securities and hedging against underlying market risk by simultaneously investing in another fixed-income security. Managers seek to capture profit opportunities presented by what are usually small pricing anomalies, while maintaining minimum exposure to interest rates and other systemic market risks. In most cases, managers take offsetting long and short positions in similar fixed-income securities that are mathematically or historically interrelated when that relationship is temporarily distorted by market events, investor preferences, exogenous shocks to supply or demand, or structural features of the fixed-income market. These positions could include, for example, corporate debt, U.S. Treasury securities, U.S. agency debt, sovereign debt, municipal debt, or the sovereign debt of emerging markets countries. Trades often involve swaps and futures. Trading managers realize a profit when the skewed relationship between the securities returns to a normal range, or “converges.”
Managers often try to neutralize interest-rate changes and derive profit from their ability to identify similar securities that are mispriced relative to one another. Because the prices of fixed-income instruments are based on yield curves, volatility curves, expected cash flows, credit ratings, and special bond and option features, managers must use sophisticated analytical models to identify pricing disparities. The strategy often involves significant amounts of leverage. Opportunistic fixed-income strategies may be long or short in a variety of fixed-income instruments, essentially offering what a manager considers a “best of” the fixed-income markets.
FIGURE 3.1 shows how the returns and total assets of fixed-income arbitrage funds have changed from 1990 to 2004. The amount of assets under management grew as the number of fixed-income arbitrage funds grew. From 1996 to 2001, the amount of assets under management actually declined before increasing significantly from 2002 to 2004. Fixed-income arbitrage funds had their worst year, performance-wise, in 1998, showing relatively stable returns in the following years.
EQUITY MARKET-NEUTRAL (STATISTICAL ARBITRAGE)
Equity market-neutral strategies strive to generate consistent returns in both up and down markets by selecting equity positions with a total net portfolio exposure of zero. Managers hold a number of long equity positions and an equal, or close to equal, dollar amount of offsetting short positions for a total net exposure close to zero. A zero net exposure is referred to as dollar neutrality and is a common characteristic of all equity market-neutral managers. By taking long and short positions in equal amounts, the conservative equity-market-neutral managers seek to neutralize the effect that a systemic change will have on values of the stock market as a whole. Most, but not all, equity-market-neutral managers extend the concept of neutrality to risk factors or characteristics such as beta, industry, sector, investment style, and market capitalization. In all equity-market-neutral portfolios, stocks expected to outperform the market are held long, and stocks expected to underperform the market are sold short. Returns are derived from the long/short spread, or the amount by which long positions outperform short positions.
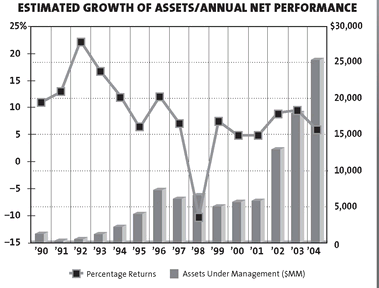
FIGURE 3.2 on the following page shows how the returns and total assets of equity-market-neutral funds changed from 1990 to 2004. Assets peaked in 2001 following strong performance in 2000, and from 2002 to 2004, performance was below the historical averages.
CONVERTIBLE ARBITRAGE
Convertible arbitrage involves taking a long security position and hedging market risk by taking offsetting positions, often in different securities of the same issuer. A manager may, in an effort to capitalize on relative pricing inefficiencies, purchase long positions in convertible securities, generally convertible bonds or warrants, and hedge a portion of the equity risk by selling short the underlying common stock. A manager may also seek to hedge interest-rate or credit exposure under some circumstances. For example, a manager can be long convertible bonds and short the underlying issuer’s equity, and may also use futures to hedge out interest-rate risk or credit default swaps to hedge default risk. Timing may be linked to a specific event relative to the underlying company, or a belief that a relative mispricing exists between the corresponding securities.

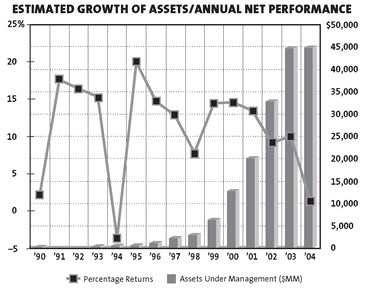
FIGURE 3.3 shows how the returns and total assets of convertible arbitrage funds changed from 1990 to 2004. This strategy has shown a significant growth in assets since 1999, though performance has declined, most notably in 2004.
MERGER (RISK) ARBITRAGE
Merger arbitrage, also sometimes known as risk arbitrage, involves investing in securities of companies that are the subject of some form of extraordinary corporate transaction, including acquisition or merger proposals, exchange offers, cash tender offers, leveraged buyouts, proxy contests, recapitalizations, restructurings, or other corporate reorganizations. These transactions generally involve the exchange of securities for cash, other securities, or a combination of cash and other securities. Typically, a manager might purchase the stock of a company being acquired or merging with another company and sell short the stock of the acquiring company. A manager engaged in merger arbitrage transactions derives profit (or loss) by realizing the price differential between the price of the securities purchased and the value ultimately realized from their disposition. The success of this strategy usually depends on the consummation of the proposed merger, tender offer, or exchange offer. Managers may use equity options as a low-risk alternative to the outright purchase or sale of common stock. In certain cases where the outcome of a merger is very doubtful, the manager may short the deal by reversing the positions and going short the target and long the acquiring firm.

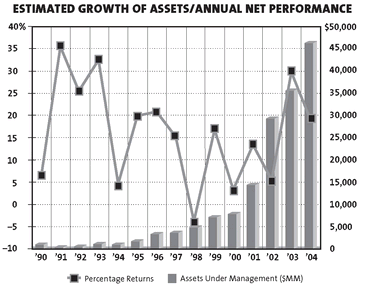
FIGURE 3.4 shows how the returns and total assets of merger arbitrage funds changed from 1990 to 2004. Assets under management spiked up during 2000 and 2001 followed by a sharp decline in returns due to the lack of merger activity and a scarcity of return opportunities.
DISTRESSED SECURITIES
Distressed securities managers invest in and may sell short the securities of companies in which the security’s price has been, or is expected to be, affected by a distressed situation. A distressed security may be defined as a security or other obligation of a company that is encountering significant financial or business difficulties, including companies that
1. may be engaged in debt restructuring or other capital transactions of a similar nature while outside the jurisdiction of federal bankruptcy law,
2. are subject to the provisions of federal bankruptcy law, or
3. are experiencing poor operating results due to unfavorable operating conditions, overleveraged capital structure, catastrophic events, extraordinary write-offs, or special competitive or product-obsolescence problems.
These managers seek profit opportunities arising from inefficiencies in the market for such securities and other obligations.
Negative events, and the subsequent announcement of a proposed restructuring or reorganization to address the problem, may create a severe market imbalance as some holders attempt to sell their positions at a time when few investors are willing to purchase the securities or other obligations of the troubled company. If a manager believes that a market imbalance exists and the securities and other obligations of the troubled company may be purchased at prices below their value, he may purchase them. Increasingly, distressed securities managers have looked to complement long positions with short positions in companies headed for financial distress. Profits in this sector result from the market’s lack of understanding of the true value of deeply discounted securities as well as mispricings within a distressed company’s capital structure.
FIGURE 3.5 on the following page shows how the returns and total assets of distressed securities funds changed from 1990 to 2004. Assets have increased steadily since 2000, coinciding with the increase in distressed opportunities and associated performance.
EVENT-DRIVEN STRATEGIES
Event-driven investment strategies, or “corporate life cycle investing,” are based on investments in opportunities created by significant transactional events, such as spin-offs, mergers and acquisitions, industry consolidations, liquidations, reor-ganizations, bankruptcies, recapitalizations, share buybacks, and other extraordinary corporate transactions. Event-driven trading involves attempting to predict the outcome of a particular transaction as well as the optimal time at which to commit capital to it. The uncertainty about the outcome of these events creates investment opportunities for managers who can correctly anticipate them. As such, event-driven trading embraces merger arbitrage, distressed securities, value with a catalyst, and special situations investing.
Some event-driven managers utilize a core strategy whereas others opportunistically make investments across the range when different types of events occur. Dedicated merger arbitrage and distressed securities managers should be seen as stand-alone options, whereas event-driven is a multistrategy approach. Instruments include long and short common and preferred stocks, as well as debt securities, warrants, stubs, and options. Managers may also utilize derivatives such as index put options or put option spreads to leverage returns and hedge out interest-rate and/or market risk. The success or failure of this type of strategy usually depends on whether the manager accurately predicts the outcome and timing of the transactional event. Event-driven managers do not rely on market direction for results; however, major market declines, which would cause transactions to be repriced or to break apart and risk premiums to be reevaluated, may have a negative impact on the strategy.
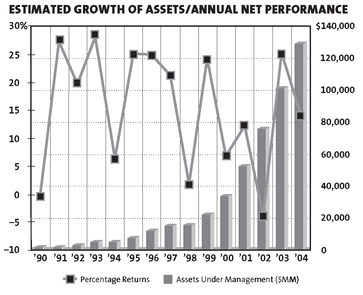
FIGURE 3.6 shows how the returns and total assets of event-driven funds changed from 1990 to 2004. Total assets under management grew steadily from 1999 to 2004. Although corporate activity associated with economic recovery drove return opportunities from 2003 to 2004, performance was choppy.
MACRO INVESTING
Macro strategies attempt to identify extreme price valuations in stock markets, fixed-income markets, interest rates, currencies, and commodities and make bets on the anticipated price movements in these markets, sometimes in a leveraged fashion. Trades may be designed as an outright directional bet on an asset class or geographical region (e.g., long Japanese equities), or be designed to take advantage of geographical imbalances within an asset class (e.g., German 10-years relative to U.S. 10-years). To identify extreme price valuations, managers generally employ a top-down global approach that concentrates on forecasting how global macroeconomic and political events affect the valuations of financial instruments. These approaches may be either systematic or discretionary.
The strategy has a broad investment mandate, with the ability to hold positions in practically any market with any instrument. In general, managers try to identify opportunities with a definable downside and favorable risk-reward characteristics. Profits are made by correctly anticipating price movements in global markets and having the flexibility to use any suitable investment approach to take advantage of extreme price valuations. Managers may use a focused approach or diversify across approaches. They often pursue a number of base strategies to augment their selective large directional bets.
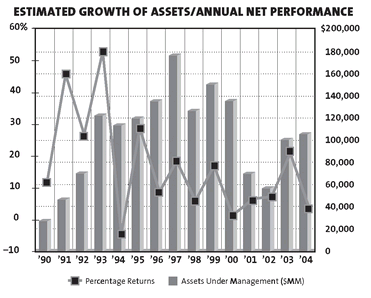
FIGURE 3.7 shows how the returns and total assets of macro funds changed from 1990 to 2004. Asset levels peaked in 1997 and bottomed in 2002 following a declining performance trend. That trend reversed in 2003, though performance for 2004 was well below historical averages.
SECTOR
Sector strategies combine core long holdings of equities with short sales of stock or sector indexes within a group of companies or segments of the economy that are similar either in what they produce or who their market is. Managers combine fundamental financial analysis with industry expertise to identify the best profit opportunities in the sector. Net exposure of sector portfolios may range anywhere from net long to net short depending on market and sector-specific conditions. Managers generally increase net long exposure in bull markets for the sector and decrease net long exposure, or may even be net short, in bear markets for the sector.
Generally, the short exposure is intended to generate an ongoing positive return in addition to acting as a hedge against a general sector decline. In a rising market for the sector, sector managers expect their long holdings to appreciate more than the sector and their short holdings to appreciate less than the sector. Similarly, in a declining market, they expect their short holdings to fall more rapidly than the sector falls and their long holdings to fall less rapidly than the sector. Profits are made when long positions appreciate and stocks sold short depreciate. Conversely, losses are incurred when long positions depreciate and/or the value of stocks sold short appreciates.
FIGURE 3.8 on the following page shows how the returns and total assets of sector funds changed from 1990 to 2004. There was substantial asset growth from 2000 to 2004, though performance followed the general equity markets into negative territory in 2001 and 2002, before recovering in 2003 and 2004.

EQUITY HEDGE
Equity hedge, also known as long/short equity, combines core long holdings of equities with short sales of stock, stock indexes, or derivatives related to equity markets. Net exposure of equity hedge portfolios may range anywhere from net long to net short, depending on market conditions. Managers generally increase net long exposure in bull markets and decrease net long exposure, or may even be net short, in bear markets. Generally, the short exposure is intended to generate an ongoing positive return in addition to acting as a hedge against a general stock market decline. Stock index put options or exchange-traded funds are also often used as a hedge against market risk.
In a rising market, equity hedge managers expect their long holdings to appreciate more than the market and their short holdings to appreciate less than the market. Similarly, in a declining market, they expect their short holdings to fall more rapidly than the market falls and their long holdings to fall less rapidly than the market. Profits are made when long positions appreciate and stocks sold short depreciate. Conversely, losses are incurred when long positions depreciate and/or the value of stocks sold short appreciates. The source of return of equity hedge is similar to that of traditional stock-picking trading strategies on the upside, but it uses short selling and hedging to attempt to outperform the market on the downside. Some equity hedge managers are value oriented, others are growth oriented, while a third category is opportunistic, depending on market conditions.
Equity nonhedge strategists use a strategy that is similar to traditional, long-only strategies but with the freedom to use varying amounts of leverage. Although most of them reserve the right to sell short, short sales are not an ongoing component of their investment portfolios, and many have not carried short positions at all. Equity nonhedge is treated as a variation of the equity hedge strategy. At heart, these are both concentrated stock-picking strategies, one that hedges market risk by augmenting core long positions with short positions and the other that forgoes that short exposure. The freedom to use leverage, take short positions, and hedge long positions is a strategic advantage that differentiates equity hedge strategists from traditional, long-only equity investors.
FIGURES 3.9 and 3.10 on the following page show how the returns and total assets of equity hedge and equity nonhedge funds changed from 1990 to 2004. Equity hedge fund assets have grown steadily since 1997 whereas equity nonhedge fund growth peaked in 1999 and declined through 2002. Performance for both peaked in 1999 and declined along with the general equity markets, bottoming in 2002. Note that in the recovery performance in 2003, equity nonhedge almost doubled the performance of equity hedge.
EMERGING MARKETS
Emerging markets strategies involve primarily long investments in the securities of companies in countries with developing, or emerging, financial markets. Managers make particular use of specialized knowledge and an on-the-ground presence in markets where financial information is often scarce. Such knowledge and presence creates an informational edge that allows them to take advantage of mispricings caused by emerging markets inefficiencies. They make profits by mining these markets for undervalued assets and purchasing them before the market corrects itself. Because of the less developed and less liquid nature of these markets, emerging markets securities are generally more volatile than securities traded in developed markets. Managers can be differentiated by country exposures and types of instruments used.


FIGURE 3.11 shows how the returns and total assets of emerging markets funds changed from 1990 to 2004. Assets managed by such funds has grown from a very small amount in 1990 to more than $30 billion at year-end 2004, reflecting the ever-increasing interest of managers and investors alike in the opportunities offered by newly created markets. Assets under management had a peak in 1998, the same year performance collapsed, although the strategy posted a powerful recovery in 1999. Performance was strong in 2003 and 2004 coinciding with AUM reaching a new high in 2004.
SHORT SELLING
Short selling strategies seek to profit from a decline in the value of stocks. The strategy involves selling a security the investor does not own in order to take advantage of a price decline the investor anticipates. Managers borrow the securities from a third party in order to deliver them to the purchaser. Managers eventually repurchase the securities on the open market in order to return them to the third-party lender. If the manager can repurchase the stock at a lower price than for what it was sold, a profit is made. In addition, managers earn interest on the cash proceeds from the short sale of a stock. If the price of the stock rises, then the manager incurs a loss. This strategy is seldom used as a stand-alone investment. But because of its negative correlation to the stock market, it tends to produce outsized returns in negative environments and can serve as “disaster insurance” in a multimanager allocation. Some managers may take on some long exposure but remain net short, or short biased. Short bias strategies are much less volatile than pure short selling exposure, but they do not provide as much upside in severely negative equity markets.
FIGURE 3.12 at right shows how the returns and total assets of short selling funds changed from 1990 to 2004. Asset levels more than tripled in 2002 following strong positive performance from 2000 to 2002. Assets under management reached a new high in 2004, even though the strategy posted negative returns in 2003 and 2004.
UNIVERSE OF HEDGE FUND STRATEGIES
Hedge fund managers sometimes speak of a universe of stocks or bonds that they consider for investment. The universe of hedge fund strategies described in this book will give investors insight into the majority of investment approaches practiced by hedge fund managers. Although some strategies have been omitted, the eleven covered in this book now account for about 90 percent of all hedge fund assets. To be fair to the hedge fund managers, each one has a unique approach. However, this book places the methodologies in categories, focusing on their similarities. Funds that do not fit formally into these categories are most likely using similar investing principles. In the future, new approaches will inevitably be created that combine elements of investing in ways not corresponding to the categories discussed here. In fact, new strategies are added every year. However, the universe of hedge fund strategies covered in this book gives investors a useful point of reference for considering present and future investment approaches used by hedge fund managers.

FIGURES 3.13 and 3.14 on the following page show the percentage of total hedge fund assets (AUM) controlled by each of the strategies at the end of 1990 and again at the end of 2004. The graphs clearly illustrate the changes that have taken place in the industry. All the strategies grew in assets in the 1990s, but some grew faster than others. In addition, some strategies started with far fewer assets. For example, macro strategies have grown in assets but at the same time have lost overall market share, declining from the majority of assets in the industry to 11 percent. Niche and specialist strategies have gained ground as a percentage of overall industry assets. Today, equity hedge funds represent the largest percentage of industry assets. These changes cannot be attributed to any single factor, but reflect a trend toward more specialization and less aggressive returns. The strategy weightings will continue to change in response to the changing opportunities that the market offers and the shifting makeup of the investor base. There are two key points to observe: First, that the hedge fund industry is comprised of a variety of investment strategies. Second, the industry is dynamic, not static. Strategies, as well as the assets within strategies, change based on performance and opportunity and so the overall composition of the industry shifts over time.


RISK-REWARD SPECTRUM
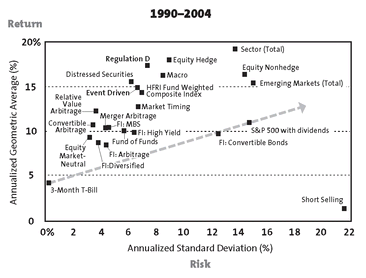
The various hedge fund strategies have very different risk-reward characteristics and should be evaluated individually rather than in a group. Hedge funds are heterogeneous, which explains why it’s important to categorize them by the core strategy that the fund manager uses. Some hedge fund strategies are aggressive in nature, such as macro funds. Others, such as nonleveraged market-neutral funds, are conservative. Many have significantly lower risk than a portfolio of long stocks and bonds for the same levels of return. Overall, hedge fund strategies, except for short selling, have performed well on a risk-adjusted basis at all points on the risk-reward spectrum. FIGURE 3.15 on the following page plots the average annualized return of each strategy against its annualized standard deviation. The risk-reward profiles of T-bills and the S&P 500 index of blue-chip stocks provide a basis of comparison. The capital market line drawn through the T-bills and the S&P 500 represents a rough estimate of the expected trade-off between risk and return for traditional investments. Notice that the risk-reward profile of every hedge fund strategy except short selling is above the line. Keep this spectrum in mind as you read the different strategy chapters. Think of how it reflects the market environment since 1990, and how it might change when market conditions shift.
Each of the strategy chapters discusses the core strategy principles, the investment process, the advantages and disadvantages of the strategy, and its performance since 1990. The short version of the strategy is reprinted at the beginning of each chapter to introduce the most important elements to look for in the chapter. For those readers looking strictly for numbers, the performance section includes month-by-month and summary statistics for each strategy. The most important concepts from the chapter are highlighted in the Summary Points section that follows the performance statistics. Finally, key words and concepts in bold type are defined in the Key Terms section at the end of each chapter.
..................Content has been hidden....................
You can't read the all page of ebook, please click here login for view all page.
