Employee separations (often called turnover) occur when an employee permanently leaves an organization. Consider that from January 2004 to January 2005, 18 percent of American workers voluntarily quit their jobs. That figure varies widely by industry, however, with relatively low rates in manufacturing and transportation (roughly 15 percent), and relatively high rates in leisure and hospitality, retail, and construction industries (ranging from about 25 percent to 45 percent).[1] To appreciate what that means for an individual firm, consider that at the end of 2005, Wal-Mart employed 1,800,000 people worldwide.[2] Its annual employee turnover rate is 44 percent—close to the retail industry average.[3] Each year, therefore, Wal-Mart must recruit, hire, and train more than 790,000 new employees just to replace those who left!
Is this level of turnover good or bad for Wal-Mart? It is a safe bet that just processing and managing this level of employee turnover costs millions of dollars per year, but then Wal-Mart’s annual after-tax profits were $11.2 billion in 2006.[4] So, the cost of turnover for Wal-Mart is a big number, but not a large percentage of its profits. Although Wal-Mart could likely save millions of dollars a year by reducing turnover, what would be the investment necessary to do that? Also, if turnover was reduced by hiring employees who have fewer alternative employment options (and thus are less likely to leave), might that also mean getting employees who are less qualified or who have lower performance? Long-term employees also amass increased obligations in terms of pension and health-care coverage, so it is possible that Wal-Mart saves money in these areas if its work force has shorter tenure.
On the other hand, perhaps the short tenure of the work force reduces learning and customer-service skills that would enhance Wal-Mart’s performance. These are complex questions that are often overlooked when organizations adopt simple decision rules, such as “reduce all turnover to below the industry average.” In this chapter, we provide frameworks to make such questions more tractable, and thus improve the ways organizations manage this important aspect of their talent resource.
Employee turnover is often measured by how many employees leave an organization. A more precise definition is that turnover includes replacing the departed employee (hence the idea of “turning over” one employee for another). So, we will distinguish employee separations from the employee acquisitions that replace the separated employees. Employee separations and acquisitions are “external movements,” meaning that they involves moving across the organization’s external boundary. (We will discuss movements inside the organization later.)
External movements define situations that include pure growth (acquisitions only), pure reduction (separations only), and all combinations of growth and reduction, including steady state, where the number of acquisitions equals the number of separations.[5] Employee “turnover” (where each separation is replaced by an acquisition) is one common and important combination, but the frameworks discussed here are helpful when managing any combination of external employee movements. We find it is also very helpful to distinguish employee separations from employee acquisitions, although the term turnover usually refers to separations that are replaced.
Decisions affecting employee movement reflect three basic parameters:
The quantity of movers
The quality of movers (that is, the strategic value of their performance)
The costs incurred to produce the movement (that is, the costs of acquisitions or separations)
Decisions affecting the acquisition of new employees (that is, selection decisions) require consideration of the quantity, quality, and cost of those acquisitions. Likewise, decisions affecting the separation of employees (that is, layoffs, retirements, employee turnover) require consideration of the quantity, quality, and cost to produce the separations.
The important points to remember are that the results of decisions that affect acquisitions or separations are expressed through quantity, quality, and cost. Second, the consequences of these decisions often depend on the interaction between the effects of acquisitions and separations. Figure 4-1 shows these ideas graphically.
In each period, two processes can change work force value: Employees are added, and employees separate. As time goes on, these same two processes continue, with the beginning work force value in the new time period being the ending work force value from the last time period.
To provide a more complete decision-making framework, Boudreau and Berger developed mathematical formulas to express the overall payoff (utility) or net benefits, of work force acquisitions and separations,[6] and we have more to say about that in Chapter 10, “The Payoff from Enhanced Selection.” This chapter focuses on identifying and quantifying the transaction costs associated with external employee separations and the transaction costs of the acquisitions to replace those who left (including the activities to acquire them as well as to train them).
Two popular ways of classifying employee turnover are voluntary versus involuntary and functional versus dysfunctional. We discuss these distinctions next. Then, consistent with the LAMP framework that was introduced in Chapter 1, “Making HR Measurement Strategic,” we discuss the analytics, measurement, and processes involved in computing, interpreting, and communicating the actual costs of employee turnover.
Turnover may be voluntary on the part of the employee (for example, resignation) or involuntary (for example, requested resignation, permanent layoff, retirement, death). Voluntary reasons for leaving—such as another job that offers more responsibility, returning to school full time, or improved salary and benefits—are more controllable than involuntary reasons, such as employee death, chronic illness, or spouse transfer. Most organizations focus on the incidence of voluntary employee turnover precisely because it is more controllable than involuntary turnover. They are also interested in calculating the costs of voluntary turnover, because when these costs are known, an organization can begin to focus attention on reducing them, particularly where such costs have significant strategic effects.
Having categorized employee turnover as voluntary or involuntary, many organizations take the next logical step; namely, to determine the extent to which the voluntary turnover is functional or dysfunctional for the organization. Employee turnover is functional to the extent that the employee’s departure produces increased value for the organization. It is dysfunctional to the extent that the employee’s departure produces reduced value for the organization. Figure 4-2 illustrates this dichotomy.
High performers who are difficult to replace represent dysfunctional turnovers, and low performers who are easy to replace represent functional turnovers.[7] In terms of Figure 4-1, turnover is functional when the resulting difference in work force value is positive, and high enough to offset the costs of transacting the turnover. Turnover is dysfunctional when the resulting difference in work force value is negative, or the positive change in work force value doesn’t offset the costs. Replaceability, or the difficulty of replacement, as shown in Figure 4-2, is not inconsistent with this idea, but it is a lot less precise. Does it mean that replacements will be of lower value than the person who left, or that they will be of higher value, but very costly?
The logic of Figure 4-1, although consistent with that shown in Figure 4-2, is superior because it is more precise. We therefore recommend that readers not use the typology shown in Figure 4-2, but rather think more precisely, using the logic of Figure 4-1.
Performance, of course, has many aspects associated with it. Some mistakes in selection are unavoidable, and to the extent that employee turnover is concentrated among those whose abilities and temperaments do not fit the organization’s needs, that is functional for the organization and good for the long-term prospects of individuals, too. Other employees may have burned out, reached a plateau of substandard performance, or developed such negative attitudes toward the organization that their continued presence is likely to have harmful effects on the motivation and productivity of their coworkers. Here again, turnover can be beneficial, assuming, of course, that replacements add more value than those they replaced.
On the flip side, the loss of hard-working, value-adding contributors is usually not good for the organization. Such high performers often have a deep reservoir of firm-specific knowledge and unique and valuable personal characteristics, such as technical and interpersonal skills. It is unlikely that a new employee would have all of these characteristics, and very likely that he or she would take a long time to develop them. Thus, voluntary turnover among these individuals, and replacing them with others, is very likely to reduce the value of the work force and to produce costs associated with their separation and replacement. Voluntary turnover is even more dysfunctional, however, when it occurs in talent pools that are pivotal to an organization’s ability to be successful.
Just as companies divide customers into segments, so also might they divide talent pools into segments that are pivotal versus nonpivotal. Pivotal talent pools are those where a small change makes a big difference to strategy and value. Instead of asking “What talent is important?,” the impact question becomes “Where do changes in the quantity or quality of talent make the biggest difference in strategically important outcomes?” For example, where salespeople have lots of discretion in their dealings with customers, and those dealings have big effects on sales, the difference in performance between an average and a superior salesperson is very large. It’s also likely that replacements will be lower performers because the skills needed to execute sales are learned on the job; as a result, there is a substantial reduction in work force value when a high-performer leaves and is replaced by a new recruit.
On the other hand, in some jobs, performance differences are smaller, such as a retail food-service job where there are pictures rather than numbers on the cash register and where meals are generally sold by numbers, not by individualized orders. Here, the value produced by high performers is much more similar to the value of average performers. The job is also designed so that replacement workers can learn it quickly and perform at an acceptable level. So in this job, voluntary turnover among high performers, who are replaced by average performers, does not produce such a large change in work force value. If the costs of processing departures and acquisitions are low, it may be appropriate not to invest in reducing such turnover.
We noted earlier that many analysts and companies refine an overall measure of employee turnover by classifying it as controllable or voluntary (an employee leaves of his or her own choice), or uncontrollable or involuntary (for example, retirement, death, dismissal, layoff). After pivotal pools of talent have been identified, it becomes important to measure their voluntary employee-turnover rates, to assess the cost of that voluntary turnover, to understand why employees are leaving, and to take steps to reduce voluntary, controllable turnover. Turnover rates in pivotal talent pools need not be high to be extremely costly, as the previous sales example illustrates. The next section shows how to compute them.
Conceptually, annual employee turnover is computed by adding up the monthly turnover for a 12-month period. Monthly turnover is calculated as the number of employee separations during the month divided by the average number of active employees during the same month. More generally, the rate of turnover in percent over any period can be calculated by the following formula:
In the United States, for example, aggregate monthly turnover rates average about 1 percent, or 12 percent per year.[8] The turnover rate in any given year can be misleading, however, because turnover rates are inversely related to unemployment rates (local, regional, national). That is, when unemployment is high, employees tend to remain with their current employers because there are limited opportunities elsewhere. On the other hand, when unemployment is low, employment opportunities are more plentiful, and thus, employee turnover tends to increase. Over a 31-year period, for example, one study reported a correlation of –0.84 between unemployment and voluntary employee turnover.[9]
Typically, organizations compute turnover rates by business unit, division, diversity category, or tenure with the company. Then they attempt to benchmark those turnover rates against other organizations to gauge whether their rates are higher, lower, or roughly the same as those of competitors or their own industries. Many HR information systems allow managers to “drill down” on turnover rates in a vast number of ways. Indeed, there are probably hundreds of different turnover rates that might be calculated, tracked, and put into various scorecards. When it comes to employee turnover, however, it is not always the case that “lower is better.” In the extreme, if employee turnover is zero, the organization may have employees who are of such low quality that they don’t have alternatives, or the organization may be losing the benefit of the new ideas that outsiders might contribute. In fact, employee turnover has very different cost and performance implications, depending on strategic and business contexts.
Turnover can represent a substantial cost of doing business. Indeed, the fully loaded cost of turnover—not just separation and replacement costs, but also the exiting employee’s lost leads and contacts, the new employee’s depressed productivity while he or she is learning, and the time coworkers spend guiding him or her—can easily cost 150 percent or more of the departing person’s salary.[10] Merck & Company, the pharmaceutical giant, found that, depending on the job, turnover costs 1.5 to 2.5 times the annual salary paid for it.[11] At Ernst & Young, the cost to fill a position vacated by a young auditor averages 150 percent of the departing employee’s annual salary.[12] These results compare quite closely to those reported in the Journal of Accountancy, namely, that the cost of turnover per person ranges from 93 percent to 200 percent of an exiting employee’s salary, depending on the employee’s skill and level of responsibility.[13] Finally, a study of a chain of sushi restaurants in Singapore found that the cost of turnover among restaurant employees (excluding managers) can be more than 75 percent of an employee’s annual salary.[14]
Unfortunately many organizations are unaware of the actual cost of turnover. Unless this cost is known, management may be unaware of the financial implications of turnover rates, especially among pivotal talent pools. Management also may be unaware of the need for action to prevent controllable turnover, and may not develop a basis for choosing among alternative programs designed to reduce turnover.
Organizations need a practical procedure for measuring and analyzing the costs of employee turnover, especially because the costs of hiring, training, and developing employees are now viewed as investments that must be evaluated just like other corporate resources. The objective in costing human resources is not only to measure the relevant costs, but also to develop methods and programs to reduce the more controllable aspects of these costs. Analytics and sound measurement strategies can help address these important issues.
Analytics addresses the following issue: Can we create a design and analyses that will answer the questions we want to pose? Although computation of turnover rates by various subcategories of employees or business units is instructive, our main focus in this chapter is on the financial implications associated with turnover. We use the term analytics to refer to formulas (for example, for turnover rates), research designs, and analyses. We use the term measures to refer to the techniques for actually gathering information; that is, for populating the formulas with relevant numbers. In the following sections, therefore, we develop procedures for identifying and measuring turnover costs. You will see both formulas and examples that include numbers in those formulas. As you work through this information, keep in mind the distinction between analytics and measures.
The general procedure for identifying and measuring turnover costs is founded on the premise that in measuring turnover, the organization must consider three major, separate cost categories: separation costs, replacement costs, and training costs.[15] In addition, it also must consider the difference in dollar-valued performance between leavers and their replacements. Finally, the fully loaded cost of turnover should include the economic value of lost business, to the extent that this is possible.[16] Notice how these elements precisely mirror the categories in Figure 4-1. There are costs of the transactions required to complete the separation of the former employee, and also of the acquisition and the training of the replacement. The difference in performance between stayers and leavers is part of the change in work force value, and the business that is lost with the leaver is also part of the change in work force value.
For each of these categories, we first present the relevant cost elements and formulas (analytics), and then provide numeric examples to illustrate how the formulas are used (measures). The “pay rates” referred to in each category of costs refer to “fully loaded” compensation costs (that is, direct pay plus the cost of benefits).
Figure 4-3 presents the key cost elements, together with appropriate formulas for each, that apply to separation costs. These include exit interviews (S1); administrative functions related to termination, such as deletion of the exiting employee from payroll, employment, and benefits files (S2); separation pay, if any (S3); and unemployment tax, if applicable (S4). Thus:
Total separation costs (ST) = S1 + S2 + S3 + S4 |
The cost of exit interviews is composed of two factors, the cost of the interviewer’s time (preparation plus actual interview time) and the cost of the terminating employee’s time (time required for the interview x weighted average pay rate for all terminated employees). This latter figure may be calculated as follows:
Times for exit interviews may be estimated in one of two ways (because this information is not recorded routinely):
Time a random sample of exit interviews over the course of some period (for instance, three months).
Interview a representative sample of managers who conduct exit interviews regularly and develop an average or weighted average of their estimated times.
Each organization should specify exactly what administrative functions relate to terminations and the time required for them. Each of those activities costs money, and the costs should be documented and included when measuring separation costs.
Separation pay, for those organizations that offer this benefit (it is not legally required in the United States under the Fair Labor Standards Act), can usually be determined from the existing accounting information system. Length of service, organization level, and the cause of termination are key factors that affect the amount of severance pay. Termination for poor performance generally does not include a severance package. Most lower-level employees receive one or two weeks of pay for each year they worked up to a maximum of about 12 weeks. Mid-level managers typically receive anywhere from three to six months of pay; higher-level executives, six months to one year of pay; and chief executive officers with employment contracts two to three years of salary.[17] Fully 88 percent of organizations now require a signed release in exchange for payment, whether in a lump sum or through salary continuation. Medical benefits typically continue throughout the severance period.[18]
Among organizations that do business in the United States, unemployment tax is a relevant concern. For those doing business elsewhere, it is not, and this item should not be considered in the tally of separation costs. United States employers’ unemployment tax rates (usually applied to the first $7,000 of each employee’s earnings) are based on each employer’s history of claims. Organizations with fewer claims for unemployment benefits are subject to a lower unemployment tax than organizations with more unemployment claims. This increase in unemployment tax due to an increased incidence of claims is an element of separation costs.
In practice, high turnover rates that lead to high claims for unemployment compensation by former employees increase the cost of unemployment tax in two ways. First, the state increases the employer’s tax rate (called the “penalty” in this instance). Second, the employer must pay additional, regular unemployment tax because of the turnovers. For example, consider a 100-employee firm with a 20 percent annual turnover rate (that is, 20 people). The total increase in unemployment tax is computed as follows:
The penalty:
(New tax rate minus base rate) × [$7,000 × (100 + 20)] |
= (5.4%—5.0%) × [$840,000] = $3,360 |
Additional unemployment tax due to turnover:
(New tax rate) × ($7,000 × Number of turnovers during period) = (5.4%) × ($7,000 × 20) = $7,560 |
Total additional unemployment tax due to turnover:
$3,360 + $7,560 = $10,920 |
What about the incremental costs associated with social security taxes? These costs should be included only if the earnings of those who leave exceed the taxable wage base for the year. Thus, in 2006, the taxable wage base was $94,200, and the tax rate was 7.65 percent. If an employee, for example, earning $60,000 per year, leaves after six months, the employer pays tax only on $30,000. If it takes one month to replace the departing employee, the replacement earns five months’ wages or $25,000. Thus, the employer incurs no additional social security tax because the total paid for the position for the year is less than $94,200. However, if the employee who left after six months was a senior manager earning $200,000 per year, the employer would already have paid the maximum tax due for the year for that employee. If a replacement works five months (earning $83,333), the employer then incurs additional social security tax for the replacement.
A final element of separation costs that should be included, if possible, is the cost of decreased productivity due to employee terminations. This may include the decline in the productivity of an employee prior to termination or the decrease in productivity of a work group of which the terminating employee was a member. With respect to the effect on productivity as a result of downsizing, evidence to date is mixed. The American Management Association surveyed 700 companies that had downsized in the 1990s. In 34 percent of the cases, productivity rose, but it fell in 30 percent of them.[19] One thing we do know, however, is that firms whose training budgets increase following a downsizing are more likely to realize improved productivity.[20]
Let us now illustrate the computation of separation costs over one year for Wee Care Children’s Hospital, a 200-bed facility that employs 1,200 people. Let’s assume that Wee Care’s monthly turnover rate is 2 percent. This represents 24 percent of the 1,200-person work force per year, or about 288 employees. From Figure 4-3, we apply the following formulas (all costs are hypothetical):
Exit Interview (S1)
Interviewer’s time = (15 min. preparation + 45 min. interview) × $30/hour interviewer’s pay + benefits × 288 turnovers during the year
= $8,640 |
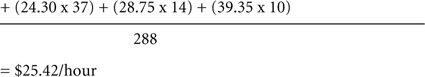
Terminating employee’s time = 45 min. interview time × $25.42/hour weighted average pay + benefits[21] × 288 turnovers during the year
= $7,320.96 |
Total cost of exit interviews = $8,640 + $7,320.96
= $15,960.96 |
Administrative Functions (S2)
S2 = Time to delete each employee × HR specialist’s pay + Benefits/hour × Number of turnovers during the year
= 1 hour × $30 × 288 |
= $8,640 |
Separation Pay (S3)
Suppose Wee Care Children’s Hospital has a policy of paying one week’s separation pay to each terminating employee. Using the weighted average pay rate of the 288 terminating employees as an example, $25.42/hour × 40 hours/week = $1,016.80 average amount of separation pay per employee terminated.
Total Separation Pay | = $1,016.80 × 288 |
= $292,838.40 |
Unemployment Tax (S4)
Let us assume that because of Wee Care’s poor experience factor with respect to terminated employees’ subsequent claims for unemployment benefits, the state unemployment tax rate is 5.4 percent, as compared with a base rate of 5.0 percent. Let us further assume that turnovers occur, on the average, after four and a half months (18 weeks). If the weighted average pay + benefits of terminating employees is $25.42 per hour, and Wee Care pays an average of 35 percent of base pay in benefits, the weighted average pay alone is $16.52 per hour ($25.42 minus 35 percent). Over 18 weeks, the direct pay per terminating employee exceeds $7,000.
The dollar increase in unemployment tax incurred because of Wee Care’s poor experience factor is therefore as follows:
(5.4% – 5.0%) × [$7,000 × (1,200 + 288)] |
= (0.004) × [$7,000 × 1,488] |
= $41,664{Penalty} + (5.4%) × ($7,000 × 288) |
= $108,864 {Additional tax} |
Total increase = $41,664 + $108,864 |
= $150,528 |
Now that we have computed all four cost elements in the separation-cost category, total separation costs (Σ S1, S2, S3, S4) can be estimated. This figure is as follows:
ST = S1 + S2 + S3 + S4 |
= $15,960.96 + $8,640 + $292,838.40 + $150,528 |
= $467,967.36 |
As shown in Figure 4-1, employees who replace those who leave are acquisitions. The overall value, or payoff, of those acquisitions depends on three parameters—their quantity, quality, and cost. Replacement costs, as described in the following paragraphs, reflect only the quantity and cost of acquisitions, not their quality. We address the issue of staffing quality beginning in Chapter 8, “Staffing Utility: The Concept and Its Measurement.”
Replacement costs are incurred by an organization when it replaces a terminated employee. Figure 4-4 shows the cost elements and the formulas for estimating them. As the exhibit indicates, there are eight categories of replacement costs:
Communication of job availability
Pre-employment administrative functions
Entrance interviews
Testing
Staff meetings
Travel/moving expenses
Post-employment acquisition and dissemination of information
Employment medical exams
The costs of communicating job availability will vary by type of job and targeted labor market. Depending on the methods used in recruitment, these costs may range from the cost of a classified advertisement in a local newspaper to employment-agency fees borne by the employer.[22] Typically, these costs can be obtained from existing accounting records. However, to the extent that this communication process requires considerable time from HR department employees, the cost of their time should also be included in replacement costs.
Administratively, several tasks are frequently undertaken in selecting and placing each new employee—for example, accepting applications, screening candidates, and checking references. These procedures can be expensive. For example, a simple background investigation that includes verification of last educational degree, a check with the last two employers, a five-year criminal check, and verification of the social security number costs only about $100. However, an extensive check that includes the previous items plus interviews with previous employers, teachers, neighbors, and acquaintances can run $15,000 or more. Unfortunately, the time required to perform these activities is not documented routinely by organizational information systems. However, the methods described earlier for estimating exit-interview time requirements may be applied in determining the time necessary for pre-employment administrative functions.
Virtually all organizations use entrance interviews to describe jobs, to communicate employee responsibilities and benefits, and to make some general assessments of candidates. The costs incurred when completing entrance interviews are a function of the length of the interview, pay rates of interviewers involved, and the number of interviews conducted. Clearly links exist between valid staffing procedures and reduced turnover. If decision makers are to be able to make sound cost/benefit decisions regarding elements of the selection process, these costs (and benefits) must be documented. This chapter focuses on costs; Chapter 10 refers to these costs, and, in addition, details the benefits to be derived from the use of valid staffing procedures.
Many firms use pre-employment testing of one sort or another—for example, aptitude, achievement, drug, and honesty testing. To account properly for the costs of these activities, consider the costs of materials and supplies and the cost of scoring the tests. The costs of materials and scoring for aptitude, achievement, and honesty tests are often less than $25 per candidate. Drug testing costs roughly $45 to $65 for a simple screening test,[23] but confirming a positive test with more accurate equipment—a step recommended by most specialists—costs an additional $50 to $75.
For some classes of employees, especially top-level managers or other professionals, a meeting may be held between the HR department and the department holding the vacant position. The estimated time required for this meeting, multiplied by the sum of the pay and benefits rates for all attendees, provides a measure of this element of replacement costs. Travel and moving expenses can be extremely costly to organizations that pay these costs. Travel costs for candidates from a local labor market are minimal (carfare, parking, tolls), but travel costs for candidates who must fly in and stay in a hotel can average more than $1,500. Moving expenses can cover a range of cost elements from mortgage differentials, lease-breaking expenses, company purchase of the old house, costs of moving personal effects from the old to the new location, closing costs, hook-up fees for utilities, and more. “Fully loaded” moving costs for middle managers average about $45,000 to $50,000, whereas a complete relocation package for executives averages about $70,000 per move.[24]
The seventh category of replacement costs is post-employment acquisition and dissemination of information. Pertinent information for each new employee must be gathered, recorded, and entered into various subsystems of an HR information system (for example, employee records, payroll files, benefits records). If flexible, cafeteria-style benefits are offered by an organization, an HR specialist could spend considerable time in counseling each new employee. Managers must estimate the time required for this overall process for each replaced employee, and then multiply it by the wage rates of HR department employees involved. To compute the total cost of acquiring and disseminating information to new employees, multiply this cost by the number of turnovers.
Pre-employment medical examinations are the final element of replacement costs. The extent and thoroughness, and therefore the cost, of such examinations varies greatly Some organizations do not require them at all, some contract with private physicians or clinics to provide this service, and others use in-house medical staff. If medical examinations are contracted out, the cost can be determined from existing accounting data. If the exams are done in-house, their cost can be determined based on the supplies used (for example, x-ray film, laboratory supplies) and the staff time required to perform each examination. If the new employee is paid while receiving the medical examination, his or her rate of pay should be added to the examiner’s pay rate in determining total cost. The following example estimates replacement costs for a one-year period based on Figure 4-4 for Wee Care Children’s Hospital.
Assume that fees and advertisements average $350 per turnover, that 3 more hours are required to communicate job availability, that the HR specialist’s pay and benefits total $30 per hour, and that 288 turnovers are replaced during the period. Therefore:
R1 | = [$350 + (3 × $30)] × 288 |
= $126,720 |
Assume that pre-employment administrative functions to fill the job of each employee who left comprise five hours. Therefore:
R2 | = 5 × $30 × 288 |
= $43,200 |
Assume that, on the average, three candidates are interviewed for every one hired. Thus, over the one-year period of this study, 864 (288 x 3) interviews were conducted. Therefore:
R3 | = 1 × $30 × 864 |
= $25,920 |
Assume that aptitude tests cost $12 per applicant for materials, another $12 per applicant to score, and that as a matter of HR policy, Wee Care uses drug tests ($45 per applicant) as part of the pre-employment process. The cost of testing is therefore as follows:
R4 | = ($24 + $45) × (288 × 3) |
= $59,616 |
Assume that each staff meeting lasts one hour, that the average pay plus benefits of the new employee’s department representative is $42, and that for administrative convenience such meetings are held, on average, only once for each three new hires (288 / 3 = 96). Therefore:
R5 | = ($30 + $42) × 96 |
= $6,912 |
Assume that Wee Care pays an average of $95 per applicant in travel expenses, and that moving expenses of $50,000 are incurred, on average, for only one of every eight new hires. Therefore:
R6 | = [$95 × (288 × 3)] + ($50,000 × 36) |
= $56,160 + $1,620,000 | |
= $1,882,080 |
Assume that two hours are spent on these activities for each new employee. Therefore:
R7 | = 2 × $30 × 288 |
= $17,280 |
Assume that if the medical examinations are done at the hospital (in-house), each exam will take one hour; the examiner is paid $55 per hour; x-rays, laboratory analyses, and supplies cost $135; and 288 exams are conducted. Therefore:
R8 | = [(1 × $55) + $135] × 288 |
= $54,720 |
If the exams are contracted out, let us assume that Wee Care will pay a flat rate of $250 per examination. Therefore:
R9 | = $250 × 288 |
= $72,000 |
Wee Care therefore decides to provide in-house medical examinations for all new employees. Total replacement costs (RT) can now be computed as the sum of R1 through R8:
RT | = | $126,720 + $43,200 + $25,920 + $59,616 + $6,912 + $1,882,080 + $17,280 + $54,720 |
RT | = | $2,216,448 |
In virtually all instances, replacement employees must be oriented and trained to a standard level of competence before assuming their regular duties. As discussed in Chapter 11, “Costs and Benefits of HR Development Programs,” this often involves considerable expense to an organization. For the present, however, assume that all replacement employees receive a total of 2 full days (16 hours) of new-employee orientation from an HR department representative. After that, they are either placed in a formal training program, assigned to an experienced employee for some period of on-the-job training, or both. The cost elements and computational formulas for this category of turnover costs are shown in Figure 4-5. The three major elements of training costs are informational literature plus new-employee orientation, instruction in a formal training program, and instruction by employee assignment.
The cost of any informational literature provided to replacement employees must be considered a part of orientation and training costs. Unit costs for those items may be obtained from existing accounting records. Multiplying the unit costs by the number of replacement employees hired during the period yields the first element of training costs. The cost of orientation includes the pay and benefits of the new employees who attend, as well as the pay and benefits of the HR representative who provides the orientation training times the number of hours of training.
New employees may also be involved in a formal training program. The overall cost of the training program depends on the cost of two major components: costs associated with trainers and costs associated with trainees. Whereas an organization incurs 100 percent of the costs associated with training replacements for employees who leave, the cost associated with trainers depends on the extent to which formal training is attributable to turnover. It is important, therefore, to distinguish the proportion of trainees who are replacements for employees who left, from the reminder who are in training due to other factors, such as planned expansion of the work force. For the sake of simplicity, the costs of facilities, food, and other overhead expenses have not been included in these calculations.
Instead of, or in addition to, instruction in a formal training program, new employees may also be assigned to work with more experienced employees for a period of time or until they reach a standard level of competence. The overall cost of this on-the-job training must be determined for all replacement employees hired during the period, for it is an important element of training costs.
Notice that in Figure 4-5, the cost of reduced productivity of new employees while they are learning is not included as an element of overall training costs. This is not because such a cost is unimportant. On the contrary, even if an organization staffs more employees to provide for a specified level of productivity while new employees are training, the cost of a decrease in the quantity and quality of goods or services produced is still very real. Less-experienced employees may also cause an increase in operating expenses because of inefficient use of supplies and equipment. Other elements of lost productivity and lost business include factors such as additional overtime to cover one or more vacancies, cost of temporary help, the offsetting effects of wages and benefits saved due to the vacancy, and the cost of low morale among remaining employees.
At high levels in organizations, and in other jobs where relationships with customers, leads, and contacts are critically important, the economic cost of business lost (that is, “opportunities foregone”) may be substantial. On top of that, there may also be “ripple effects” associated with an employee’s departure, such that other employees follow him or her out the door. Situations such as these are especially prevalent when employee “stars” or “A-level” players depart and convince others to follow them. Executive recruiters call these situations “lift-outs.” As Business Week noted, “In a way, lift-outs are the iTunes of the merger world: Why buy the whole CD when all you really want are its greatest hits?”[25] They can be especially costly, not to mention the huge gaps in staffing that they create. They tend to occur when tightly knit groups or networks of employees (coworkers, former colleagues, classmates, or friends) decide to leave en masse.[26]
All of these costs are important. In the aggregate, they easily could double or triple the costs tallied thus far. When they can be measured reliably and accurately, they certainly should be included as additional elements of training costs. The same is true for potential productivity gains associated with new employees. Such gains serve to offset the costs of training. However, in many organizations, especially those providing services (for example, credit counseling, customer services, patient care in hospitals), the measurement of these costs or gains is simply too complex for practical application. At the same time, these costs are seldom zero, and it is probably better to include a consensus estimate of their magnitude from a knowledgeable group of individuals than to assume either that they do not exist or that the cost is zero.
Now let us estimate the total cost of training employee replacements at Wee Care. Using the formulas shown in Figure 4-5, Wee Care estimates the following costs over a one-year period.
Assume that the unit cost of informational literature is $20, and that 288 employees are replaced. Each of the 288 replacements, at an average pay rate plus benefits of $25.42 per hour (see the computation of S1 above) receives a total of 16 hours (2 full days) of general orientation to the hospital from an HR department representative, who receives $30 per hour in pay and benefits. The total cost of informational literature and new-employee orientation is therefore as follows:
T1 | = ($20 × 288) + (16 × $25.42 × 288) + (16 × $30) |
= $123,375.36 |
New-employee training at Wee Care is conducted 10 times per year, and each training program lasts 40 hours (1 full week). The average pay plus benefits for instructors is $48 per hour, the average pay and benefits rate for trainees is $25.42 per hour, and of the 576 employees trained on the average each year, half are replacements for employees who left voluntarily or involuntarily. The total cost of formal training attributed to employee turnover is therefore as follows:
To ensure positive transfer between training program content and job content, Wee Care requires each new employee to be assigned to a more experienced employee for an additional week (40 hours). Experienced employees average $35 per hour in wages and benefits, and their own productivity is cut by 50 percent while they are training others. Each experienced employee supervises two trainees. The total cost of on-the-job training for replacement employees is therefore as follows:
T3 | = 40 × [($35 × 0.50 × 144) + ($25.42 × 288)] |
= 40 × ($2,520 + $7,320.96) | |
= 40 × $9,840.96 | |
= $393,638.40 |
Total training costs can now be computed as the sum of T1, T2, and T3:
TT | = $123,375.36 + $302,438.40 + $393,638.40 |
= $819,452.16 |
A final factor to consider in the tally of net turnover costs is the uncompensated performance differential between employees who leave and their replacements. We will call this difference in performance (DP). DP needs to be included in determining the net cost of turnover because replacements whose performance exceeds that of leavers reduce turnover costs, and replacements whose performance is worse than that of leavers add to turnover costs.
To begin measuring DP in conservative, practical terms, compute the difference by position in the salary range between each leaver and his or her replacement. Assume that performance differentials are reflected in terms of deviations from the midpoint of the pay grade of the job class in question. Each employee’s position in the salary range is computed as a “compa-ratio”; that is, salary is expressed as a percentage of the midpoint of that employee’s pay grade. If the midpoint of a pay grade is $50,000 (annual pay), for example, an employee earning $40,000 is at 80 percent of the midpoint. Therefore, his or her compa-ratio is 0.80. An employee paid $50, 000 has a compa-ratio of 1.0 (100 percent of the midpoint rate of pay), and an employee paid $60,000 has a compa-ratio of 1.2 because he or she is paid 120 percent of the midpoint rate of pay. Compa-ratios generally vary from 0.80 to 1.20 in most pay systems.[27]
To compute DP, use the following formula:
Where DP is difference in performance between leaver and replacement, ![]() is summation over all leavers and their replacements, CRl is the compa-ratio of the leaver, CRr is the compa-ratio of the replacement, and MPi is the annual rate of pay at the midpoint of the pay grade in question. Consider the following example:
is summation over all leavers and their replacements, CRl is the compa-ratio of the leaver, CRr is the compa-ratio of the replacement, and MPi is the annual rate of pay at the midpoint of the pay grade in question. Consider the following example:
CRl | = 0.80 CRr= 1.0 MPi = $50,000 |
DP | = (0.80 – 1.0) × $50,000 |
DP | = (–0.20) × $50,000 |
DP | = –$10,000 |
DP is therefore subtracted from total turnover costs because the firm is gaining an employee whose performance is superior to that of the employee who was replaced.
If the compa-ratio of the leaver is 1.0, that of the replacement is 0.80, and the pay-grade midpoint is $50,000, DP = $10,000. These costs are added to total turnover costs because the leaver was replaced by a lesser performer.
Why are differences in performance assumed to covary with differences in pay? Actually, this assumption is true only in a perfectly competitive labor market.[28] In a perfectly competitive labor market, every worker earns the marginal revenue product accrued to the firm from his or her labor. Thus, the firm is indifferent to workers whose compa-ratios are 0.80, 1.0, or 1.20 because each worker is paid exactly what he or she is “worth.”
Many entry-level jobs (for example, management analysts) approximate conditions where it is reasonable to assume that compa-ratio differences reflect performance differences. Above the entry level, however, labor markets are often imperfect because workers develop what economists call “firm-specific human capital.”[29] Workers who have specific job knowledge that is valued by their firms (for example, in banking, automobiles, computers) tend to command higher wages. However, their value is reflected only partly in their higher wages. Wages reflect what economists call “opportunity costs,” or the value of a worker’s second best employment opportunity. Competitors are only able to offer a wage that reflects the economic value of a worker to them. Therefore, opportunity costs and the wage rates paid to valued employees tend to reflect only the portion of a worker’s economic value that is easily transferable from one employer to another (that is, “generic”). The portion of an employee’s value that is not easily transferable, the firm-specific component, typically is reflected only partially in employee wages, if at all. Thus, the economic value of workers with firm-specific human capital is above their wage (opportunity cost) level, but can be assumed to be proportionate to these wages.
If an employee with substantial amounts of firm-specific human capital leaves the firm and is replaced by a worker who lacks such firm-specific human capital, the replacement will receive a lesser wage. However, if a poor performer leaves and is replaced by a worker with more human capital, albeit non-firm-specific, the replacement will receive a higher wage than the leaver.[30] The difference in pay between leavers and their replacements thus represents an indicator, although an imperfect one, of the “uncompensated performance differential” due to firm-specific human capital, and it should be considered when determining the net costs of turnover.
The assumption that excess value to the firm is a function of wages paid and that excess value and wages covary in a linear (straight-line) fashion is conservative. In practice, the relationship can be curvilinear (positive or negative); but for our purposes, the conservative assumption of a linear relationship between excess value and wages is appropriate. At the same time, higher (lower) wages paid to a replacement employee represent an additional, ongoing cost (or saving) to an organization. It is appropriate to calculate such a pay differential, for it is part of the differential value of the replacement, relative to the employee who left. Although an offsetting strategic value may justify paying a replacement more, that is often a subjective estimate by decision makers.
For Wee Care, assume that the net DP = +$200,000. On average, therefore, the firm hired slightly poorer performers than it lost. The following equation, which uses the four major components of employee turnover, represents the total cost of employee turnover:
Total cost of turnover = ST + RT + TT + DP |
Where ST is total separation costs, RT is total replacement costs, TT is total training costs, and DP is net differential performance between leavers and their replacements. For Wee Care, the total cost of 288 employee turnovers during a one-year period was as follows:
$467,967.36 + $2,216,448 + $819,452.16 + $200,000 |
= $3,504,067.50 |
This represents a cost of $12,166.90 for each employee who left the hospital.
In several places earlier in this chapter, we mentioned that it is useful to include the costs of lost productivity and lost business in the fully loaded cost of employee turnover, if it is possible to tally such costs accurately. Seven additional cost elements might be included, as follows:[31]
The cost of additional overtime to cover the vacancy (Wages + Benefits × Number of hours of overtime)
The cost of additional temporary help (Wages + Benefits × Hours paid)
Wages and benefits saved due to the vacancy (these are subtracted from the overall tally of turnover costs)
The cost of reduced productivity while the new employee is learning the job (Wages + Benefits × Length of the learning period x Percentage reduction in productivity)
The cost of lost productive time due to low morale of remaining employees (estimated as Aggregate time lost per day of the work group × Wages + Benefits of a single employee × Number of days)
The cost of lost customers, sales, and profits due to the departure (Estimated number of customers × Gross profit lost per customer × Profit margin in percent)
Cost of additional (related) employee departures (If one additional employee leaves, the cost equals the total per-person cost of turnover.)
In terms of analytics, one final caution is in order: namely, not to be misled by variability across departments or business units that are based on small numbers. After all, if a six-person department loses two employees, that’s a 33 percent turnover rate! We noted in Chapter 2, “Analytical Foundations of HR Measurement,” the dangers associated with generalizing from small samples that are not representative of the larger population they are designed to represent. In the case of small-sample turnover statistics, to make the sample more representative, it might make sense to segment employee turnover into broader categories that include larger numbers of employees.
Remember, the purpose of measuring turnover costs, and using analytical strategies to reveal their implications, is to improve managerial decision making. Here is a brief example of one such an analysis.[32] Based on the model shown in Figure 4-1, the researchers developed an analytical model that captured the value associated with employee separations (turnover) and acquisitions (hires) over a four-year period. Their model estimated three components in each time period:
Movement costs. The costs associated with employee separations and acquisitions
Service costs. The pay, benefits, and associated expenses required to support the work force
Service value. The value of the goods and service produced by the work force
Then, they estimated the dollar-valued implications of three different pay plans (equal pay increases plus two types of pay-for-performance plans) and of the subsequent separation and acquisition patterns over the four years. They did so by subtracting the movement costs and service costs from the service value. In short, they subtracted each pay plan’s costs from its benefits.
Traditional compensation-cost analysis suggested that a strong link between pay and performance would be unwise, given its extreme cost. When the potential benefits of work force value were accounted for, however, a different conclusion emerged. That is, by fully incorporating both costs and benefits into their model, the researchers showed that even under the most conservative assumptions, pay-for-performance was a valuable investment, with potentially very high payoffs for the firm. This reinforces a point we made at the beginning of the chapter, namely, that turnover is only one part of a family of external moves. Adopting a broader perspective is a wise strategy indeed.
Organizational budgeting practices sometimes provide a natural opportunity to use the costs of employee turnover as part of a broader framework to demonstrate tangible economic payoffs from effective management practices. Thus, when line managers complain that they cannot keep positions filled, or that they cannot get enough people to join as new hires, that is a prime opportunity to elevate the conversation. How? As an example, consider the SAS Institute of Cary, North Carolina.
SAS is renowned for its low voluntary turnover rate among computer programmers. In an industry that routinely experiences 20 percent voluntary turnover per year among programmers, at SAS it runs about 3 percent per year. It does that largely through its enlightened management practices. Those practices are founded on the idea that in an intellectual-capital business, attracting and retaining talent is paramount, and that the way to attract and retain good people is to give them interesting work to do, interesting people to do it with, and treat them like the responsible adults they are.
SAS is justifiably famous for its pleasant physical work environment and generous, family-friendly benefits. Those benefits include an on-site 7,500-square-foot medical facility and a full-indemnity health plan that includes vision, hearing, and dental care, free physical exams, and free mammography. It also provides on-site Montessori day care, a fitness center, soccer, and softball fields. All of this is free to employees and their families. The company even provides towels and launders exercise clothes—also for free. Finally, it provides elder care, domestic-partner benefits, and cafeterias with subsidized meals.[33]
Suppose a line leader addresses the following question to HR leaders: “I’m happy our turnover among programmers is 3 percent, but are we spending too much to keep them, and is it worth it?” In answering that very reasonable question, an HR leader might begin by reviewing the company’s business model. In brief, it is as follows.[34]
SAS relies on annual product renewals from its clients, who use its software for deep analysis of their organizational databases. SAS also relies on employees for innovations and services that are tailored to those clients’ particular industry requirements and their unique competitive positions in their industries. This means that client relationships with SAS advisers need to be based on a thorough, shared understanding about industry-specific competition and on long-term trust. This may be more important for SAS than for its competitors, whose business models are based more on software purchases than renewable licenses and whose value proposition is not so deeply dependent on close and well-informed relationships with clients.
One way that SAS creates the capability, opportunity, and motivation to achieve this kind of deep, common, client-focused synergy is by creating an employment model that attracts and motivates programmers, designers, and client advisers to join and stay for the long run. This is a distinctive value proposition because a long-term employment deal is unusual in professions where the norm is to move from project to project, often changing employers many times in a few years to find the most interesting work or a higher paycheck.
The HR leader might then present the cost implications of that 17 percent difference in employee turnover between SAS and the software industry. Table 4-1 includes some hypothetical calculations.
Table 4-1. Annual Opportunity Savings from Lower Employee Turnover among Programmers: SAS Versus the Software Industry
SAS | Software Industry | |
|---|---|---|
Annual turnover | 3% | 20% |
Annual salary | $60,000 | $60,000 |
Number per 1,000 programmers who leave | 30 | 200 |
Cost of turnover per programmer (1.5 x Salary) | $90,000 | $90,000 |
Total cost | $2,700,000 | $18,000,000 |
Annual opportunity savings at SAS $15,300,000 |
Of course, the annual opportunity savings does not include the incremental, yearly cost to SAS of providing such generous benefits and perquisites for its employees. Assume, however, that the annual cost of benefits per SAS employee is as high as 50 percent of salary (compared to a 2006 U.S. average of 31 percent).[35] Its incremental, yearly cost, relative to its competitors, is therefore roughly 20 percent higher. The total annual opportunity savings to SAS as a result of lower employee turnover may be viewed as an annuity that helps to pay for the benefits that keep employee turnover low. Because it takes a long time for a new employee to develop the kind of shared understand and high level of trust with clients that is central to the SAS business model, retaining talent truly is critical to achieving the company’s strategic objectives. The answer to the line leader’s original question is that SAS’s investments in generous employee benefits are likely to be worth it.
Software that calculates answers to one or more of the following exercises can be found at www.shrm.org/publications/books.
1. | Ups and Downs, Inc., a 4,000-employee organization, has a serious turnover problem, and management has decided to estimate its annual cost to the company. Following the formulas presented in Figures 4-3, 4-4, and 4-5, an HR specialist collected the following information. Exit interviews take about 45 minutes (plus 15 minutes preparation); the interviewer, an HR specialist, is paid an average of $31 per hour in wages and benefits; and over the past year, Ups and Downs, Inc. experienced a 27 percent turnover rate. Three groups of employees were primarily responsible for this: blue collar workers (40 percent), who make an average of $33.20 per hour in wags and benefits; clerical employees (36 percent), who make an average of $18.50 per hour; and managers and professionals (24 percent), who make an average of $44.75 per hour. The HR department takes about 90 minutes per terminating employee to perform the administrative functions related to terminations, and on top of that, each terminating employee gets two weeks’ severance pay. All of this turnover also contributes to increased unemployment tax (old rate = 5.0 percent; new rate = 5.4 percent); and because the average taxable wage per employee is $22.90, this is likely to be a considerable (avoidable) penalty for having a high turnover problem. It also costs money to replace those terminating. All pre-employment physicals are done by Biometrics, Inc., an outside organization that charges $250 per physical. Advertising and employment-agency fees run an additional $550, on average, per termination, and HR specialists spend an average of four more hours communicating job availability every time another employee quits. Pre-employment administrative functions take another two and a half hours per terminating employee, and this excludes pre-employment interview time (one hour, on average). Over the past year, Ups and Downs, Inc.’s records also show that for every candidate hired, three others had to be interviewed. Testing costs per applicant are $14 for materials and another $14 for scoring. Travel expenses average $85 per applicant, and one in every ten new hires is reimbursed an average of $55,000 in moving expenses. For those management jobs being filled, a 90-minute staff meeting is also required, with a department representative (average pay and benefits of $37.75 per hour) present. In the past year, 17 meetings were held. Finally, post-employment acquisition and dissemination of information takes 75 minutes, on average, for each new employee. And of course, all these replacements have to be oriented and trained. Informational literature alone cost $19 per package, and a formal orientation program run by an HR specialist takes 2.5 days (20 hours) spread over the first two months of employment. New employees made an average of $22.50 per hour in wages and benefits. After that, a formal training program (run 12 times last year) takes four 8-hour days, and trainers make an average of $46 per hour in wages and benefits. About 65 percent of all training costs can be attributed to replacements for those who left. Finally, on-the-job training lasted three 8-hour days per new employee, with two new employees assigned to each experienced employee (average pay and benefits = $36.25 per hour). During training, each experienced employee’s productivity dropped by 50 percent. Net DP was + $210,000. What did employee turnover cost Ups and Downs, Inc. last year? How much per employee who left? (Use the software available from www.shrm.org/publications/books or the worksheet below for all computations.) |
Exit interview cost of interviewer’s time = |
Cost of terminating employees’ time = |
Administrative functions related to terminations = |
Separation pay = |
Unemployment tax = |
Total separation costs = |
Communicating job availability = |
Pre-employment administrative functions = |
Testing = |
Staff meeting = |
Travel/moving expenses = |
Post-employment acquisition and dissemination of information = |
Contracted medical examinations = |
Total replacement costs = |
| 1. | Dooney, J., & Smith, N. (2005). SHRM human capital benchmarking study: 2005 executive summary. Alexandria, VA: Society for Human Resource Management. |
| 2. | Fortune 500. (April 17, 2006). Fortune 500: America’s Largest Corporations. Fortune, F1-F20. |
| 3. | Frontline. 2004. Is Wal-Mart good for America? November 16. Retrieved from www.pbs.org/wgbh/pages/frontline/shows/walmart/transform/protest.html on October 19, 2005. |
| 4. | Fortune 500, 2006. (April 17, 2006). Fortune, p. F-52. |
| 5. | Boudreau, J. W., & Berger, C. J. (1985). Decision-theoretic utility analysis applied to employee separations and acquisitions. Journal of Applied Psychology Monograph, 70(3), 581-612. |
| 6. | Ibid. |
| 7. | Martin, D. C., & Bartol, K. M. (1985). Managing turnover strategically. Personnel Administrator, 30(11), 63-73. |
| 8. | Bureau of National Affairs. (2006). Bulletin to Management: Job Absence and Turnover Rates. Washington, D.C.: Bureau of National Affairs. |
| 9. | Hulin, C. L. (1979). Integration of economics and attitude/behavior models to predict and explain turnover. Paper presented at Annual Meeting of the Academy of Management, Atlanta. |
| 10. | Branch, S. (Nov. 9, 1998). You hired’em, but can you keep’em? Fortune, p. 247-250. |
| 11. | Solomon, J. (December 29, 1988). Companies try measuring cost savings from new types of corporate benefits. Wall Street Journal, p. B1. |
| 12. | Hewlett, S. A., & Luce, C. B. (March 2005). Off-ramps and on-ramps: Keeping talented women on the road to success. Harvard Business Review, p. 43-54. |
| 13. | Johnson, A. A. (1995). The business case for work-family programs. Journal of Accountancy, 180 (2), 53-58. |
| 14. | Tay, C., Quazi, H., Kelly, K., & Ang, S. (October 2005). A case study on work-life practices and climate on employee and firm outcomes in Sakae Sushi. Technical report, Nanyang Business School, Nanyank Technological University, Singapore. |
| 15. | Smith, H. L., & Watkins, W. E. (1978). Managing manpower turnover costs. Personnel Administrator, 23, (4), 46-50. |
| 16. | Dooney, J. (November 2005). Cost of turnover. Retrieved from www.shrm.org/research on February 6, 2006. |
| 17. | Allbusiness.com (2006). Severance pay. Retrieved from www.Allbusiness.com on August 8, 2006. |
| 18. | Sosnin, B. (Nov. 2005). The numbers on severance. HRMagazine, p. 77. |
| 19. | These data were reported in Cravotta, R., & Kleiner, B. H. (2001). New developments concerning reductions in force. Management Research News, 24 (3/4), 90-93. |
| 20. | Appelbaum, S. H., Lavigne-Schmidt, S., Peytchev, M., & Shapiro, B. 1999. Downsizing: Measuring the costs of failure. Journal of Management Development, 18(5): 436-463. |
| 21. | weighted average pay + benefits per terminated employee = |
| 22. | Cascio, W. F. (2006). Managing Human Resources: Productivity, Quality of Work Life, Profits (6th ed, Ch. 6). Burr Ridge, IL: McGraw-Hill/Irwin. |
| 23. | Expomed.com (2006). Drug Testing. Retrieved from www.Expomed.com on August 10, 2006. |
| 24. | Hansen, F. (Nov. 2002). Reigning in relocation costs. Work force. Downloaded from www.workforce.com on August 24, 2004. |
| 25. | McGregor, J. (Dec. 18, 2006). I can’t believe they took the whole team. Business Week, p. 120, 122. |
| 26. | Wysocki, B., Jr. (March 30, 2000). Yet another hazard of the new economy: The Pied Piper effect. The Wall Street Journal, p. A1; A16. |
| 27. | Milkovich, G. T., & Newman, J. M. (2008). Compensation (9th ed.). Burr Ridge, IL: McGraw-Hill/Irwin. |
| 28. | Hirschey, M. (2006). Fundamentals of Managerial Economics (8th ed.) Mason, OH: South-Western Thompson Learning. |
| 29. | Becker, G. S. (1964). Human Capital. New York: National Bureau of Economic Research. |
| 30. | Lazear, E. P. (1998). Personnel Economics for Managers. NY: Wiley. |
| 31. | Dooney, 2005, op. cit. |
| 32. | Sturman, M. C., Trevor, C. O., Boudreau, J. W., & Gerhart, B. (2003). Is it worth it to win the talent war? Evaluating the utility of performance-based pay. Personnel Psychology, 56, 997-1035. |
| 33. | O’Reilly, C. A. III, & Pfeffer, J. (2000). Hidden Value. Boston: Harvard Business School Press. |
| 34. | Boudreau, J. W., & Ramstad, P. (2007). Beyond HR: The New Science of Human Capital. Boston, MA: Harvard Business School Press. |
| 35. | Miller, S. (June 2006). 2006 SHRM benefits survey. Alexandria, VA: Society for Human Resource Management. |