
12
Relational Data
We consider in this chapter, the simplest and most popular form of relational data and tabulated data. There exists billions of spreadsheets data, either from Excel, or from other software. Also, data from RDBMS (relational database management systems) can be easily exported as tabulated data, for instance under a “comma separated values” (CSV) format, or, as we have already learned, in JSON files.
Let us detail two important operations that can be done with a simple browser: data aggregation and data join.
12.1. Aggregating tabulated JSON data
The relational nature of tabulated data does not fit well with hierarchical structures, which introduce that which is called “dimensions”, for instance, the spatial dimension of an administrative breakdown or the taxonomic dimension of the scientific classification of the living beings.
This is well-known in database management systems, and data warehouses frequently use the joins and aggregators to pass from relational to hierarchical representations of the same datasets. At the browser scale, we are facing similar issues, and we must realize operations similar to Sql Left Join or Sql GroupBy, between data coming from several JSON files. We describe these processing with the JavaScript code of the following example: the analysis of electoral data.
12.1.1. Electoral data: administrative breakdown, political breakdown
The administrative breakdown is a well-known issue. In France, there are five levels: [communes], [circonscriptions], [departement], [region] and [France].
The inclusion relation is transitive, which is easy to handle, but does not exist between communes and circonscriptions: a few large communes are split between several circonscriptions, alone, or together with other smaller communes.
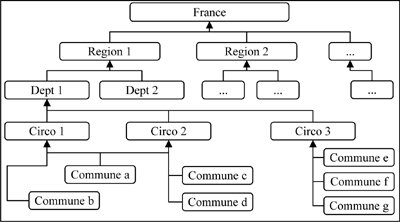
Figure 12.1. Breaking down the “spatial dimension” of the electoral application
In the same way, political affinities may make it so that some candidates declare several “labels”. The dimension “affiliation” compounds have two levels: label and group.
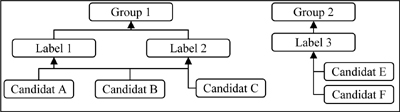
Figure 12.2. Breaking down the “affiliation dimension” of the electoral application
The non-functional nature of such breakdowns is the source of some issues. For instance, the cumulation of votes by department (or a higher level) can lead to a total lower than the total of the votes, if we cumulate by “first label” (some missing), or to a superior total if we cumulate by “group” (some duplicates). The cross between the two dimensions is at the level: Candidat ↔ Circonscription.
Therefore, the two basic objects are as follows:
- – the “candidat” (candidate), which determines a unique “circonscription” (hence a “department”) and which owns a list of political labels;
- – the “circonscription” (constituency), which maintains the list of its candidats and where votes, spread over the “communes”, must be cumulated.
There are some other objects as follows:
- – the departement, which is a list of one or more circonscriptions: cumulating votes by party label is sometimes an issue (see later);
- – regions and full France: same counting issues;
- – groups: observed from ahead of vote declarations and on election day.
The sources of data concern the election of the member of the French Assemblée nationale during the 2017 election (“législatives”).
Table 12.1. List of the data sources used in the electoral application
| Available data about the candidates, the circonscriptions and the vote |
| Candidate’s declarations: political and financial affiliation |
| https://www.interieur.gouv.fr/Elections/Elections-legislatives-2017/Declaration-de-rattachement-a-un-parti-ou-groupement-politique |
| https://www.interieur.gouv.fr/Elections/Elections-legislatives-2017/Elections-legislatives-le-financement-public-des-partis-politiques2 |
| Results by commune |
| https://www.data.gouv.fr/fr/datasets/elections-legislatives-des-11-et-18-juin-2017-resultats-du-2nd-tour-par-communes |
| Commune-level INSEE data |
| https://public.opendatasoft.com/explore/dataset/correspondance-code-insee-code-postal/api/? |
12.1.1.1. Accessing JSON-formatted data
Let us start with the most voluminous dataset, results and then declarations:
- – R-data: results of the first round (“élections législatives 2017”) and resulting from a spreadsheet transformed into this JSON format:
{ data: [{dn:#Dept, dl:NomD, c:NumCirco, cn:#Commune, cl:NomC,i:Registered, v:Voting, b:WhiteVotes, n:NullVotes,can:[{s:Sex, n:Lastnama, p:Fist, g:Label, v:Votes}, …]},{…}]}Here is a sample line:
{"dn":1, "dl":"Ain", "c":1, "cn":16, "cl":"Arbigny", "i":317, "v":157, "b":10, "n":1,"can":[{"s":"M", "n":"MALLET", "p":"Laurent", "g":"MDM", "v":12},{"s":"M", "n":"NOM2", "p":"Prénom2", "g":"ET2", "v":21}, … ]}, - – D-data: data from forms filled in by candidates before the registration deadline (about 2 weeks before election day). Some late candidacies are not listed, and some candidates did not provide ballots on election day. Several candidates have filled two or three different affiliations.
Here is a sample line, before and after the processing that breaks down the single string into a meaningful object:
{"Ain*1e_circo*M*MALLET Laurent 15/06/1972 MODEM"}{dep:"Ain",c:1,s:"M",n:"MALLET",p:"Laurent",dob:"15/06/1972",g:"MODEM"}
12.1.2. Aggregating data along the spatial dimension: votes by circonscription
In a relational database, this operation could have been done “à la SQL”, with the aggregator sum and the operator GroupBy:
SELECT SUM(votes), CandidatFROM CommunesWHERE Departement = "D" AND Circonscription = "C"GROUP BY Candidat;
Here is the JavaScript code for aggregating data from each commune of each circonscription of each departement, resulting in an array indexed by departement:
function processRdata(json){// @json: {'data':[line1, line2, …]}// line = {dn, dl, c, cn, cl, i, v, b, n, can:[{s,n,p,g,v},…]}const dept = []; // will be updated every makeNewDepartementlet curDep = null, curCir = null;function processRline(line, i){ // code pour chaque lignelet ldn = line.dn.toString(), lci = line.c;if(curDep && curDep.num === ldn){ // dep exists and is okif(lci === curDep.circos.length){ curCir.update(line);}else{curCir = makeNewCirconscription(line); // new circo in depcurDep.addCirco(curCir);}}else{curDep = makeNewDepartement(line,dept); // new depcurCir = makeNewCirconscription(line); // new circocurDep.addCirco(curCir); // add to dep}}json.data.forEach(processRline); // loop on linesreturn dept;}
NOTE.– The code makes the assumption that data are sequentially listed by circonscription and by department, not randomly. It simplifies the test using the current number curCir or curDep (linear rather than exponential search).
Here are the functions for creating a departement and a circonscription:
function makeNewDepartement(dat, depts){let num = dat.dn.toString(), nom = dat.dl;let rank = department.length, circos = [];let dept = Object.assign(Object.create(depProto),{num, nom, rank, circos});depts.push(dept);return dept;}function makeNewCirconscription(dat){let circ = null;delete dat.cn; delete dat.cl; // unused propertiesdat.can = dat.can.map(function(x){ // can updatex.dn = this.dn.toString(); x.c = this.c; // see: NOTE belowx.partis = [x.g];return Object.assign(Object.create(canProto), x);},dat);circ = Object.assign(Object.create(cirProto), dat);return circ;}const depProto = Departement.prototype,cirProto = Circonscription.prototype,canProto = Candidat.prototype;
In that code, the same line of data dat is used for the creation of both the departement and the circonscription. Using the method map avoids using a loop. Also, we are using the assign/create pattern that allows the creation of an object benefiting from the methods of depProto and the properties {num, nom, rank, circos} adapted from dat. The creation of the departement also fills in the array provided by the calling function processRline.
The same assign/create pattern is used for creating a circonscription, this time using cirProto as prototype. Regarding the creation of each candidat in the list of candidates of that circonscription, note that it is done once, using canProto, for the first commune of the circonscription. The next lines of the same circonscription will only update the number of votes. The line of data can be used directly (no adaptation) in the assign method, but we can delete some useless properties (name and number of each commune)
delete dat.cn; delete dat.cl; // unused propertiesNOTE.– The assign/create pattern uses the flexibility of the prototypal approach and is efficient in lines of code, as it simply reuses fragments of the JSON data.
We may notice the use of the method map, with its optional second parameter, which allows us to bind the value of the pronoun this:
dat.can = dat.can.map(function(x){x.dn = this.dn.toString(); x.c = this.c;x.partis = [x.g];return Object.assign(Object.create(canProto), x);}, dat); // option: binds 'this' to dat
The reason is that we need dat.dn and dat.c inside the callback of a map method applied on the array can: the solution of binding this is very convenient.
12.1.3. Aggregating data along the affiliations dimension: labels by candidate
In order to get the multiple affiliations (at least one) of a candidate, we require a kind of auto-join with a concatenation aggregator somewhat similar to:
SELECT DISTINCT d1.Candidat, CONCAT(d1.Parti, d2.Parti)FROM Depots AS d1WHERE d1.Departement = "D" AND d1.Circonscription = "C"LEFT OUTER JOIN Depots AS d2ON d1.Departement = "D" AND d1.Circonscription = "C"AND d2.Candidat = d1.CandidatGOUP BY CandidatHAVING d1.Parti <> d2.Parti
The JavaScript code is a bit more complex than processRdata:
function processDdata(json){// @json: {'data':[line1, line2, …]}// line = {string} to be transformed in {dep, c, s, n, p, dob, g}const declared = [], multiaff = [];let curCan = null;const processDline = function (line, i){/*see below*/};json.data.forEach(processDline);return {declared, multiaff};}
It returns an object made up of two arrays: the full list of “declared” candidates, and the list of candidates having filled in more than one affiliation. The code for the per line function is:
function processDline(line, i){let can = makeCandidatFromD(line); // pre-process, see belowif(!can.dob){return false;} // no declaration yet in circoif(curCan){if(curCan.isSame(can)){ // groupBy -> aggegate partiescurCan.aggregate(can); // same name expected to followif(!multiple.some(x => x.isSame(curCan))){multiple.push(curCan); // if not a duplicate, keep it}return false; // proceed with groupBy}else { // else: this is a new candidatdeclared.push(curCan); // store previous aggregated cand.}} // now set or reset curCancurCan =Object.assign(Object.create(canProto),can,{partis:[can.g]});return this;}
NOTE.– The code is simplified under the assumption that multiple declarations of a same candidate are in sequence (which is the case), which eases to reduce them into one single array entry. The assign/create pattern is used again with canProto and a direct copy of can. One more property partis is added directly within the assign method call.
The function makeCandidatFromD uses features described in Chapter 3:
function makeCandidatFromD(original){const spl = original.split("*"); // separator * > array 2+ itemsconst foundDate = str => str.match(/ dd.dd.dddd /);let dep = spl[0], c = parseInt(spl[1]); // tr.: "1e_circo" -> 1if(spl.length>3){const ok = foundDate(spl[3]);if(ok){ // ok = a date has been foundconst newx = spl[3].split(ok); // split before/after dateconst name = newx[0];const spn = name.split(" ");const s = spl[2];const n = spn.reduce((n,s,i) => n + (s.toUpperCase()===s?(i>0?" ":"")+s:"") );const p = unAccentize(name.slice(n.length+1, name.length));const dob = ok[0].substring(1, 11); // separator is the dateconst g = unAccentize(newx[1]);return {dep, c, s, n, p, dob, g};}}return {dep, c}; // just a dummy candidat (should have one)}
12.2. Joining data: multiple JSON files
Combining several sources of information is a fundamental operation for a data scientist. For a join to be possible, it requires that the two sources have at least one common ground to allow an association. The difficulty could be to determine such a “key”, and how the key is “joinable”. By “joinable” we mean: do we need an exact value equality between the keys, or the membership to a same equivalence class, or some more fuzzy association, allowing possible multiple associations?
We will not talk about sophisticated AI algorithms, but merely string processing: for instance, to accept “Général de Gaule” as well as “general de Gaulle”.
12.2.1. Advantage of the flexibility brought by the prototypal approach
The flexibility that we may expect when processing a join can take advantage of the flexibility of the assign/create pattern. One prototype can be shared by several objects that only own a subset of common properties. The polymorphism of the processing, according to the number of sources actually used, without an a priori knowledge of how many would be available, is another advantage of the prototypal approach.
Here is an example with the D-data (declarations), which allows us to build a candidat with the properties {sex, lastname, first, dob, aff: [p1,p2..]}, and with the R-data (official results), which allows us to build an actual candidat, with properties: {sex, lastname, first, party, votes}.
The prototypal approach cares only about the existing properties, and we can give the same prototype to an R-based candidat and to a D-based candidat, provided that enough properties are set. For instance, the test if(can.dob && !can.v) informs us about the status of can: if true, it means that can has been initialized from D-data, and has not yet been updated with additional R-data.
12.2.2. Coding the join on the electoral application
The basic object to join is the candidat, however, the data are hierarchized from departement, to circonscription, then finally to candidat. Therefore, we need to make a joinability test to each three levels. Here is the code for the method isSame in each of the prototypes:
- – departement: it is encoded differently in R-data or D-data, the name of the already processed department is
this.nom, and the name of the not yet processed one (indat) can bedat.depordat.dl, depending on the second source. Here is the polyfill using theacceptStringfunction detailed below:Departement.prototype.isSame = function(dat){ // polyfillconst str = ("dep" in dat)? dat.dep: (("dl" in dat)?dat.dl:dat);return acceptString(this.nom, str);}; - – circonscription: just check the number (same encoding)
Circonscription.prototype.isSame = function(dat){return this.c === dat.c;}; - – candidat:
Candidat.prototype.isSame = function(dat){return acceptString(this.n,dat.n) && acceptString(this.p,dat.p);};
The function acceptString compares two strings and accepts strings without caring about uppercase versus lowercase, or accentuated versus non-accentuated letters, also ignoring hyphen versus whitespace (“Côte-d’Or” accepted as “Cote dʼor”).
Here is the code for the join (R-data are updated with D-data):
function join(dept,decla){//@dept: list of departments built by processRdata//@decla: list of declared candidates, built by processDdatalet lenR = dept.length, lenD = declares.length,curNDep = 0, curNCir = 0;const joinDtoRdata = function(can){ // merges D-data to R-data// @can = one aggregated "D-based" candidatlet dep = dept[curNDep], cir;while(!dep.isSame(can)){ // seeks for the right depcurNDep++; dep = dept[curNDep]; curNCir = 0;}if(dep) cir = dep.circos[curNCir];else throw new Error("join: no Dept for "+can.dep+""+can.c);while(cir && !cir.isSame(can)){curNCir++; cir = dep.circos[curNCir];}if(cir) cir.crossUpdate(can);else throw new Error("join: no Circo for "+can.dep+""+can.c);};if(lenD > 0){declares.forEach(joinDtoRdata);}return {dept:dept, declares:decla};}
Here is the code for the method crossUpdate (circonscription and candidat levels):
Circonscription.prototype.crossUpdate = function(dat){let dd = this.can.find(function(x){return x.isSame(dat);});if(dd){dd.crossUpdate(dat);}else{disparus.push(dat);} // if we want to keep track of them};Candidat.prototype.crossUpdate = function(dat){// update R from Dthis.partis = this.partis.concat(dat.partis);this.dob = dat.dob;return this;};
NOTE.– A circonscription may count more than 100 communes and there may be up to 25 candidats in some circonscriptions. France counts 577 circonscriptions. Such a volume of data imposes a careful coding, aware of performance issues (memory and speed). We will see how to chain the whole processing in order not to hamper the display of the results.
12.3. Postprocessing: analysis
Once the operations GroupBy, by data source, and join between aggregated results are achieved, one can design a series analysis processing, akin to Select (element) from (array) Where (element meets criterion).
Here is a simple example: count the total votes in France:
let totvot = depts.reduce( //@depts: computed from joinDtoRfunction(tot, d){return tot + d.circos.reduce(function(count, c){ return count + c.v;}, 0);},0));
or in arrow syntax version:
let totvot = depts.reduce((tv,d) => tv + d.circos.reduce((t,c) => t + c.v, 0),0);printLog("Nb total de votants "+ totvot );
Again we note that the Array.prototype methods are very convenient.
12.3.1. Analyzing the affiliations
The partisan affiliations are not necessarily the names of usual political parties, but groups that accept to share the management of financial contributions. On election day, the authorities (the French Ministère de l’Interieur) give their own label for candidates. There are many “undecided” candidates, with the label “DIV” (“diverse”), sometimes “DVG” or “DVD”, meaning a “diverse” leaning left or right.
In order to better know what these affiliation groups are, we take an example:
const text = "CAISSE CLAIRE";const crit = function(p){return p.includes(text);};let gp = []; // expected: an array of candidatdepts.forEach(function(d){ // departement dd.circos.forEach(function(c){ // circonscription cgp = gp.concat(c.can.filter(function(x){ // candidat xreturn x.partis.some(crit);} // apply crit on x.partis)); // filter candidats then concat}); // by circonscription}); // by departement
The arrow syntax is more readable:
depts.forEach(function(d){d.circos.forEach(function(c){gp = gp.concat(c.can.filter((x)=> x.partis.some(crit)));});});
The result is the concatenation for each circonscription of each departement of the list of the candidats affiliated to the given group. For instance, “CAISSE CLAIRE” has 105 candidates, of which 76 are labeled as DIV by the authorities, 15 as DVG (leaning left), six as DVD (leaning right), seven as ECO (ecologist) and one as REG (regionalist). They are very diverse and got 50,972 votes nationwide.
12.4. The role of promises
The R-data electoral results are voluminous: 30 Mega, D-data: only 500 k. The interest of using promises is to allow the asynchronous processing of each file, before processing the join and then the postprocessing. We know how to use Fetch on a JSON file, and we have learned how to write a closure that transforms any function into a promise.
Consider this example about the second step only (D-data processing):
function step2(url,dept,json){ // synchronous versionlet decla = processDdata(json)if (decla.length > 0) {resolve(decla,dept);}else reject(url); // error message on url}function step2Promise(url,dept,json){ // "promise" versionreturn new Promise(function(resolve, reject) {let decla = processDdata(json);if (decla.length > 0) {resolve(decla,dept);}else throw new Error("failure with "+url); // or: reject()});}
The overall chain of processes may look like the following code: the function resolve is the first argument of the next call to then. Handling errors may use the second argument (optional function reject), or, as in this code, merely throw an error that will be processed asynchronously by a single catch for the whole chain.
const url_R = "fileR.json";const url_D = "fileD.json";fetch(url_R).then(a => a.json().then(jsonR => [a.url,jsonR])).then(([urlR,jsonR]) => step1(urlR,jsonR)).then(([dept]) => fetch(url_D).then(d => d.json().then(jsonD => [d.url,dept,jsonD]))).then(([urlD,dept,jsonD]) => step2(urlD, dept, jsonD) ).then(([dept,decla]) =>{let res = step3(decla,dept); step4(res);}).catch(reason => printLogAndStatus("error caught: "+reason));
That code needs some explanations:
- – we start with a
fetchrequest on the first file, which returns a promise that we must first read with the JSON method, which, in turn, returns a new promise. We may treat that promise directly with step 1, but we want to forward a second argument (here: just the name of the file), therefore, we must use a second function to wrap the promise and that argument: it is the role of the functionjsonR => [a.url,jsonR]; - – the next line:
.then(([urlR,jsonR]) => step1(urlR,jsonR))processes the result (the “resolved” promise) withstep1. The scripting([urlR,jsonR])clearly shows the components of the result, but we can use a simple object to wrap them together, and let function step 1 to decompose that object in its two components; - – the next line is a bit more complex: the
deptarray must be passed through the intermediate processing (afetch(), followed by ajson()), because we need it in the sequel. Therefore, the promise sequencefetch+jsonmust be wrapped with thedeptarray, in a similar way as the promise of the firstfetchcall; - – next line: processes the resolved promise with
step 2, the function that we detailed above; - – and finally, we can apply the join
step3and the postprocessingstep4. We may also promisifystep 3if some asynchronous resource would have been required, for instance the socioeconomic data from the INSEE source.
12.4.1. Performance considerations with the electoral application
Within each of the six steps, the code is framed between two calls to a function giving the real elapsed time in milliseconds:
function printLogAndStatus(message){ // t0 a control variablet0 = (window.performance.now() - t0);console.log(message +". In "+t0.toFixed(0)+" ms.");}
Table 12.2. The six steps in the promisified version of the application
| Logs | Action | (ms) |
| Promesse tenue ./Ddata.json: Ajax ok 300 ms. | →Reading, parsing file 1 | 300 |
| Resultat GroupBy (107 items). En 737 ms. | →stepl: groupBy on source 1 | 737 |
| Promesse tenue ./Rdata.json: Ajax ok 338 ms. | →Reading parsing file 2 | 338 |
| Resultat GroupBy (6790 items). En 1290 ms. | →step2: groupBy on source 2 | 1,290 |
| Jointure des R-data et D-data. En 1116 ms. | →Joint 2 sources | 1,116 |
| Calculs et affichages. En 2221 ms. | →Analysis and display | 2,221 |
12.5. Using Google Gantt chart for a graphic visualization
The six asynchronous steps of the chain can be visualized with the help of a Gantt chart, a relevant tool for the management of asynchronous tasks.
We can use the Google chart API, which creates SVG-based graphics, and which has a Gantt module. We must use the Google loader:
<script src="https://www.gstatic.com/charts/loader.js"></script>Here is the code that we can use in the handler of the domLoaded event:
// list of required data for computing the "Gantt"let taskID, taskName, start, end, duration, donePercent, after;const rows = [ // the 6 steps['D', 'declarations', new Date(), null, 300, 0, ''],['E', 'decGroupBy', null, null, 737), 0, 'D'],['R', 'resultats', null, null, 338, 0, ''],['S', 'resGroupBy', null, null, 1290, 0, 'R'],['J', 'Join(res,dec)', null, null, 1116, 100, 'S, E'],['A', 'Analyse', null, null, 2221, 100, 'J'] ];// Load the API with the gantt package, then set a callbackconst googleDiv = document.querySelector("#chart_div");google.charts.load('current', {'packages':['gantt']});google.charts.setOnLoadCallback(drawChart);const msPerD = (days)=> parseInt(days* 24* 60* 60* 1000);const getTyp = (v)=> v===null||v instanceof Date?'date':typeof v;function prepareColumns(data, row){let o= {taskID,taskName, start,end,duration, donePercent,after};const prow = Object.keys(o);if(prow.length !== row.length) throw new Error("wrong size");prow.forEach((p,i)=>{data.addColumn(getTyp(row[i]),p);});}function drawChart() {const data = new google.visualization.DataTable();prepareColumns(data, rows[0]);data.addRows(rows);const chart = new google.visualization.Gantt(googleDiv);chart.draw(data, opts); // opts = {width, height, styles …}}
And finally, here is the plot of the Gantt chart. The segment lengths are proportional to the duration of each task.
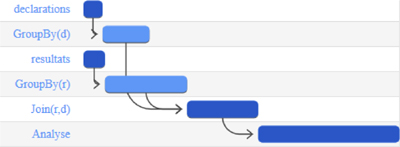
Figure 12.3. Gantt chart of the six steps in the electoral application