
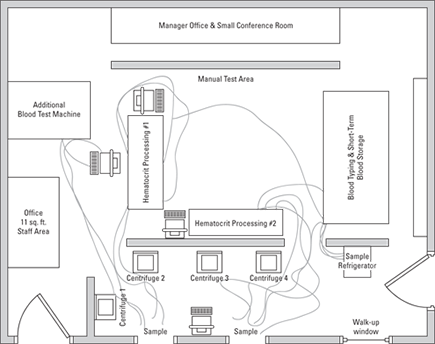
Figure 16-1: Initial lab layout.
Chapter 16
Real-Life Lean
In This Chapter
![]() Studying Lean in Healthcare
Studying Lean in Healthcare
![]() Living kaizen in manufacturing
Living kaizen in manufacturing
![]() Improving employee on-boarding
Improving employee on-boarding
In this chapter you learn about real-life examples of Lean in practice. You see Lean across several organizations in three industries — healthcare, manufacturing, and financial services. These stories include increasing laboratory throughput, maximizing consumer appointment capacity, operating room changeover, a high-tech assembly area’s first kaizen after a merger and on-boarding employees. In each case, a variety of Lean practices resulted in dramatic improvements in performance and customer satisfaction. Lean can be applied in many ways to any type of process in any industry — use these case studies as inspiration to improving all areas of your organization.
As you read these, you may have to adjust how you think about applying Lean concepts to your own processes. In this chapter, you see that “inventory” can be defined as available appointment times, and single minute exchange of die (SMED), a quick changeover technique (see Chapter 11), applies to the changeover of operating rooms. Both are direct applications of Lean techniques.
Improving Healthcare
This section looks at three distinct applications of Lean in healthcare settings. The first, from Master Black Belt Erica Gibbons, focuses on workflow improvements in a hospital laboratory. The second, from Linda LaGanga, shows how one organization, the Mental Health Center of Denver (MHCD), improved their performance rate for consumer intake processes. Finally, the Healthcare Performance Partners show the use of SMED to improve the safe changeover time of operating rooms at a medical center.
Laboratory queuing and workflow
The laboratory in a Midwest hospital needed help keeping up with their growing blood work demand. Blood work requests arrived from all over the 260-bed short-term acute-care hospital areas, especially during two periods: between 5:30 AM to 8:00 AM, and from 2:30 PM to 4:00 PM, Monday through Friday. Hospital leaders prescribed Lean to assist business leaders in eliminating issues in the facility. The laboratory had yet to participate in a Lean activity. Initially, both the laboratory leaders and staff doubted Lean would help their situation.
Initial conditions
The laboratory staff worked three 8-hour shifts with 30-minute lunches and two 15-minute breaks. No swing shifts were available. Several day-shift staff members had quit in the prior few months due to high-pressure and time-sensitive working conditions.
To process blood specimens, the staff received specimens through two sample elevators in various-sized packages. They’d separate urgent and routine requests and immediately spin specimens in one of their four centrifuge machines. After spinning the tubes, the staff distributed specimens to the appropriate machines for loading and processing. Once the lab work was completed, the staff recorded the results and phoned nursing personnel with any abnormal results. They were required to complete urgent requests within 30 minutes from the recorded lab draw time on the tube and routine requests within 120 minutes.
Urgent requests started increasing at a faster pace than hourly lab volumes could handle. Spoilage rates averaged 7% per hour with higher rates during their peak hours of 5:30 to 8:00 AM and 2:30 PM to 4:00 PM. During these peak periods, results often took considerably longer than the standard specified timeframes to process, resulting in irate calls and visits from hospital staff and managers.
In response, the lab brought in new equipment, which caused space constraints. Managers also placed an entry computer between sample elevators and beside each processing unit. Typically, managers assigned one processor per unit and had one to two receivers per shift. Figure 16-1 shows the layout of the lab.
Lab kaizen
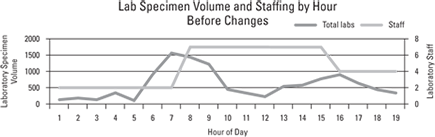
To begin the kaizen improvement effort, Lean practitioners, in conjunction with the lab personnel, characterized the current state by collecting data on the lab specimen types and arrivals per hour for the prior three months. The hematocrit and other blood samples represented 78 percent of lab specimen volumes. Figure 16-2 shows the data.
Figure 16-2: Initial lab specimen volume and staffing by hour.
Each blood sample was separated in one of four available centrifuges. A centrifuge could separate up to 24 samples in a 7 minute timeframe. With a 24 sample load, it took an additional 3 minutes to load and 2 minutes to unload. The total time to centrifuge 24 samples was, therefore, the 3 minute load-time, plus 7 minutes centrifuge, and 2 minutes to unload, for a total of 12 minutes — or 0.5 minutes/sample.
The hematocrit machines then processed the 24 centrifuged samples in a rack that took 6 minutes with 1 minute to load. Additional blood tests were performed in a larger blood test machine, which processed up to 48 centrifuged samples per rack in 9 minutes, on average, with a 2 minute load-time.
Both machines automatically uploaded their results into hospital information systems. Urgent requests acted as interrupters in the system. The staff processed urgent requests immediately, no matter the order received. Although both machines required daily maintenance, practitioners ignored downtime in the analysis.
Hematocrit processing = 24 samples/7 min. ⇒ 0.29 min./sample
Additional blood processing = 48 samples/11 min. ⇒ 0.23 min./sample
Distributing samples = 0.1 min./sample (may be done in groups)
 The team used Little’s Law, which is the fundamental mathematical principle for queuing theory applied to a steady-state process, to analyze the sample arrival process. For a given arrival rate, the time in the system is proportional to packet occupancy.
N = λ * T, where:
N: Average number of packets (specimens) in the system
λ: packet arrival rate per unit of time
T: average time in system per packet (including distribution, waiting and processing time)
The packets’ time in the system is determined by subtracting lab result time (departure time) from lab receipt time (arrival time). Generally, staff processed lab requests in a first-in first-out (FIFO) order. They required additional time to notify nursing and shift handoffs.
The team used the hourly takt time for specimens to determine the required staffing, especially during peak hours.
After they collected the initial data, the Lean practitioners formalized the project improvement team, which included a blend of lab workers and Lean. As the lab personnel became more involved in the project, they began to see how Lean could help their situation.
 Involve staff as early as possible in your projects. When they help to identify and solve their workflow issues, they begin to own the project and in the long term will sustain the results. You will save time and improve buy-in with early involvement.
The improved lab
The team worked together to identify improvements to lab processes that would result in more effective sample processing and better customer service. The next future state included several highly effective process improvements:
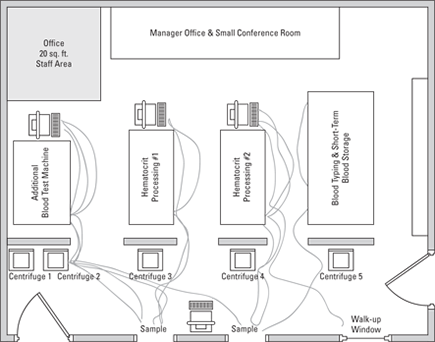
![]() Lean the laboratory layout: By adding one centrifuge and moving all of the centrifuges in line with hematocrit and alternative blood machines, the specimens flowed through lab in a more linear fashion, reducing distribution time by 0.1 minutes/sample. Figure 16-3 shows the post improvement layout.
Lean the laboratory layout: By adding one centrifuge and moving all of the centrifuges in line with hematocrit and alternative blood machines, the specimens flowed through lab in a more linear fashion, reducing distribution time by 0.1 minutes/sample. Figure 16-3 shows the post improvement layout.
![]() Flexing staff hours: Two day-shift technicians modified their hours to accommodate high morning volumes. This shifted capacity enabled the lab to meet the workload demands with no increase to the head count. As an added bonus, the new schedule allowed these two technicians to be with their school-aged children after school.
Flexing staff hours: Two day-shift technicians modified their hours to accommodate high morning volumes. This shifted capacity enabled the lab to meet the workload demands with no increase to the head count. As an added bonus, the new schedule allowed these two technicians to be with their school-aged children after school.
![]() Error-proofing labels: Errors due to misaligned labels were the primary reason that they required an additional blood test machine. To reduce errors and associated rework, the laboratory staff worked with test tube vendors to include a guideline for hospital personnel to better position the label on the tubes.
Error-proofing labels: Errors due to misaligned labels were the primary reason that they required an additional blood test machine. To reduce errors and associated rework, the laboratory staff worked with test tube vendors to include a guideline for hospital personnel to better position the label on the tubes.
![]() Educating the customers – redefining urgent: Like the boy who cried wolf, lab customers realized their lab work moved to the front of the line when they labeled it urgent, so everything became urgent. To overcome the everything-is-urgent syndrome, lab technicians met with the laboratory users around the hospital, who sent the most “urgent” requests. They listened to them to understand what drove “urgent” sample needs. With this understanding, the technicians created a standard definition for “urgent” and began to educate hospital staff about urgent requests using face-to-face meetings; they also create a communication campaign to spread the word about the new definition of urgent. The team effort made the difference. By improving overall sample turnaround and standardizing the urgent definition, fewer urgent requests came into the lab.
Educating the customers – redefining urgent: Like the boy who cried wolf, lab customers realized their lab work moved to the front of the line when they labeled it urgent, so everything became urgent. To overcome the everything-is-urgent syndrome, lab technicians met with the laboratory users around the hospital, who sent the most “urgent” requests. They listened to them to understand what drove “urgent” sample needs. With this understanding, the technicians created a standard definition for “urgent” and began to educate hospital staff about urgent requests using face-to-face meetings; they also create a communication campaign to spread the word about the new definition of urgent. The team effort made the difference. By improving overall sample turnaround and standardizing the urgent definition, fewer urgent requests came into the lab.
Figure 16-3: Improved lab specimen volume and staffing by hour.
Results: We love it!
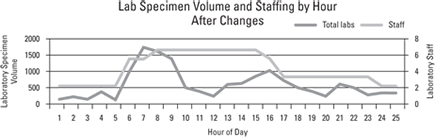
The new layout and staffing changes dampened the peak hour effect. Peak routine samples were completed within 45 minutes. Staff completed urgent requests on average within 25 minutes. Inappropriate urgent requests decreased by 80 percent as turnaround times improved. Figure 16-4 shows the lab specimen volume changes after the improvements.
Figure 16-4: Improved lab specimen volume and staffing by hour.
Laboratory technicians liked the new, less-stressful staffing. With faster test turnarounds, technicians worked on testing rather than fielding complaint calls from hospital staff. Most importantly, the empowered technicians were proud of their accomplishments, every step of the way, and owned their results.
Getting new consumers to show-up to scheduled appointments
The Mental Health Center of Denver (MHCD) is a private, nonprofit organization and the community mental health provider for the city and county of Denver (http://www.mhcd.org). MHCD believes that people can — and do — recover from mental illness; that treatment works to improve the lives of people of all ages; that MHCD’s work and mission are vital to the community; and that the quality and effectiveness of MHCD programs save the community money. It is important to them that people have services available to them, and that people show-up when scheduled to receive services. MHCD refers to people who use services as consumers.
Getting started
MHCD had a persistent problem of high no-show rates for initial intake appointments. With the support of the chief executive officer (CEO) and other executive-level staff, they decided to use Lean to tackle it. The first Rapid Improvement Capacity Expansion (RICE) project (kaizen project) aimed to increase the number of consumers admitted. The project focused on the elimination of waste caused by appointment no-shows and the increased utilization of intake resources.
 Top management support and careful team selection are essential to the long-term success of the Lean team. Management support helps to guarantee project participation and resources over time. The right people on the team — those who value operational improvement and are impacted by the issue — can help to build support throughout the organization, especially when Lean efforts are just beginning.
Select initial Lean projects that people care about and that address a significant operational problem, preferably ones closely tied to the organization’s mission and values. Success with these types of projects builds momentum and acceptance of Lean in the organization.
MHCD selected the initial Lean team members based on the Lean Respect for People principle, as well as their roles in the organization and their contributions with designing and operating effective, customer-centered processes. The team consisted of clinicians, administrative staff, managers, quality systems staff, and consumers, who had experienced the access process. They met over a period of four days to study and analyze all of the individual processes and activities that made up the scheduling of consumers for their initial intake appointment at the various adult and child sites within the organization.
The team used several Lean tools, such as value-stream mapping, fishbone diagramming, identification of current and target state conditions, and gap analysis (see Part III). Through their analysis, the team identified several processes to improve. Improvements to these processes would result in more consumers scheduled into appointments and improved consumer show-up performance. It is vital that the consumers actually show up to the initial appointment because it is the only way that they will be admitted to receive services.
The team decided to define inventory as “available appointment slots.” They viewed the process of scheduling consumers who call for appointments as an inventory consumption and distribution system.
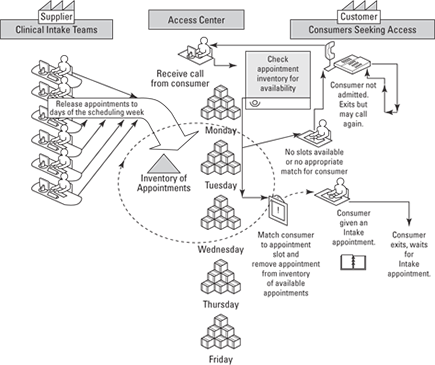
Clinicians performed new consumer intakes. These clinicians were on separate teams located away from the access center. The clinical intake teams gave the access center lists of times and days for appointment slots with clinicians. The access center then filled these slots with consumers, who called to request admission. When all of the allocated slots had been filled, the consumers, who called for appointments, were turned away and told to call back in a later week. Figure 16-5 shows the high-level value-stream for the consumer access and intake-to-services process.
Figure 16-5: High-level value-stream for consumer access and intake process.
Understanding the issue and generating improvements
The consumer participants on the RICE team provided insight into the factors that influenced their decision to attend an intake appointment after they had missed the first several appointments that were scheduled — in other words, the team heard the voice of the customer (VOC). This sparked ideas from the clinicians on what they could do to welcome new consumers, alleviate their anxiety, ensure that they had reliable transportation to the appointments, and knew how to get to the clinic.
The VOC provides crucial insights that drive effective process improvement. In this case, including consumers on the team helped the staff to understand how their actions affected consumer behavior and to generate new ideas for process improvement.
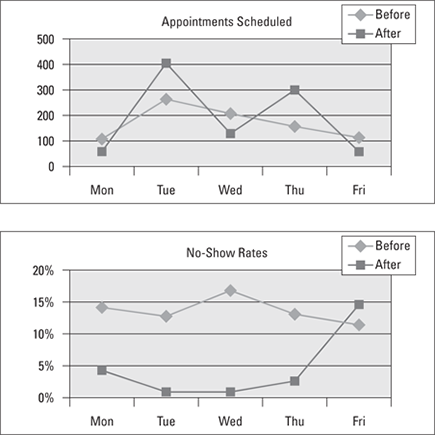
The team characterized the current state by measuring and analyzing information on appointments and no-show rates by day of week. Figure 16-6 shows the measurements before and after the Lean improvement project. The team utilized clinicians’ experience and the data to identify additional improvement opportunities. For example, they determined that Tuesdays were good days for intakes because no-show rates were relatively low and reminder calls could be made a day in advance, unlike Mondays. The team also noticed that Thursdays had relatively low no-show rates, but few appointments scheduled.
Turning “no-shows” into admissions
These insights led the team to redesign appointment schedules to add more Thursday appointments. This change increased the calling consumers’ chances of obtaining an appointment the same week without having to wait until the next week when clinical intake teams released new schedules. The newly developed process engaged consumers to understand the importance of their appointments and the need to cancel ahead of time, if they could not attend. This provided an opportunity to recycle appointment slots so that consumers, who called later in the week, could use them.
They combined separate steps in the workflow (such as an orientation appointment and the actual intake assessment), which originally occurred on separate days, into a single step to eliminate the possibility of a no-show after orientation. Moderate overbooking was also used for group orientations to mitigate lost capacity from no-shows. If more consumers showed up than expected, flexible capacity was put in place by calling upon program managers and interns to conduct the individual intake assessment following the orientation. By having the right participants on the Lean team, the new practices were implemented quickly and effectively.
Figure 16-6: Data before and after for appointment and no-shows.
Results
In just the first month of operation, the number of scheduled intake appointments increased by 22 percent over the same month in the prior year. The increase in scheduled appointments, combined with an immediate 5.67 percent decrease in no-show rate, resulted in a 30.26 percent increase in the number of completed intake appointments.
A one-year follow-up analysis of the results showed that this initial Lean project resulted in a sustained increased intake service capacity of 27 percent, decreased no-shows 12 percent, and gave 187 additional people access to services, all without increasing staff or other expenses.
MCHD recognized how important measurement and validation are to the improvement process. An analysis of the process after one-month confirmed that the system was working and provided feedback and motivation for the organization to continue its Lean initiative. The ultimate test of success was the large analysis that compared a full year of data one year after the implementation to a full year of data from the year before the improvements.
By focusing on what adds value for customers and eliminating waste, the Lean process at MHCD resulted in expanded access to services for consumers, who need them, and a more cost-effective use of resources. The program fostered innovative approaches and a commitment to improving quality throughout the organization, in both clinical and business areas. Through sustained leadership and organizational commitment and demonstrated results, Lean at MHCD thrives. Employees love the process, and consumers appreciate the results!
SMED operating room turnaround
Smooth transitions and hand-offs of operating rooms (OR) between procedures are critical to overall hospital performance. Healthcare Performance Partners (HPP) used Lean practices when working with a 260-bed for-profit medical center in Georgia, to maximize OR turnaround time performance. Efficient and safe turnarounds are important because they govern whether the next case will begin on time, with all necessary conditions and tools at the ready. Like a Formula 1 pit stop, a smooth OR transition means taking only the time required with well-choreographed team using standardized work (see Chapter 12) to make sure nothing is overlooked. The OR kaizen developed and implemented improved procedures for general surgery room turnarounds at this facility.
The current condition
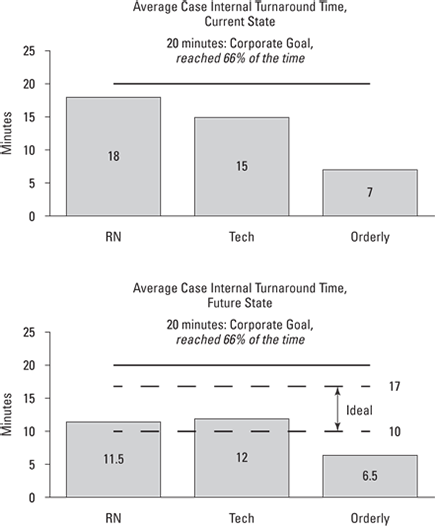
The OR team was meeting the 20-minute corporate goal for turnaround time only 66 percent of the time. The kaizen team observed that, if everything went perfectly, the nurse alone had nearly 20 minutes of work to do. The number of team members involved in the turnover, including technicians and orderlies, varied between cases, as did the number and types of tasks. Looking at the process with new eyes, the team wondered:
![]() Which tasks truly had to be done during the critical turnaround time?
Which tasks truly had to be done during the critical turnaround time?
![]() Which could be performed before or after, or as part of other work?
Which could be performed before or after, or as part of other work?
![]() What efficiencies could be gained for the remaining tasks performed during turnaround?
What efficiencies could be gained for the remaining tasks performed during turnaround?
Internal versus external tasks
When you think of turnaround time like a pit stop, it is easier to see that only the most critical tasks should be performed during the internal or live time — the time when the cars pull into the pits. For example, the pit crew only tightens the lug nuts during the pit stop. Other tasks, like filling the tires, are done during external time — the time before or after the turnaround.
In one example of the OR pit stop, the team saw that the OR technician would use critical internal time to go to another area of the hospital to pick up instruments for the next case. The team found a way to free up the technician’s time during the prior case to gather the instruments needed for the next case — in other words, they moved the activity to the noncritical path. Pushing this task into external time made the technician more available during the critical turnaround minutes.
In another instance, the nurse often used turnaround time to deliver a specimen to the laboratory. The kaizen team found a way to create a drop-off area for specimens, freeing that nurse’s time to focus on the turnaround.
Mastering the quick-change
The team continued to evaluate all of the OR changeover activities and find more ways to move activities to external time. The kaizen team also looked at ways to reduce wasted steps, confusion, and extra motion during the critical turnaround period.
For example, the team watched the nurse transport the patient to the post-anesthesia care unit (PACU), then return to the OR where the computer was located, complete the charting there, and then go to the pre-op holding area to retrieve the next patient. To reduce wasted time and effort, they located a computer right in the PACU, where the nurse could complete charting closer to the patient and eliminate an extra trip back to the OR. This change saved a crucial 2 minutes (10 percent) of key RN time during turnaround, and made their job easier.
The team also found variation in the number of people working during a turnaround — between three and eight staff members. They created a way to level and standardize the workload, making the number of people involved more predictable and sensible.
Above all, the OR must be clean. The cleaning solution they’d been using required 10 minutes for soaking surfaces. The team decided that this amount of wait time was too long and looked for another cleaning solution that would meet the cleanliness standards in less time. After they found a product that required only 1 minute of soak time to achieve the same level of cleanliness, the switch was on. Finally they updated the standardize work instructions for OR turnaround to reflect the new cleaner requirements.
The results
The hospital staff made several successful trial runs using their new procedures. Figure 16-7 shows the before and after data for the process. These results indicate:
![]() A reduction of 8 minutes (40 percent) in turnaround time, translating to 160 hours of OR time annually
A reduction of 8 minutes (40 percent) in turnaround time, translating to 160 hours of OR time annually
![]() Improved quality of the turnaround
Improved quality of the turnaround
![]() Improved staff and physician satisfaction
Improved staff and physician satisfaction
Figure 16-7: Before and after data for the OR changeover project.
First Kaizen Experience with a Post-Merger Team
Todd McCann, a kaizen leader and sensei, worked with a large-scale legacy telecommunications manufacturer that had diverse product offerings and a large plant. The company had just been sold to a new owner. Todd’s team supported this new organization by conducting kaizen activities throughout manufacturing and assembly operations.
The first area targeted for improvement was the final assembly for 24/36-port routers. The team evaluated several process areas for improvement: external customer relationships, order entry, internally manufactured materials, purchased materials and procurement planning/logistics, internal manufacturing and assembly production planning, and the router final assembly work area.
Todd and his team also focused on the people and culture of the organization by respectfully instructing, challenging, coaching and mentoring plant personnel; building teams; and growing and nurturing the kaizen spirit in the hearts and minds of the workforce to create breakthrough thinking attitudes and behaviors. As a sensei, he knew that these activities would result in greater value for the customer, team members with greater skill and capability, and profit for the business.
Conducting kaizen activities early in a merger transition is critical to a successful transition and incorporation of a new team into an existing Lean organization. Through these activities, you can create faster cultural alignment among the organizations, rapid operational improvement, and smooth out the overall transition.
Initial conditions — before kaizen
The physical space for the router assembly challenge involved a three million square foot plant consisting of three interconnected buildings. One building contained wire manufacturing. Another building had component part manufacturing, final assembly, and material receiving. The final building housed finished goods storage and shipping.
Leadership approach
The new owners knew the existing work practices were not going to get the results they needed. They knew they had to change but weren’t sure how. A Lean approach, including kaizen activities, provided the way to achieve radical change and improved results.
Using hands-on instruction and learning-by-doing based in Lean, the workforce received new knowledge about how to approach and perform their job; they also learned how to identify and solve problems which were hidden in the current work practices. They learned new ways of thinking, which guided them in how they would continuously apply this new foundational knowledge. The use of Lean principles, practices, tools, techniques — in combination with new leadership behaviors and activities — enabled the team to achieve the results the new owners desired: increased value for the customer and improved profits for the business.
Perform instruction and training in short intervals. Create a high-touch — no-tech or low-tech instruction environment. Avoid committing students to death by PowerPoint. Spend less time in classroom and more time in gemba — learning by doing.
Current-state measurement system
The team, under the guidance of their sensei, conducted a collaborative two-week waste walk using a current-state value-stream map (created by the final assembly team). This walk provided them with empirical evidence of immediate areas of opportunity. The team found an abundance of all seven forms of waste (see Chapter 2), areas of constrained and no flow, no pull, lack of known standards, and standardized work. There were inadequate measures of safety, cost, quality, and delivery, and the majority of workers were unclear about what value they were delivering to internal and external customers and about how to create profit for the business. They also found evidence that the use of their Enterprise Resource Planning (ERP) system was causing product to be pushed through the production system, rather than pulled through it (see Chapter 11).
When they examined how the plant measured and tracked production progress, the team found many improvement opportunities. They discovered that current-state measurement disciplines were out of date and ineffective. Also, defect rates in final assembly weren’t measured, and controls for detection and prevention of production defects were ineffective. Defects were regularly reaching the final assembly area. Far too often, supervisors and managers were receiving erroneous signals that work was proceeding defect free and according to plan.
Constantly and consistently evaluate and question your measurement system and related standards. Be concerned if you constantly observe Good & Green; it usually signals opportunity for improvement. By challenging the status quo, you will create breakthrough thinking.
Kaizen: People, process, and attitude
The kaizen team was a diverse mix of personnel consisting of final assembly gemba workers, zone production manager, zone production planner, a Six Sigma Black Belt/Industrial Engineer dedicated to the target area, plus ad hoc members including a zone forklift driver, external suppliers, receiving warehouse, and finished goods warehouse personnel. The team challenged themselves to identify and eliminate waste, and produce pull and flow.
Team diversity creates perspective and enables shared vision (hoshin). Be mindful of team mix, knowledge, position, and skill diversity.
Constantly reflect (hansei) to guide the growth of new thinking. Apply the Socratic Method and constant reflection as core disciplines — before, during, and after kaizen activities. Ask questions like:
1. What should be happening versus what is happening?
2. What will be the measurable benefits of our improvement?
3. Is the improvement real or apparent?
Using the current-state VSM to guide improvement
The team built and validated the value-stream map (VSM) by applying the discipline of 3 Gen (see Chapter 13), walking both material and information VSM activities through the value stream. They began with the customer, continued through finished goods in the warehouse, proceeded to final assembly and moved through the rest of the operations until they arrived at the beginning of their value stream — the order entry process.
The team used simple inquiry, standardized worksheets, direct observation, and fact collection through measurement. The team also learned to identify and measure waste and to build alternatives to eliminate waste and prepare for kaizen activities to trial and test. The team began to see how the end-to-end value-stream was operating. The efforts exposed many problems throughout the value-stream between internal suppliers, internal customers, and ultimately the final customer. When problems were identified, they shared them with the teams across the value-stream, and addressed them through the hoshin kanri (see Chapter 13). At this stage, the team was enlightened, yet they were still pessimistic.
The value-stream mapping walk
The team found waste — muda, mura, muri — in all activities in the VSM and identified areas for improvement by going to gemba. They:
![]() Saw an increasing order backlog for 24/36 port router
Saw an increasing order backlog for 24/36 port router
![]() Measured the final assembly, test and pack out cycle time at 2.5 days
Measured the final assembly, test and pack out cycle time at 2.5 days
![]() Witnessed the absence of continuous flow and takt time — batch thinking prevailed (200 units per cart)
Witnessed the absence of continuous flow and takt time — batch thinking prevailed (200 units per cart)
![]() Discovered ineffective point-of-use stocking and replenishment system in final assembly
Discovered ineffective point-of-use stocking and replenishment system in final assembly
![]() Characterized an inattention to work station ergonomics, poor lighting, numerous industrial safety hazards — no 5S (see Chapter 11) present in final assembly area
Characterized an inattention to work station ergonomics, poor lighting, numerous industrial safety hazards — no 5S (see Chapter 11) present in final assembly area
![]() Noted the absence of standardized work
Noted the absence of standardized work
![]() Identified reactive, unclear scheduling throughout VSM causing inconsistent, unpredictable and uneven material delivery from internal suppliers to final assembly
Identified reactive, unclear scheduling throughout VSM causing inconsistent, unpredictable and uneven material delivery from internal suppliers to final assembly
![]() Witnessed an ineffective layout of final assembly area, where the proximity of final assembly work stations were between 5 to 20 feet away from each other
Witnessed an ineffective layout of final assembly area, where the proximity of final assembly work stations were between 5 to 20 feet away from each other
![]() Discovered reactive scheduling of light duty automated assembly process located in final assembly area
Discovered reactive scheduling of light duty automated assembly process located in final assembly area
![]() Observed no pull production planning and/or scheduling and no visual management or controls in final assembly area
Observed no pull production planning and/or scheduling and no visual management or controls in final assembly area
In short, the team saw that the final assembly process and its personnel were suffering from years of inattention and neglect. Reasons for defects and defect rates were unknown, problem escalation and resolution was unclear — and it all resulted in compromised assembly schedules.
True north thinking: The ideal state
After reflecting on what they observed in the current-state VSM, the team established new thinking that was radically different from the past. They created new passion for their ideal state and began the change. Kaizen thinking and the spirit of challenge began to take root. Even the nonbelievers slowly changed their thinking after they experienced the benefits of the improvements.
When considering process change, remember that 90 percent involves people and 10 percent is purely mechanics. Look past the mechanics. Be mindful of past conditions that are present, humble yourself, and look respectfully within the minds and spirits of the people in the area being improved; they have much to offer.
Future state — after kaizen
The team produced their hoshin kanri for final assembly, creating the plan through thoughtful reflection, intense detailed review and selection of alternatives to implement and test. The team’s mantra was two fold: “no wishful thinking or problem admiration allowed” coupled with “daily kaizen and challenge of current standards to eliminate waste.”
Outstanding results
The team redesigned the work area to produce an assembly work module, radically modifying the layout from batch to one-piece flow. The results were significant:
![]() Final assembly lead-time dropped from 2.5 days to 24 minutes.
Final assembly lead-time dropped from 2.5 days to 24 minutes.
![]() Final assembly work-in-process (WIP) was reduced by 98 percent.
Final assembly work-in-process (WIP) was reduced by 98 percent.
![]() Floor space required for final assembly was reduced by 65 percent.
Floor space required for final assembly was reduced by 65 percent.
![]() Material shortages dropped from 25 percent to 2 percent.
Material shortages dropped from 25 percent to 2 percent.
![]() A kanban system was installed with internal suppliers to create smooth and balanced material flow.
A kanban system was installed with internal suppliers to create smooth and balanced material flow.
![]() Customer order backlog was eliminated in two weeks with no overtime.
Customer order backlog was eliminated in two weeks with no overtime.
![]() Assembly work station proximities shrunk from feet to inches.
Assembly work station proximities shrunk from feet to inches.
Working the Lean way
The team achieved outstanding results through the direct involvement of gemba workers, production managers and all supporting suppliers. Key factors included the passion, skills, and knowledge of the workforce, their past struggles, and the team embracing new struggles created through learning-by-doing. New Lean behaviors took root:
![]() Takt time was calculated and daily production targets were developed and visually managed in the final assembly cell.
Takt time was calculated and daily production targets were developed and visually managed in the final assembly cell.
![]() Standardized work was created by the final assembly workers for use by themselves and production managers.
Standardized work was created by the final assembly workers for use by themselves and production managers.
![]() 5S was incorporated during work module design efforts.
5S was incorporated during work module design efforts.
![]() Daily kaizen activities became a behavioral norm.
Daily kaizen activities became a behavioral norm.
![]() External suppliers of purchased fasteners supported the implementation of a two-bin system for point of use replenishment and delivery.
External suppliers of purchased fasteners supported the implementation of a two-bin system for point of use replenishment and delivery.
![]() Daily shift stand-up meetings were held in the assembly area, with production managers present, and used new visual management display boards.
Daily shift stand-up meetings were held in the assembly area, with production managers present, and used new visual management display boards.
![]() A command center for problem escalation was formalized and began to remove problems from the gemba.
A command center for problem escalation was formalized and began to remove problems from the gemba.
![]() Production managers were constantly visible in the work area, looking to lend a helping hand and to manage countermeasure creation, root cause analysis, and problem resolution and prevention.
Production managers were constantly visible in the work area, looking to lend a helping hand and to manage countermeasure creation, root cause analysis, and problem resolution and prevention.
![]() Internal manufacturing suppliers were switched off in ERP, and ERP was re-purposed to accommodate kanban system. Unionized production schedulers were more than happy to re-purpose their daily activities and improve the new pull scheduling system in gemba.
Internal manufacturing suppliers were switched off in ERP, and ERP was re-purposed to accommodate kanban system. Unionized production schedulers were more than happy to re-purpose their daily activities and improve the new pull scheduling system in gemba.
![]() Final assembly applied a kanban system to create just-in-time (JIT) schedule with internal suppliers:
Final assembly applied a kanban system to create just-in-time (JIT) schedule with internal suppliers:
• New custom carts were created and new right-sized containers were purchased, a Limbo bar system was installed for injected molded parts, resulting in 100 percent on time/complete delivery.
• Plating and high speed stamping operations adopted pull planning kanban system synchronized to final assembly schedule.
• Component part inventory reduced from 12 days on hand to 2 days on hand for all internal manufactured parts.
![]() Light-duty automated assembly machine internal to the work module was scheduled using kanban.
Light-duty automated assembly machine internal to the work module was scheduled using kanban.
![]() Unnecessary inventory was reduced by 15 percent.
Unnecessary inventory was reduced by 15 percent.
![]() Ergonomics and other associated burdens were addressed during work module design by the workers, with production management support.
Ergonomics and other associated burdens were addressed during work module design by the workers, with production management support.
Ensure that the results of a localized kaizen activity, like this one, do not produce unintended consequences, burdens and waste elsewhere in the value stream. Take time to 3 Gen, understand how your part contributes to and impacts the whole value stream, and share your improvement ideas with other areas. The goal is real improvement of the overall value stream.
Lean Reduction of Call Center Attrition
Financial services organizations, like many industries, rely on call centers for customer service and first call issue resolution. Consumers form opinions about a company based on their experiences with these call centers. Ultimately, many consumers make purchasing decisions because of these experiences. Companies know they need to ensure call center employees are well trained and are representing their companies in the best light.
One Fortune 100 financial services organization had 5,000 call center employees working globally. They had a retention issue: the average employee annual turnover rate was 55 percent. This sky-high turnover cost the company millions of dollars in recruiting, on boarding, and training new staff, plus they were putting the customer experience at risk with the constant influx of new employees.
Senior leaders recognized that they had to do something to change the revolving door on their call centers. They sponsored a Lean project — and they threw in an extra challenge: improve the situation in 4 weeks! Elissa Torres, a Master Black Belt and Lean practitioner, worked with a cross-functional team to understand and find ways to immediately reduce the on-boarding cycle time and increase value-added tasks. The team included members from the core business process, as well as human resources, information technology, and the training department.
Characterizing the problem
As the team began their investigations, they immediately found that the new hires with 4 to 7 weeks seniority had the highest rate of attrition. The team conducted exploratory discussions with employees, leaders, and trainers, using affinity diagrams (see Chapter 12). As the conversations progressed, a central theme emerged in these focus groups: the delay in obtaining required system access to complete the on-boarding processes. This included simple things such as signing up for benefits and obtaining the system access needed to perform job functions.
As part of the Plan phase (see Plan-Do-Check-Act or PDCA in Chapter 9), the team then narrowed the scope of their project. With management support, they narrowed their focus to reducing the time required to on-board an employee, particularly the time required to obtain all system accesses to enable them to perform their job. Next, the team met for 3 days and began mapping the processes that enabled system access for newly hire employees. The team found that an average new hire had to be set up and have access to in seven different systems in order to perform their job. Each of these processes could take as few as 5 days — but it could also take as long as 65 days!
 Make sure you truly define the scope of a project, understand the process, and identify root cause in the Plan phase. Otherwise, you will waste time, effort, and resources solving the wrong problem. You will also not take advantage of the acceleration of improvement initiatives the Lean enables.
The team summarized the process maps into a graphic showing the high-level value-stream steps — making the larger barriers to cycle time more visible. Figure 16-8 displays the high-level value-stream format in Excel. This graphic captures the value-stream process steps and related information such as data from reports, timing, important notes, types of waste identified at each step, pain points, and opportunities.
Figure 16-8: High-level VSM in Excel.
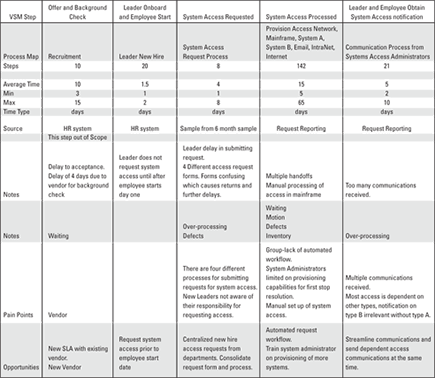
After the team created and categorized their VSM, they found the biggest non-value-added culprit was one of the seven forms of waste: waiting. Then they had to understand why there was so much “waiting” happening. What they uncovered was that the inventory of system access requests was in a backlogged work queue because a required manual process was understaffed.
The Lean team’s solution
As the team moved through PDCA, they brainstormed short-, medium-, and long-term solutions to reduce the time required to on-board an employee in the call center. Each team member was accountable for expanding on their assigned solution for review with the stakeholders and executive sponsor within one week.
They established reporting baselines for each of the systems and created a weekly scorecard for tracking progress and changes. The team began implementing the first short-term solutions by the end of second week, and the final automated solution was implemented within 60 days. In addition to focusing on the system access processes, the training department reconfigured their curriculum to be more hands-on before the employee had to work in a full production environment.
To ensure that they implemented solutions in a timely manner, over the life of the project, the team established a weekly scorecard for all of the system access types and monitored them throughout the deployment of solutions. The team also knew the importance of measurement to ensure that the project gains were sustained over the long haul. They implemented controls in the business processes and systems to monitor performance over time.
Always measure your progress, both during the project implementation and as part of the standardized work. It keeps your implementation on track and ensures your project solutions are sustainable over time.
Here are some of the results the team achieved:
![]() System access process went from a range of 5 to 65 days to a range of 1 to 4 days.
System access process went from a range of 5 to 65 days to a range of 1 to 4 days.
![]() The new target for average cycle-time was set at maximum of 3 days and was tracked on a weekly scorecard for new hires.
The new target for average cycle-time was set at maximum of 3 days and was tracked on a weekly scorecard for new hires.
![]() The attrition rate for new hires for the call center immediately fell from 65 percent to 40 percent.
The attrition rate for new hires for the call center immediately fell from 65 percent to 40 percent.
![]() Training time decreased from 6 weeks to 4 weeks and reduced the learning curve by 15 percent, after they implemented the new hands-on curriculum.
Training time decreased from 6 weeks to 4 weeks and reduced the learning curve by 15 percent, after they implemented the new hands-on curriculum.
Because the solution worked so well for the call center, the company decided to implement them across all other new hire platforms. This resulted in a savings and cost avoidance of over $10 million dollars. The improved processes also increased organizational effectiveness and addressed employees’ concerns that they did not have to tools to do their job.
..................Content has been hidden....................
You can't read the all page of ebook, please click here login for view all page.