Chapter 7: Top 12 Productivity Tips for WebStorm and Angular: Part 2
by Todd Motto
This chapter on WebStorm and Angular was sponsored by JetBrains. Thank you for supporting the partners who make SitePoint possible.
In this two-part series on WebStorm and Angular, Google Developer Experts Jurgen Van de Moere and Todd Motto share their 12 favorite productivity tips for developing Angular applications using WebStorm.
In this second part, Todd shares his personal top seven WebStorm features that allow him to increase his WebStorm and Angular productivity on a daily basis:
- Use Import Path Calculation
- Live Templates
- Run Tests within the IDE
- Travel through Time
- Use TypeScript Parameter Hints
- Navigate using Breadcrumbs
- And using WebStorm to look up Angular Documentation
Each WebStorm and Angular tip will power up your productivity while developing Angular applications in WebStorm. Let’s explore these tips.
Ahem, Excuse Me ...
Before we get started: when making changes to settings, remember that WebStorm allows you to change Settings/Preferences at an IDE scope and at a project scope separately.
WebStorm and Angular Tip 6: Import Path Calculation
By default, WebStorm will resolve your import paths relative to the file. This setting will satisfy most projects and avoid unnecessary path editing. It’s also the method used for projects generated with the Angular CLI.
What’s fantastic about WebStorm is that you don’t have to type these import statements yourself! When you need to use a construct that would usually be imported, just type it where you need it. WebStorm will either suggest the construct to import through the AutoComplete context menu, or highlight the construct and give you the option to import it by pressing option + enter. WebStorm will create a new import statement at the top of the document for you, or add the construct to an existing import group that’s using the same source library.
WebStorm gives you other specialized options to handle your imports. For projects that require it, you can instruct WebStorm to calculate import paths relative to the tsconfig.json file location. If you decide to roll up your exports using a barrel index.ts file to import your components (read more about the Barrel technique) then you can use use directory import (Node-style module resolution). This will use the Node.js module resolution strategy, instead of TypeScript’s classic module resolution strategy.
When importing submodules that don’t require the entire module to be imported, add that module to the Do not import exactly from list. WebStorm will skip the specified path during the automatic import. For example, instead of having:
import {Observable} from 'rxjs'
… adding rxjs to the list yields:
import {Observable} from 'rxjs/Observable'
WebStorm skips the RxJS module and imports the Observable submodule automatically for you!
Extra Tip!
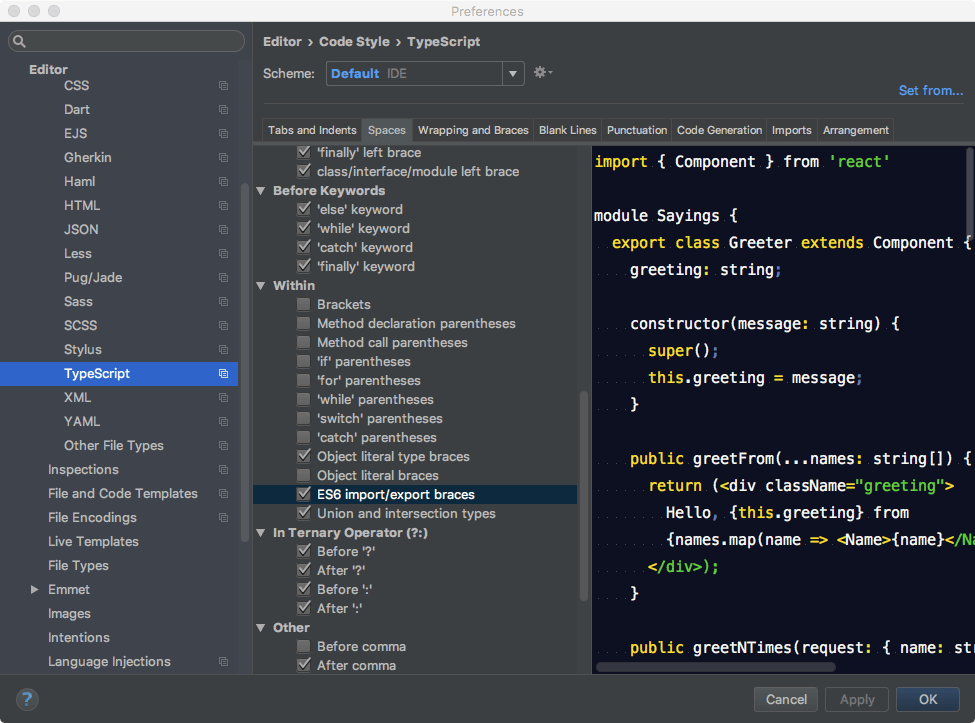
Format input to use space inside curly braces in Preferences > Editor > Code style > TypeScript – Spaces – Within - ES6 import/export braces
WebStorm and Angular Tip 7: Use Live Templates
When you find yourself writing certain patterns of code repeatedly, create a Live Template to quickly scaffold the block of code. WebStorm already comes with some predefined Live Templates that you can modify to fit your development style.
To create a Live Template, navigate to the following locations:
- [macOS] WebStorm > Preferences > Editor > Live Templates
- [Windows / Linux] File > Settings > Editor > Live Templates
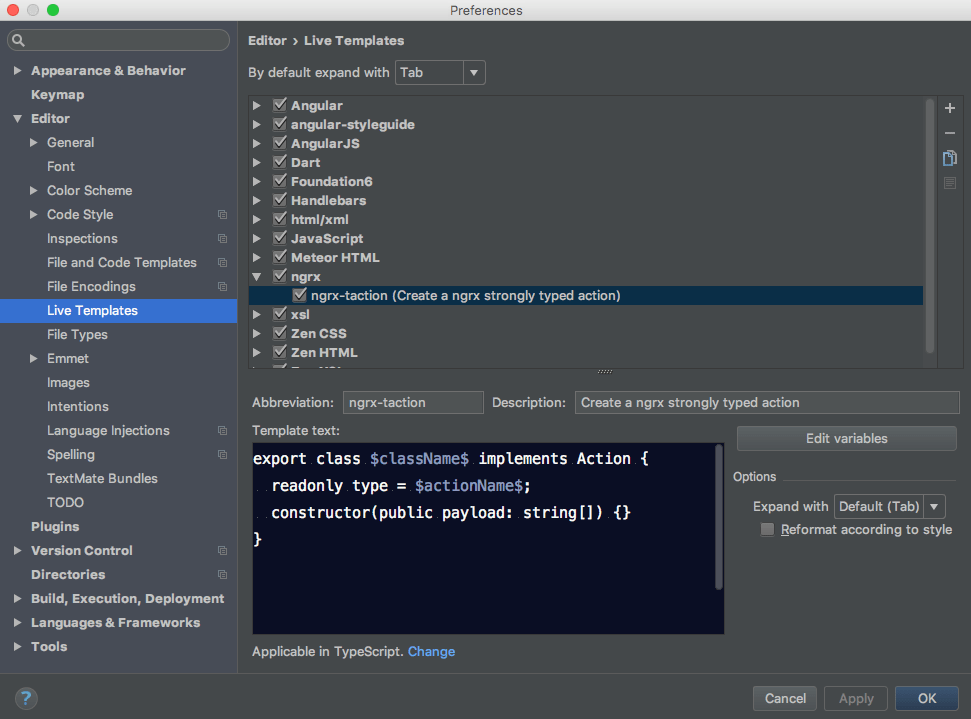
You’ll see that WebStorm has already bundled the predefined Templates into categories. I created a category to bundle my ngrx Live Templates by clicking on the + sign and choosing Template Group. I then created a new Live template within it by clicking on the + sign again, but choosing Live Template this time.
Let me walk you briefly through the elements that make a Live Template a productivity success:
- Abbreviation: the shortcut you’ll type into the editor to invoke your template.
- Description: tells you what the template does when invoked.
- Template text: this is the code fragment to be scaffolded upon invocation. Take advantage of the powerful Live Template Variables that allow you to replace them with your desired text upon scaffolding.
- Context: choose in which language or pieces of code WebStorm should be sensitive to the Template.
- Options: define which key will allow you to expand the template and reformat it, according to the style settings defined on WebStorm > Preferences > Editor > Code Style.
You’re ready to try out your template. Open a file that honors the context you defined and type your shortcut, press the defined expansion key and watch your template appear for you! If you defined any variables, the cursor will be placed where the first variable should be entered. If there are other variables defined, you can use tab to navigate to them — no need to click.
WebStorm and Angular Tip 8: Running Tests
WebStorm is an excellent testing tool. You can run a variety of JavaScript tests right from the IDE, as long as you have the Node.js runtime environment installed on your computer and the NodeJS plugin enabled. Here are some productivity tips when running tests.
You can run single Karma tests as opposed to running them all. Click the icon next to the test in the editor and select Run or Debug. The icon will show the test status.
Run and debug tests with Protractor right from the IDE. Make sure that Protractor is installed globally. Test results will be presented in a tool window. You can filter the test results and opt to only display failing tests.
As an extra tip, you can test RESTful services right from the IDE! Go to Tools > Test RESTful Web Service.
WebStorm and Angular Tip 9: Travel through Time
This is an area where WebStorm can save the day. You may have coded many new lines non-stop and forgotten to commit your code to version control periodically — or to initiate it at all. It happens. Whatever the context, there are situations where we need to go back in time.
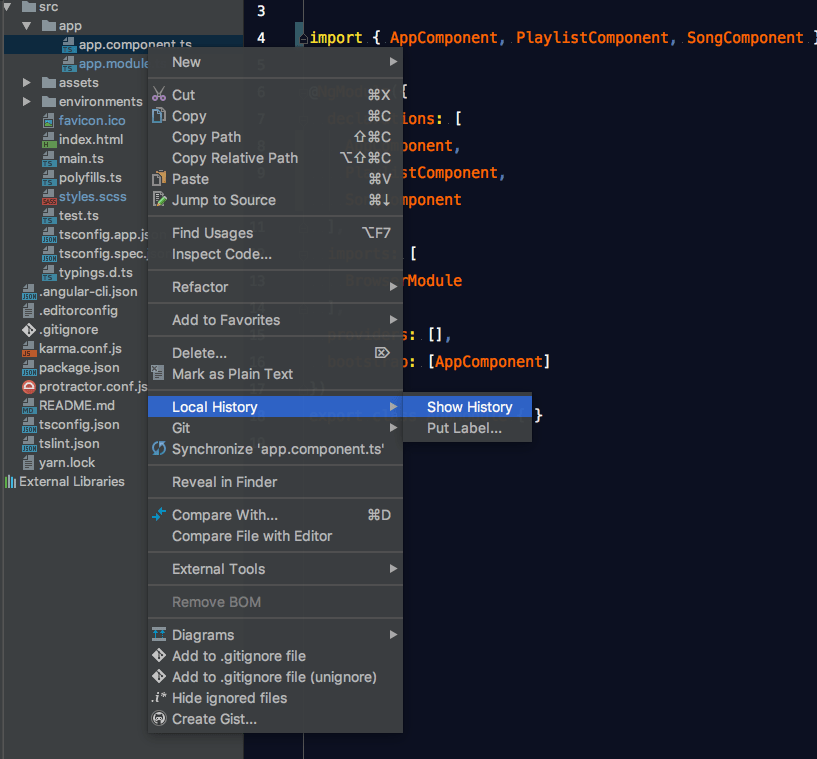
We can use “Undo”, but WebStorm has a default limit of 100 undos. This limit can be increased, but there’s a better way to restore a previous state: using Local History.
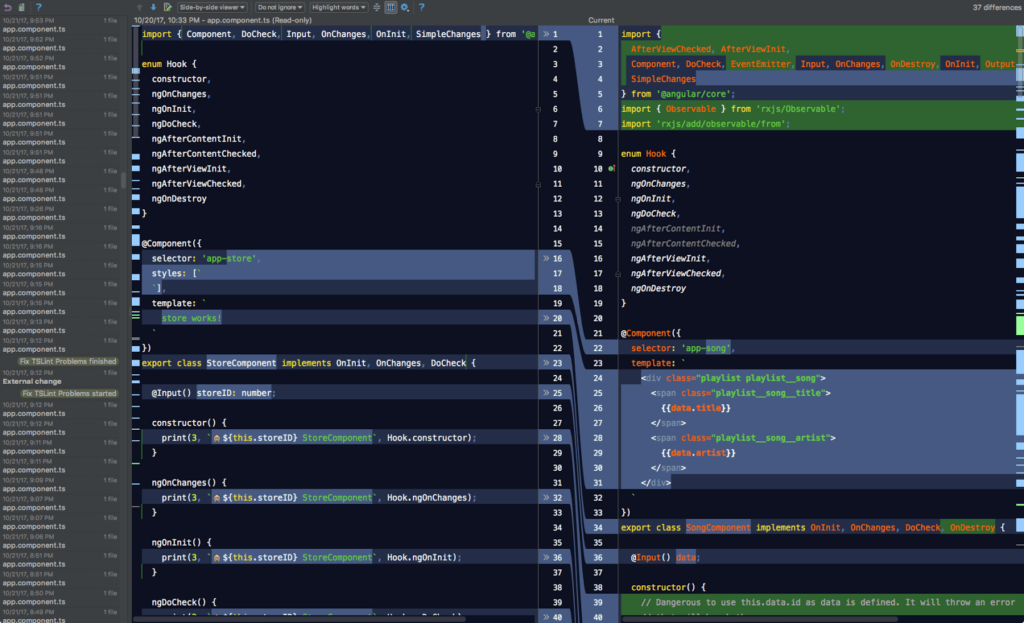
With Local History, you can navigate through snapshots of your code to visually find the codebase state that you want to reach. It’s similar to version control, contrasting current state with previous state side by side. (A Unified Viewer is also available.) However, Local History is independent from version control: you can use it even if you haven’t initiated git, for example. The snapshots will be easy to navigate, as they’re sorted by time — from newest to oldest.
WebStorm and Angular Tip 10: TypeScript Parameter Hints
TypeScript parameter hints show the names of parameters in methods and functions to make your code easier to read. By default, only certain parameter hints are shown based on their type, and some hints for common methods are hidden.
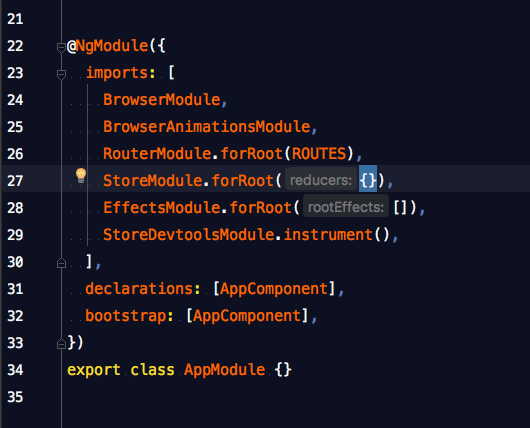
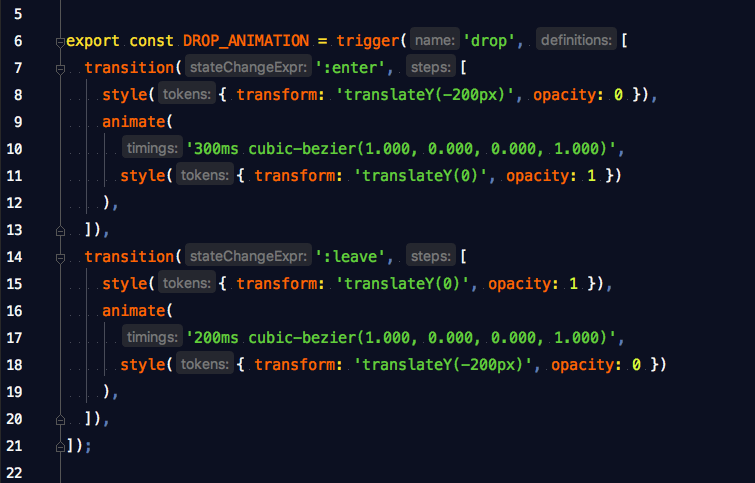
To avoid distractions, you can blacklist parameter hints so that they aren’t shown for that method again in the project. You can also enable all parameters or disable them completely. To show parameter hints for all arguments:
- open the Appearance page in WebStorm > Preferences > Editor > General > Appearance.
- Click Configure next to the checkbox labeled “Show parameter name hints”.
- In the Options box, you can select “Show name for all arguments”.*
Also Available
In this same dialog box, you can modify the parameter hints blacklist.
WebStorm and Angular Tip 11: Navigate using Breadcrumbs
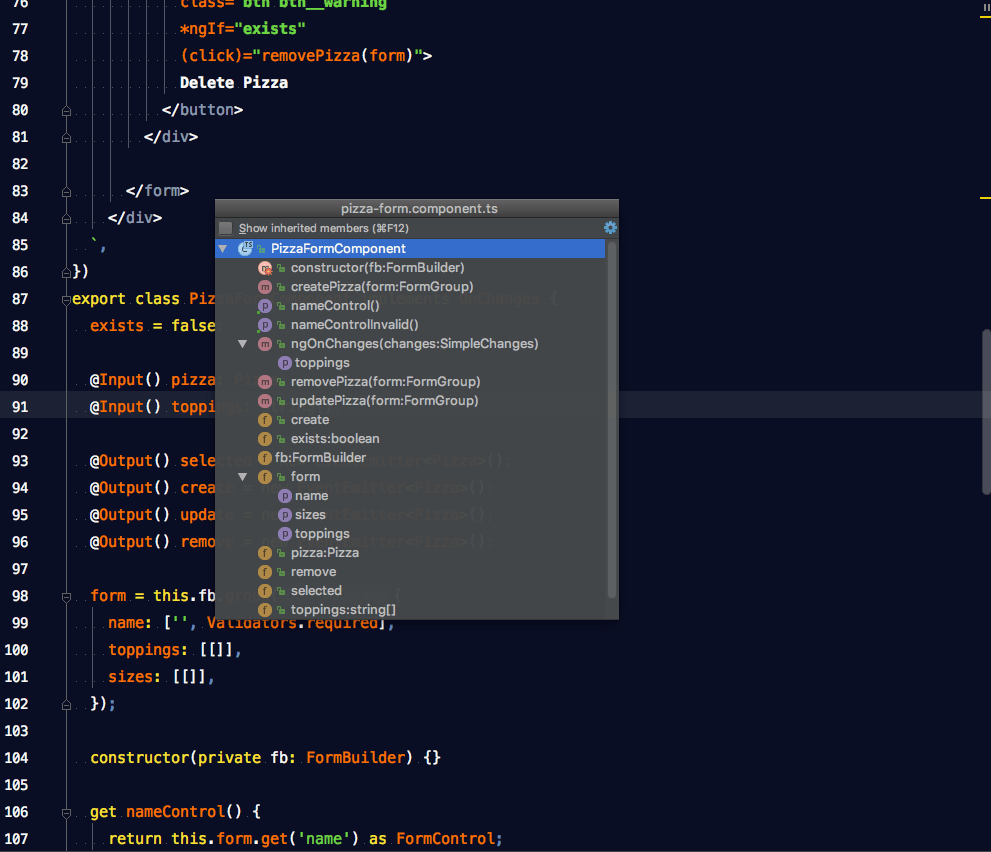
Looking at the bottom of your .ts file, you can see your location in the current file with breadcrumbs. Breadcrumbs show the names of classes, variables, functions and methods. Click on the name of a breadcrumb to jump to the parent object. You can configure them to show at the top of the editor, or not at all, by right-clicking on a breadcrumb and then clicking Breadcrumbs > Top or Breadcrumbs > Don't show.
As an alternative, you can navigate a file by using the File Structure popup window. It can be accessed through Navigate > File Structure or by pressing CMD + F12 on macOS and Ctrl + F12 on Windows/Linux.
WebStorm and Angular Extra Tip 12: Documentation Look Up
There’s no need to leave the IDE to get deeper information on what Angular is doing.
As long as WebStorm has documentation for the Angular construct in question, you can place the cursor on an Angular method or function, and press F1 to quickly view documentation for it. This also works for modules and other Angular constructs.
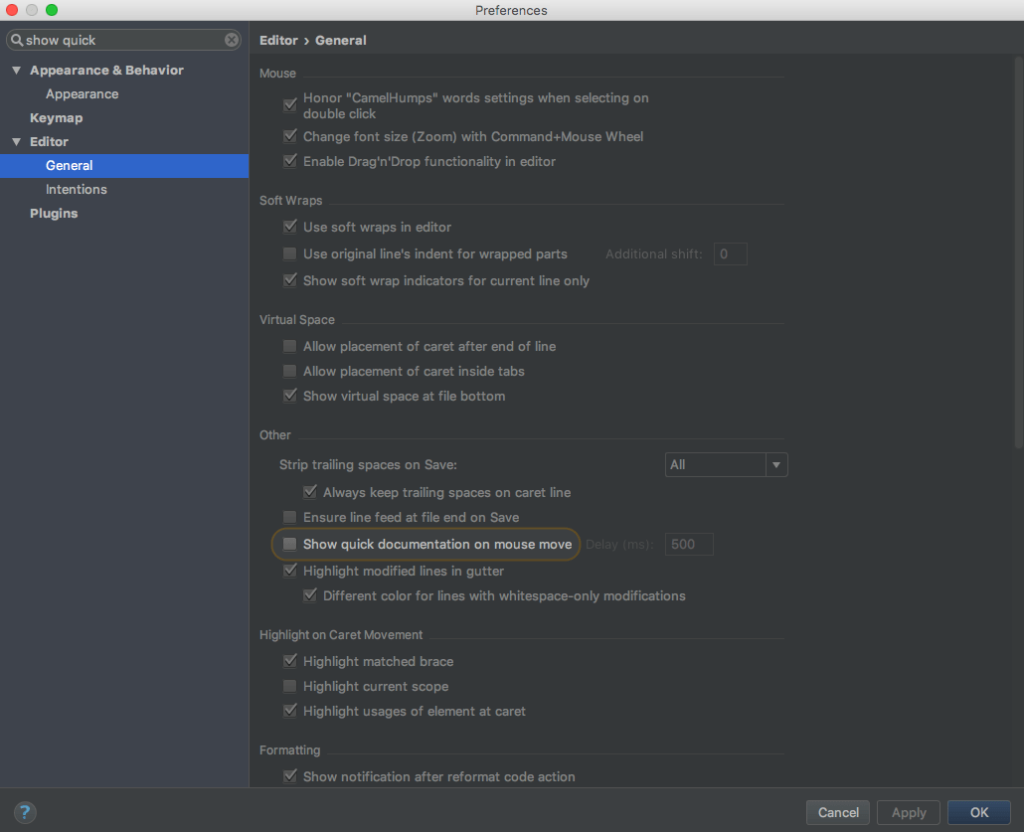
Another quick way to invoke documentation is to rest the mouse over a construct. In Preferences > Editor > General, check the “Show quick documentation on mouse move” box. You can adjust the time delay before the quick documentation is invoked.
As a last word: don’t just follow these tips! Measure their results. WebStorm allows you to get a Productivity Report in Help > Productivity Guide. You can see how much typing code completion has saved you!
Summary
Let's recap Todd’s personal tips for increasing Angular development productivity in WebStorm:
- use efficient import techniques
- use Live Templates to scaffold code patterns quickly
- run and monitor a wide variety of tests within the IDE
- use Local History as an independent, personal, real-time version control system
- improve the readability of your code by using TypeScript parameter hints
- navigate to a file quickly by using Breadcrumbs or the File Structure tool
- look up Angular documentation right from the editor.
This concludes our WebStorm and Angular productivity tips for developing Angular applications with WebStorm by Google Developer Experts. You’re now empowered to streamline your development workflow and make the most of your time at the keyboard.