
ML Ops: Operationalizing Data Science
Would you spend many years and big money training athletes and then send them to the Olympic Games, only to make them stay in their hotel instead of competing?
“Of course not,” you say. “That would be ridiculous. Nobody would do that.”
You’re right. It is ridiculous.
But if you’re spending a lot of time and money developing and training your analytics and machine learning (ML) models without getting them into production—be that because of operational difficulties or because models are not consistent with applicable regulations and laws—aren’t you making the same mistake? Models that do nothing more than provide static insights in a slideshow are not truly “operational,” and they don’t drive real business change.
You’re probably not setting your models on the shelf deliberately. There are plenty of reasons why so many models—by some estimates, more than half—don’t make it into production. But if they’re not in production, they can’t do what you’ve trained them to do.
ML Operations, or ML Ops, is the process of operationalizing data science by getting ML models into production—being able to monitor their performance and ensure they are fair and in compliance with applicable regulations. The four main steps in the process (Build, Manage, Deploy and Integrate, and Monitor) form a repeatable cycle for handling models as reusable software artifacts. ML Ops ensures that models continue to deliver value to the organization, while also providing critical insights for managing the potential risks of model-based decision-making, even as underlying business and technical conditions change.
In your organization, what does it take to operationalize the ML models that make up your data science initiatives? You may have data science and ML, but do you have ML Operations? Have you created the processes needed to get your models from the data scientists who first develop them all the way to the applications that make advanced analytics available to the business? Are your models fair, and do you understand why specific predictions are made? Can you efficiently manage new (“challenger”) models under development as well as current (“champion”) production models, and have you implemented versioning and approval processes to support your ML Operations? Who else—line-of-business (LOB) managers, application developers, data engineers, DevOps, IT—is involved in the ML Ops life cycle in your company? Do you think about it as a life cycle? All of that is ML Ops.
Based on the experience of numerous projects across the globe, this report introduces concepts that enable you to realize business value by operationalizing machine learning models. It presents a practical, four-step approach (Build, Manage, Deploy and Integrate, Monitor) for realizing the value of data science and machine learning by creating ML-infused applications within your organization. The report is designed as an overview of the capabilities needed to operationalize data science and machine learning pipelines so that you can ultimately create business applications using AI and ML technology. Readers will benefit from real-world case studies and the perspectives of data scientists on how best to operationalize data science.
Analytics leaders, application developers, data engineers, line-of-business (LOB) executives, IT managers, and business analysts regularly come into contact with models at various points as AI applications are developed and data science pipelines are operationalized. Here are the most important things readers will learn from this report:
-
In its life cycle, an ML model is developed and improved in an analytics pipeline or workflow that touches stakeholders all around the organization. Realizing the value of data science and machine learning is a matter of reducing friction throughout those pipelines and workflows.
-
ML models need constant refinement. They include data transformations and embody relationships with continually changing data that impact the accuracy of their predictions. As such, operationalizing ML pipelines has management implications that are different from those of traditional software application engineering. In particular, long-term accuracy depends on periodic tuning, retraining, and even complete remodeling.
-
ML models that are people-facing must be unbiased, fair, and explainable; that is what the public demands and what regulatory agencies and bodies increasingly require. For such applications, the ML Ops life cycle must be designed to enable transparency and explainability.
-
Operationalizing models means not only reducing their friction in deployment of the pipeline but also embedding them in a business system. Frequently, the environment in which models are developed is quite different from the environment in which they are ultimately deployed. Integration of predictive models into external systems is an area that is not only complex but also less standardized than other aspects of the ML life cycle.
-
Smart organizations currently think about and structure their data science and machine learning pipelines in four steps: Build, Manage, Deploy and Integrate, and Monitor.
An Introduction to ML Ops and Operationalizing Data Science Models
ML Ops is an outgrowth of existing well-documented data science and machine learning processes—for example, CRISP-DM—that align advanced analytics with the needs of the business. However, these established processes largely cover the model development process and do not address the needs of operationalizing those models within business systems.
What Is ML Ops?
ML Ops is a cross-functional, collaborative, continuous process that focuses on operationalizing data science by managing statistical, data science, and machine learning models as reusable, highly available software artifacts, via a repeatable deployment process. It encompasses unique management aspects that span model inference, scalability, maintenance, auditing, and governance, as well as the ongoing monitoring of models in production to ensure they are still delivering positive business value as the underlying conditions change.
The organization needs to look at realizing the value of data science and machine learning models as a whole, rather than as simply a process of developing models. As shown in Figure 1, ML Ops involves four conceptually simple steps, but the complexity is certainly in the details.
In practice, in many organizations business stakeholders and data scientists sometimes focus most of their attention and resources on building models, rather than—and perhaps at the expense of—considering how to operationalize all critical steps of the entire data science process.
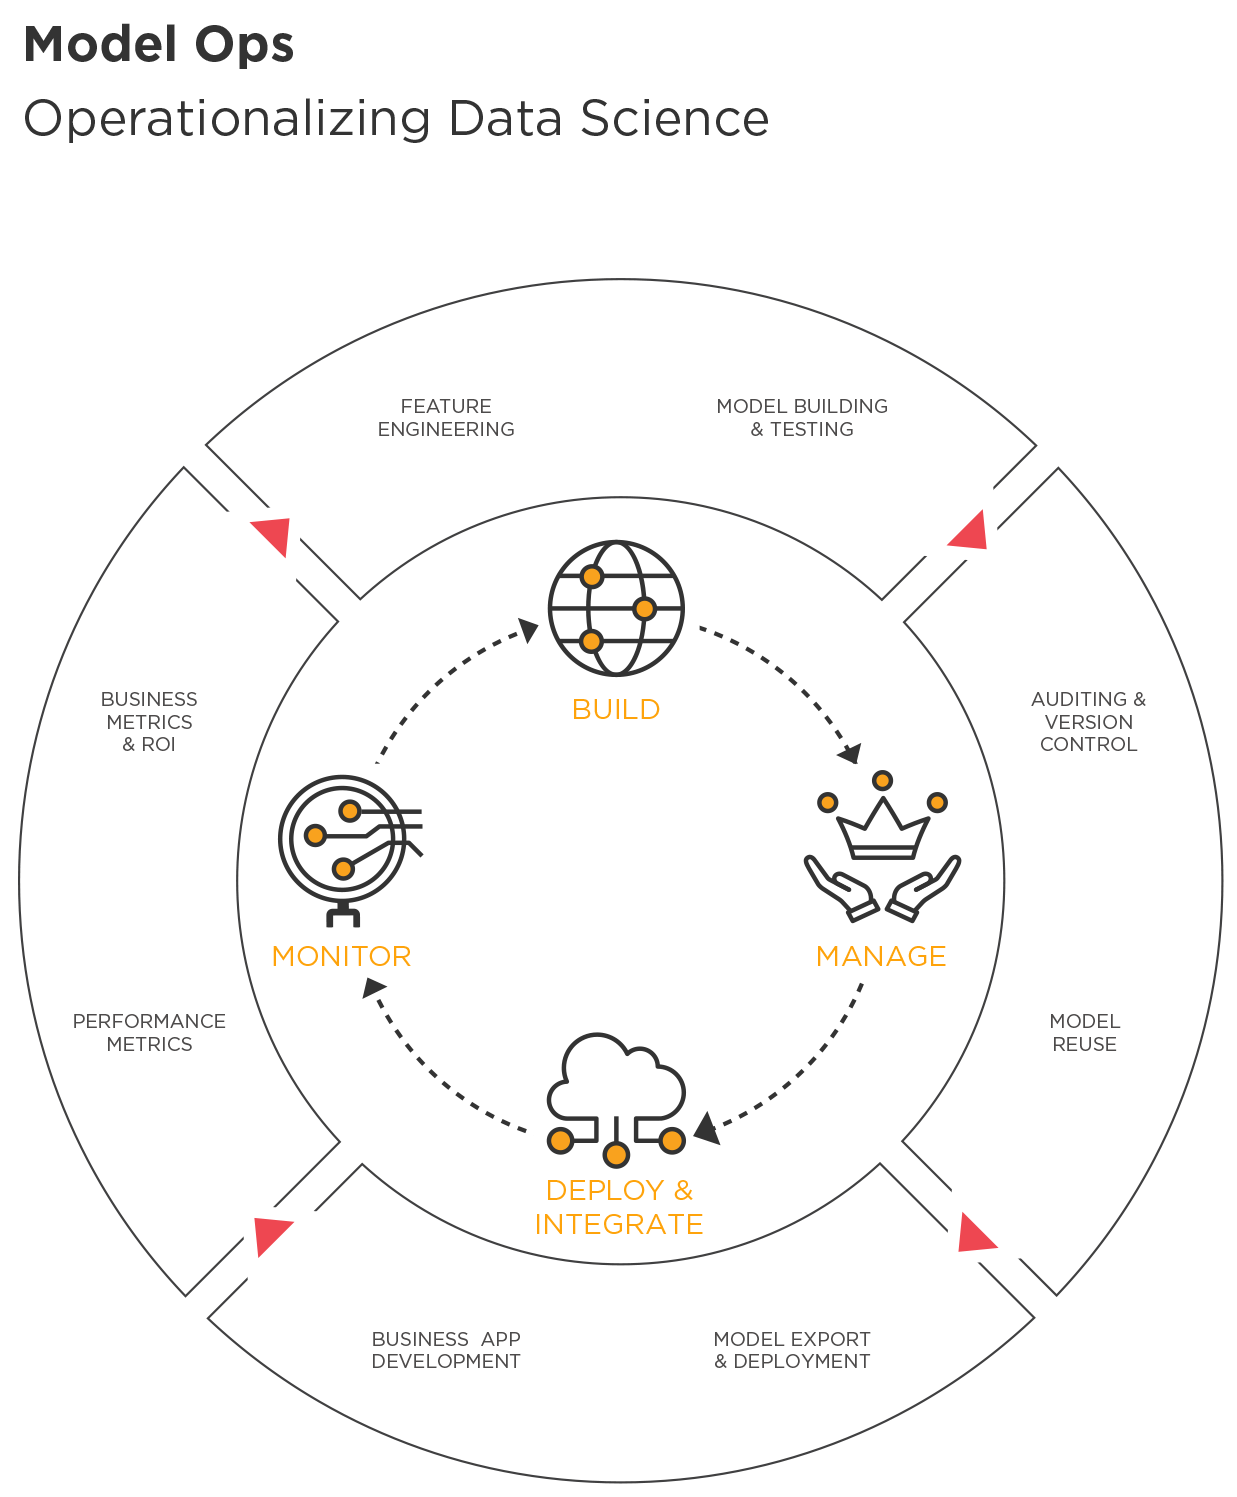
Figure 1. Steps in the process of operationalizing data science
The ML Ops Pain Point: Time to Deployment
ML models need to be embedded and running in a business system so that their predictions have an impact on the business. But models of any kind—whether they are models that reduce customer churn, optimize real-time pricing, create targeted marketing campaigns, or identify fraud—are affected by obstacles to operationalization.
A common obstacle is the long delay between initiating a data science project and deploying the model so it can make predictions. The delay often leads to having a model in production that no longer conforms to the reality of real-world data, as in the following example.
A few years ago, the authors worked on developing models around customer turnover (“churn”) for a major US mobile phone company. The original models were developed with legacy analytics software, using data from an MPP database. The volume of data was quite high, and it needed to be sampled, extracted, transformed, and loaded (ETL) into the modeling server, which required coordination with the database administrator. Then, after a period of development and training, the models were finally converted into SQL so they could be used for scoring against the original data within the database. The entire process—from extraction through prep, modeling, and evaluation to deployment—took about four months. That meant that the variable the model was supposed to predict wasn’t “Will this customer churn?” but rather “Will this customer churn had we evaluated her (via a predictive score) four months ago?” The data was old, and the model was insensitive to often rapid changes in the business environment.
So what was taking so long? It did not take much time to develop the models. But the upstream and downstream activities were vastly more time-consuming. Clearly, there was an urgent need for as much effort and sophistication to go into streamlining the ML Ops process as had gone into creating the models themselves. We were able to prove statistically that operationalizing these models more rapidly would provide a huge “lift” to the accuracy of the models with current customers and would identify many more at-risk customers.
That delay led to one type of pain point. Considered more broadly, the pain in the organization sounds like this:
“We run a software application that relies on decision points generated by predictive models. How do we build that application and those models to handle all of the data and variables that go into useful predictions? How do we apply standards and approvals to manage multiple versions of models, with varying levels of performance, accuracy, and security? How do we take models from individual developers writing in Python and deploy those models into an executable form that can be integrated into our various application environments? How do we monitor the model so that it is fair and also continually keeps up with changing market conditions to deliver accurate predictions for our application? Finally, how do we accomplish all that and ensure that all the work we’re putting into data science and machine learning models pays off?”
What, Really, Is a Model?
Deploying models is rarely about deploying just the predictive model in its purest form. Much more often, the model also includes a number of transformations and business rules that can get in the way of operationalizing ML.
Consider again the example of a model designed to make predictions about churn among cell phone subscribers. The data scientist includes central variables such as these:
-
Account balance
-
Recent phone usage
-
Number of other subscribers, if a family account
-
Residence
-
Age
These variables already exist in the raw data, without additional calculations or minor cleanup. They may be relevant to the possibility of churn (an account balance in the red may be a risk factor), but by themselves they may not be the ideal predictors. An even more useful variable for highlighting propensity to churn may be phone usage in the past seven days compared to the overall weekly average for the life of the account. But a data point like that would not likely come straight out of a database. It would be necessary to start with raw data and then combine and transform the inputs to arrive at the more useful variable.
Or consider a predictive model for setting the price of books in an online marketplace. All other things being equal, demand is proportional to the price of the book. But all other things are not always equal, which is why doubling the price does not always halve the sales volume. Transformations must be introduced to account for the non-linear relationship between price and sales volume, which requires a transformation that must accompany the pricing model.
Thus, the model is the sum of itself plus all transformations. The whole must be managed as an artifact throughout the pipeline and during the model’s entire life cycle.
Introducing the Four-Step ML Ops Approach
Companies determined to successfully operationalize their ML models think of ML Ops in four main steps:
- Build
-
Data scientists use languages like Python and R, as well as commercial applications, to create analytics pipelines. They use standard machine learning algorithms, they build predictive models, and they perform feature engineering to create the transformations most likely to boost the predictive power of the ML model.
- Manage
-
Models have a life cycle that is best managed from a central repository where their provenance, versioning, consistency with regulatory rules and policies, approval for production, testing, deployment, and eventual replacement can be tracked. Besides the metadata associated with model artifacts, the management platform and the repository should track accuracy metrics as well as links between models and datasets.
- Deploy and Integrate
-
In this step, a data science pipeline is taken from its original development environment and expressed in a form that can be executed independently and integrated into business applications. For example, a model developed in a Python Notebook may need to be converted into SQL code for execution in a Teradata database. At TIBCO, we’ve created mechanisms for exporting visual data science workflows as Java code (for example), which can then be embedded into application code. Additionally, model artifacts can be accessed via REST frameworks and APIs. Modern ML Ops architectures also may support containerized deployment of model artifacts to public or private cloud environments, enabling much faster time to production as well as flexible scalability and elasticity in support of highly variable scoring demands. In the end, you need to be able to deploy the pipeline in a format/language that is appropriate to the target runtime environment, consistent with your business requirements.
- Monitor
-
After a model has been deployed, it is monitored for the accuracy of its predictions, as well as model fairness and other important business criteria, to provide full visibility into general business impact. Such monitoring can be done via BI tools connected to predictions and model inputs, or it may take the form of regularly scheduled reports on all critical business key performance indicators (KPIs). Accuracy and other KPIs can be improved manually, through occasional iteration with input from a human expert, or automatically, through ongoing retraining and champion–challenger loops with approval by a human, for example.
The following sections explore each step of the pipeline through the questions most organizations ask themselves.
Build
In the build step, data scientists examine the data landscape to ensure a close fit between the data the model will use in training and the data it will use once deployed in the real world. They then use various development platforms (Python, R, commercial IDEs with drag-and-drop workflows, etc.) to create machine learning and data pipelines. Through feature engineering, they analyze variables for the transformations that make the ML model more powerful. They then test and train the resulting models until accuracy has reached the level beyond which it would not be beneficial to continue tweaking or adding data, features, or algorithms.
Data Considerations: Structures and Access
How close is our training data to the data that the model will see in real life? And how can we be sure that the models will be able to access similar data structures in both places?
Models usually need to be trained on data that is extracted from real-time systems and warehoused offline. But after training, the model deployed for the application may run online against real-time streaming data. If the data structures and even the programming languages change between training and operational modes, that difference complicates the ML Ops process and can affect the usefulness of the model.
Of course, the model’s usefulness depends heavily on the data on which it has been trained. So if the model is meant to run on a website in JavaScript on streaming data, then training it on an offline cluster in PySpark may provide access to a rich set of historical clickstream data, but it will make the deployment process much more complex. These fundamental differences between development and production environments are not just common, but often inevitable. When creating business applications, data scientists, data engineers, Model Ops engineers, and application developers need to work closely together to understand what elements will be available in production environments.
In the real world, access to the data—at design time versus runtime—is also important. A financial model, for example, might perform text analytics on recent analyst reports to predict whether the price of a given stock is more likely to rise or fall. Adding metrics gleaned by carefully processing the language in these documents may well make the resulting model much more accurate when tested “in the lab.” But for high-frequency trading models, it would not be possible to analyze text from the latest news feeds rapidly enough, so the data scientist needs to consider whether the models will have access to a cache of recent text metrics or whether it’s reasonable to include such variables at all.
Feature Engineering
How do we create new variables that give us more accurate models? Can the variables be replicated in an operational environment?
In feature engineering, data scientists analyze variables in the data to determine what transformations could be applied to these variables as well as what new variables could be created that would increase the predictive power of a machine learning model. From a deployment point of view, it is critical that important features that have been engineered in this way can be reproduced in the operational system.
For example, consider a generalized linear model (GLM) for generating premium quotes on insurance policies. The model starts with the data that users enter to the insurance company’s web portal and then it applies transformations to calculate a premium discount for the customer’s market segment and return a quote to the user. The raw data entered must be converted to the model input formats. For example, a numeric entry for the user’s age is bucketed into age band, and other entries are converted into the features and units required for the model, and then they passed into the currently active model. In production, all of those transformations must take place on the event stream of user data coming in from the web portal.
Geography and jurisdiction are also factors in feature engineering. Consider variables like age or postal code, which may contribute to accuracy but which local laws and accepted standards of fairness might preclude from use in an ML model for a marketing campaign. Thus, some features that are not universal should be combined with geofencing—the use of radios and networks to define a boundary—at the application level to ensure they are not active in prohibited times and places. Although there are various philosophies on how to approach this, more often than not, organizations use the most restrictive policies for all of their needs. (At TIBCO, we believe that all software tools should enable the greatest flexibility for compliance with regulations like the European GDPR rules, the US HIPAA laws, or the EU Guidelines on Ethics in Artificial Intelligence. A global adherence to broadly accepted standards like these seems like the best and simplest way to ensure privacy and fairness consistent with local rules and cultural values, now and in the future as predictive modeling technologies continue to advance at a rapid pace.)
Complexity affects feature engineering because while complex features may yield greater accuracy, they usually come at some cost. Weather data could improve a model used in agriculture, but not all relevant inputs are accessible in an operational environment. Similarly, text analysis could be used to train a model to understand language, but if the memory requirement is too great, it will hamper performance once the application is implemented. Some models depend on an interaction of terms, in which pairs of variables are combined to express business drivers that work in concert; however, an explosion of all possible combinations may degrade performance (and lead to “overfitting”).
Finally, complexity ties into explainability, the idea that technical professionals should be able to use the structure of a model to gain business understanding and to account for the accuracy or inaccuracy of models to decision-makers and consumers. Explainability plays a role in helping everyone along the ML pipeline understand how models arrive at their predictions. An example of explainability that relates to ML Ops is a reason code that explains why a model has denied credit to a given applicant. Explainability in ML Ops is important because, as the features that go into a model grow more complex, it becomes more difficult to explain the model’s predictions.
Model Testing
How do we test our models in a way that reflects the production environment?
Like debugging in the context of software application development, model testing includes executing a model on representative data and examining it for performance and accuracy. When testing models, data scientists can attempt simple fixes for unintended consequences before the model is deployed. The goal is to feed production data to the model in an environment where the model can be safely executed. Similarly, realistic production data should occur in the test stream also. In practice, there are often many development, testing, and other pre-production environments; for example, to stage new versions of scoring software, to debug predictions, or to evaluate multiple (“challenger”) models scoring data in parallel with the production model so that the value of improved models can be evaluated. Modern cloud-based technologies can often deliver such agility without adding much overhead in cost and effort.
Manage
As models start to proliferate in the organization, a new role—that of the ML Ops engineer—emerges. Somebody must manage the model life cycle, including provenance, version control, approval, testing, deployment, and replacement. It also becomes apparent that models need to be managed in a central repository to enable approvals, electronic signatures, version control, tracking, and reuse.
The ML Ops Engineer
Do we need a dedicated engineer to better operationalize our models? Do we have somebody who is our ML Ops engineer without even knowing it?
It is necessary to organize the people and tasks involved in ML Ops. Even in small companies, a division of labor soon arises between those who create models and those who are responsible for operationalizing them. The skill sets diverge too much to be present in one person or team for very long. Thus, an ML Ops engineer is someone with enough knowledge of machine learning models to understand how to deploy them and with enough knowledge of operational systems to understand how to integrate, scale, and monitor models.
Figure 2 depicts the people and functions along the ML pipeline.

Figure 2. The role of the ML Ops engineer through the entire pipeline
The data engineer works on the databases to ensure that all the sources are available and to provide curated datasets to the rest of the analytics team. Data scientists explore the data, train, and build the predictive model. They then work with the ML Ops engineer to test the trained model on production data in a development or “sandbox” environment, after which the engineer takes that model and deploys it into production environments (e.g., first into pre-production, then into final production). Data scientists and ML Ops engineers both incorporate requirements and changes from business users (and often the risk manager) to understand what the model is meant to predict and what regulatory constraints are applicable. Those users provide guidance on what the model should predict, on how the model should be used, on whether the data scientists’ features make business sense and are allowable or not, and on which additional features could be added to the model. The application designer works with the data scientists to decide which models to use or build and how best to integrate the model so that it is useful to business users, and the application developer writes the code to weave the model into the application. The DevOps team smooths the transition from development to IT operations, which maintains the infrastructure and ensures that the application and its models run, perform, and scale optimally.
With one foot in data science and one foot in DevOps, the ML Ops engineer plays the newest role in the pipeline and an important one in the successful operationalization of ML models. The role bridges the aforementioned division of labor between data scientists and the people responsible for deploying, maintaining, and monitoring applications that use predictive models. With the data scientist, the ML Ops engineer tests and deploys models and sometimes implements monitoring. The role involves a combination of understanding ML models and data transformations, plus engineering (usually at the level of scripting).
In the early stages of operationalizing ML, it is common for somebody to be the de facto ML Ops engineer without even knowing it. If there is no ML Ops engineer, then the app engineer must work with the data scientist. If the app engineer does not understand the underlying concepts, then this makes the process take much longer. Or you may have a data scientist with some computer science skills that steps in to do this, but that creates the opposite issue—data scientists writing production app code. Once the problem starts to scale, then you really need someone in the ML Ops role. Without having the appropriate team in place, the business will not be able to effectively respond and adapt to ever-changing conditions. Of course, dedicated ML Ops software solutions make this collaboration between roles and model deployment life-cycle processes increasingly more efficient and simpler.
Getting Out in Front of Model Proliferation
Where did all these models come from?
In the same way that virtual machines, document files, and versions of source code proliferate, ML models and pipelines tend to accumulate fast and become difficult to track. Where once there were dozens, soon there are hundreds, perhaps thousands. In addition, there are often dependencies between models, for example, where a common model for customer segmentation is used in multiple prediction models.
One factor in proliferation is the increased number of people along the ML pipeline. More people create and test more models and then store them somewhere afterward, even if not in production. Over time, it turns out that a growing percentage of those models address the same problem, but people working in isolation are unaware of one another’s efforts. Automation techniques (for example, Auto ML) make it easy to generate new models and variations of existing models.
The result is a greater need to track, govern, and manage models across the organization.
Auditing, Approvals, and Version Control
Why do we need to track models?
ML Ops becomes complicated by lack of clarity about the differences between model versions: the provenance and history of each model; how models relate to one another and to the data; how they change over time; and how they move from development to production.
Some form of model management system is therefore necessary to record model metadata in a structured form, in order to make it easier to monitor and report on changes from one version to the next, and automate processes (e.g., approvals, electronic signatures, re-training) around the metadata.
Like years of archived data, a large body of models—if well managed—can be an advantage in both governance and reporting. Consider a financial technology company that is using models to evaluate and score credit applications. Even though its models change over time, the company is always responsible for its approval process and must be able to report why a certain credit application was approved or denied. In case of an audit, it needs to demonstrate how it arrived at a score and why the score was below the threshold of acceptability.
The advantage of a large body of models is related to change management, whereby anybody on the ML pipeline can determine exactly who made which change at what time and for what reason. Change management is useful not only for compliance with outside regulations (like the approval process described before) but also for efficient collaboration, internal governance, and justifying changes to the model.
The purpose of version control for models is to track the data and the parameters that were used to build each version, as well as the model outputs (e.g., coefficients, accuracy). That way, when reviewing the evolution of the model, there is clear provenance and a way to track how the model was produced.
Reusing and Repurposing Models from a Centrally Managed Repository
How do we manage so many models coming from so many sources?
Centralization is useful in an organization where tens, hundreds, or even thousands of line-of-business or individual users work with advanced analytics.
The best way to centralize is to reuse and repurpose models from a centrally managed repository that allows multiple people to use a single, approved model for multiple applications. The repository tracks who is building which model and clarifies the number of existing versions. It sheds light on the progress of the data science team and the quantity of models it is building. It tracks connections between data and models and projects, and it is searchable—as different lines of business ask for advanced analytics on scenarios A and B, the repository makes it easier to see that A and B are two sides of the same issue. A suitable, tested model already exists in the repository, so reusing and repurposing it reduces the amount of duplicated effort and decongests the ML pipeline.
Companies still experimenting with ML may be able to handle model management with simple email messages. But once they exit the experimentation phase, their handful of models tends to burgeon, and control and reuse become an issue.
Deploy and Integrate
In the Deploy and Integrate step, the model stops looking in the rearview mirror at historical data and looks through the windshield at live, real-world data. But to do that, the model must be integrated with one of the following:
-
An execution endpoint somewhere, such as a database, where customer data is scored to help drive a marketing campaign
-
A website, to improve interaction with the user
-
A device at the network edge, to make in situ predictions about machine condition
-
An inline operational system with requirements for no downtime, and with single versions of models used across multiple scoring instances, or an AI/ML-infused BI dashboard, application, or report that allows stakeholders to translate model insights and predictions into decisions; to improve, optimize, or affect real-world operations
Why can’t we deploy without integrating, or integrate without deploying?
Deploy and Integrate are closely intertwined: “Deployment” is the process of taking a model from the environment in which it is developed and turning it into an executable form (e.g., a code snippet, or an API) that can be used within an application or other external system. “Integration” is the process of taking that deployed model and embedding it within those external systems. Deployment options depend on the integration endpoints (targets), and those endpoints usually depend, in turn, on the deployment methods.
Thus, the best way to approach deployment is as a function of how the model will be integrated. And the best way to regard integration is as an extension of deployment.
Consider a credit card application process. Banks want to use some kind of predictive analytics to score an application as a good or bad credit risk. A bank may use a credit agency, whose data scientists build a predictive model in a tool that supports export to Predictive Model Markup Language (PMML). The credit agencies export their analytics to PMML or code and then integrate the model into a REST API available to the banks as a credit service through an integration. Again, modern cloud-based ML Ops tools and solutions will make deployment of models and their integration into REST APIs increasingly simple and efficient, requiring little or no actual coding.
To applicants, the integration is transparent, of course. They go to a bank or lender—maybe to an automated kiosk or website—enter their information, and request a loan or a credit line. The same model is applied through the same API regardless of integration endpoint, and creditworthiness is assessed consistently, with the same effectiveness and confidence.
Where Deploy and Integrate Meet
Which deployment methods and integration endpoints are the best match? Which combinations are not worth trying?
Each method of model deployment and integration carries its own set of special considerations:
- Code Gen (e.g., Java, C++, Python, stored procedures)
-
Here, the execution environment must support the language generated, performance requirements are crucial, and updates to models may need to be recompiled.
- Serverless (e.g., function as a service)
-
Language support in FaaS must match the code required for model scoring. Also, because initiating serverless functions typically requires processing time on every call, requirements for scoring latencies and compute costs should be considered.
- Container (e.g., model inferencing within a Docker container)
-
Here, a container is the artifact used for deployment—which is highly compatible with container orchestration systems used in modern IT environments. Note that “hot” redeployments (updating without restarting) of models so they remain identical across all containers can be a challenge and may require additional specialization for continuous deployment/continuous delivery (CI/CD).
- Server
-
This method of deployment, using a centralized scoring server, requires one or more (often virtualized) servers for deployment. Flexible scalability and failover robustness must be specifically designed into the server-based system.
- Model interchange standards (e.g., model export format, PFA, PMML, ONNX, TensorFlow Saved Model)
-
The execution environment must support running the interchange artifact. This method usually requires separate steps to transform and prepare the data. A serialized file representing a model is convenient for supporting no-downtime “hot” redeployments and ensuring consistent updates of models across multiple scoring servers or containers.
For the integration endpoints, the following options are generally available:
- Batch
-
Scoring many rows of data at a time, often on a schedule, often in a database.
- Interactive App
-
Execution of a model typically via API to drive the behavior of an end-user application.
- Realtime Streaming
-
Scoring of one row from a continuous stream of data, usually for making predictions at high frequencies.
- Edge
-
Execution of a model to drive the behavior of a connected device.
Table 1 summarizes the authors’ recommendations on considerations for the most common integration endpoints and the methods for deploying to them.
| INTEGRATION ENDPOINTS | DEPLOYMENT METHODS | ||||
|---|---|---|---|---|---|
| Code gen | Serverless | Container | Server | Model interchange standards | |
Batch |
Very high data volume scoring jobs, typically nightly or scheduled jobs |
N/A |
Can leverage elastic scale and automatic provisioning, and high-availability |
Traditional Server-based architecture, scheduling of repetitive scoring “jobs” |
Convenient when in-database scoring not efficient or possible, and interchange format scoring application/server is available |
Interactive app |
Transaction systems and end-user applications with moderately high performance requirements |
Small number of lightweight models that may be used infrequently |
Many models in diverse formats as managed/cloud-scalable services. |
Many models as enterprise-scalabe services. |
Local execution of scoring is desired, but maintaining generated source code is not. |
Real-time streaming |
Extremely high throughput proessing requirements; can ensure no-downtime updates to models |
Not common because of initial-start and thus latency concerns |
Applicable for medium- to low-latency use cases, e.g., best-next-action and e-commerce |
If latency-of-response is sufficient, can support no-downtime updates to models |
Good for “hot” no-downtime redeployments |
Edge |
Lightweight models that may be required to operate offline |
Many devices calling few models |
Many models in diverse formats and many devices |
Internal network devices |
May be optimal if interchange format is supported on device OS |
In some cases, in addition to deploying the machine learning model, it is necessary to integrate and embed the models into multiple business applications.
Business App Development
How do we combine the efforts of ML Ops and our application developers?
The goal of Deploy and Integrate is that the predictive model has some sort of impact on the way business is done. The most effective way of doing that is to embed it directly into business applications. Examples include embedding product recommendations into an e-commerce site or mobile application, suggesting solutions in a CRM system, and routing assignments intelligently in an ERP system.
That means application engineers need to consider how to fit ML Ops into the software development life cycle. It isn’t just another feature that needs to be considered during design, development, and testing. It may fundamentally change the nature of deployment.
The ideal approach to business app development is to entirely decouple machine learning models from the application, by providing them as a service—a set of APIs that developers can discover, test, and incorporate into their code. Data scientists must then provide comprehensive documentation: how the models are to be used, required inputs and expected outputs, their limitations or realms of applicability, levels of accuracy and confidence, and data dependencies. They should also provide well-defined mechanisms for recording how the models perform over time.
Even if models are called as a service, the data scientists cannot simply “throw models over the wall” and walk away. Application engineers and data scientists will need to collaborate closely when iterating on model development and refinement. Each group involved in business app development will provide feedback to the other, ideally through a shared collaborative platform. For example, the application engineers may not have the same level of access to data and will need to change the model requirements. Performance considerations may change as the application handles more load. The engineers may even have suggestions about new features to include in the model.
As noted earlier, the structure of a model and its data requirements may need to change with little notice. As market conditions change, a model may become dangerously inaccurate, or even obsolete. So developers need to build in safeguards that allow models to be swapped or disabled without requiring a new version of the application. And that means they need to monitor the model over time, as we discuss in the next section.
Monitor
The Monitor step starts once the models have been deployed. It covers three types of metrics: statistical, performance, and business/ROI. Also, because models need updating to remain fresh and useful, the Monitor step includes the tasks of automatic retraining and remodeling.
Statistical Metrics
How accurate is the model now that it is running on real-world data? How do we set a threshold and configure alerts when the model becomes inaccurate? How exactly do we measure accuracy on new or real-time data?
Operationalizing data science and ML includes ongoing monitoring. It extends to continuously reviewing the model, retraining it when necessary, and comparing new “challenger” models to what has already been deployed. Statistical metrics compare accuracy now to accuracy when the model was first deployed or most recently updated. The term “model drift” applies to the change in accuracy over time (discussed later).
There are three parts to statistical metrics:
Accuracy tracking covers metrics like misclassification rate, confidence rate, or the error rates deemed most important to the data scientists. When accuracy falls below a given threshold, it’s time to retrain the model, or remodel altogether.
Champion–challenger is the practice of continually looking for a better model (challenger) than the one already in production (champion). It consists of periodically running either an updated version of the current model or a different model completely and then comparing the results between the two and deploying the more accurate one.
Population stability ensures that current models are still relevant by constantly checking the distribution of datasets over time for reasonable consistency. Consider a model for home mortgage applications. Even the most accurate model deployed in the spring of 2008 would have been overcome by events and real-world market conditions later in the year. With so much change in the population, running the model on end-of-year data would yield significantly different results from running it when the model was trained.
Performance Metrics
Is our infrastructure adequate to support our models?
Models run only as well as resources permit. Performance metrics include input/output, execution time, and number of records scored per second, plus the factors they depend on, such as memory and CPU usage. Such metrics are increasingly available in many dedicated ML Ops solutions.
Business Metrics and ROI
If the dashboards are showing that the model’s error rate is low, then why aren’t we seeing the increase in margins that we were hoping for?
Business metrics determine the desired impact of the model on the business and serve as an important check on statistical metrics. When a new model is deployed, those business metrics are often the most important ones to monitor. How are these metrics defined and monitored? How do they interact with basic measures of model accuracy?
Consider a model for predicting the people most likely to purchase a given product. Even when the most likely purchasers are not buying, it is conceivable that the model could be performing correctly, given the variables that went into it. As another example, digital media and social network companies look at things like click-through rates and engagement metrics.
When statistical and business metrics do align, however, it is an indicator of return on investment in the operationalization of ML models. Take a company whose statistical metrics show that its advanced analytics model is contributing to x percent conversion of sales leads. Through champion–challenger it deploys a model that is more accurate and results in 2x percent conversion of sales leads. The company can point to the improvement as solid ROI on its efforts with advanced analytics.
As the life of the model continues, acceptance and rejection data is obtained from each sales offer and stored, along with the offer details, in a relational database. In time, that causes the model to be automatically retrained and promoted to production, with attendant internal approvals. The process can be scheduled with user-defined intervals (daily, weekly, etc.). It can be activated by events, like a drop in the conversion rate or log-loss ratio below a given threshold, or by the accumulation of offer data.
When Models Drift
Why aren’t the predictions accurate anymore? Is the model drifting?
With traditional software systems, IT puts components in place and then occasionally checks that the API is working correctly or that the system is up and running end to end. Models, on the other hand, are dynamic. They require constant monitoring and updating to counteract model drift, a phenomenon that occurs after deployment, when the model’s predictions become less and less accurate. Drift arises as the real-world variables in the model change over time—they change in their distribution, they change in their relationship to each other, they change because of new variables that weren’t present or significant in the original model.
For example, in a model that predicts sales of a soft drink, summer temperatures may be unusually low and therefore beyond the range that worked in the model; customers may become more sensitive to price during an economic downturn that doesn’t match the historical conditions used for model training; or a new advertising campaign may have been launched. If the model’s predictions used to be 80 percent accurate and now they are 75 percent accurate and falling, then model drift may be at work.
The error rate begins to creep up, so data scientists examine underlying data distributions to understand what has changed. And when a model is generating predictions that effectively cost the business money because of inaccuracy, this activity is as important as the original development of the model.
Retraining and Remodeling
The business is complaining that the predictions don’t make sense. How do we get the model back on track?
Most of the time, the solution to model drift is to retrain (or “recalibrate”) the models on the most recent data. Occasionally, it is necessary to remodel altogether. As shown in Figure 3, a model is retrained in October and January, and accuracy and precision rise sharply. But following retraining in March, accuracy and precision decrease, indicating that it is time to remodel.

Figure 3. Model drift
Retraining involves the same variables and model structure applied when the model was first developed, but it uses fresher data. A model may predict, for example, that sales volume is some multiple of price, plus some multiple of temperature, plus some multiple of the previous week’s sales. Those multiples may change over time, so retraining the model by running it against current data will produce new multiples. The variables themselves do not change.
Remodeling, however, involves adding, changing, or deleting variables and is usually more work than retraining. In the previous example, suppose the business realized that it had neglected to factor a competitor’s pricing into its model and that the competitor was quickly capturing market share. To offset that effect, the data scientists would remodel to add the competitor’s pricing as a variable then test against current data.
When a model is retrained and promoted to production, several steps ensue:
- Model accuracy assessment
-
This step is based on a set of Gini coefficients (a common model accuracy metric). If outside allowable limits, models are reevaluated automatically using a genetic algorithm for searching the parameter space. Candidate models are regularized with Elastic Net to decrease the variance (at the cost of introducing some bias).
- Model updates and explainability
-
This includes assessment of business goals, variable importance, over-fit, bias or outliers, and regulatory perspectives. Segments and factors summarizing the differential model attributes (current versus prior model) are evaluated in a champion–challenger setting. Questions about the effects on customers are assessed.
- Model diagnostics
-
Assessment of local predictive power and accuracy across the predictor space is a consideration. Particular regions of the predictor space may be assessed in accordance with recent trends, and areas of concern can be identified. Statistical hypothesis test results are assessed, along with model diagnostic metrics such as Akaike information criterion (AIC), Bayesian information criterion (BIC), area under the ROC curve (AUROC), and visualizations (ROC curves, lift charts).
- Model versioning, approval, and audit
-
In most cases, models need to be retrained on fresh data to account for variance in market conditions since the previous model training. As such, several versions of the models need to be saved and governed (per regulatory requirements). The models should also be available for auditing and compliance assessments.
The team needs to decide whether retraining or remodeling is appropriate and what the triggers should be.
Monitoring Meets Automation
Why do we need to do this manually? Can’t retraining take place automatically?
Although a human ultimately approves redeployment at the end of the monitoring step, it makes sense to automate model retraining instead of waiting for a human to inspect a dashboard, detect model drift, and manually launch the retraining.
Suitably advanced tools should conduct frequent champion–challenger loops that retrain with the most recent data and possibly with different features. The automation would compare the accuracy of each retrained model against the currently deployed model. Upon finding a better model, the automation would trigger an alert to the data scientists. Also, as described earlier in “Feature Engineering,” iterating between event stream updates and historical accumulation results in a better-fitting feature set and model.
Case Study: Operationalizing Data Science in the Manufacturing Industry—Digital Twin Models
Leaders in high-tech manufacturing industries are increasingly turning to digital twins. These virtual representations of physical systems help manufacturers better manage assets to improve performance, efficiency, and quality of operations. But those improvements can only be realized once the digital twins are embedded into business operations with model operations (aka ML Ops).
In the semiconductor manufacturing industry, the processes that produce integrated circuits (chips) are growing more complex. There can be thousands of processing steps, thousands of pieces of equipment, hundreds of equipment types, and millions of measurements taken during the course of the manufacturing process.
To manage this complexity, digital twin models are becoming the key to efficient operations and high product yields. Developing and operationalizing these models can help modern fabricators not only to overcome complex manufacturing challenges but also to address intricate scheduling and transporting of material.
One semiconductor manufacturer did just that, turning to data science and model operations to develop and train digital twin models to deal with the petabytes of data generated daily by sensors in its manufacturing process. This company’s business requirements were no longer satisfied by traditional, knowledge-driven analysis, which resulted in lost opportunity, suboptimal product yield, and lowered revenue. To remain competitive, this manufacturer needed to operationalize digital twin models to help them understand, control, and optimize all processes (and their resulting quality, efficiency, and yield).
Previously, the company’s engineers had to manually compare defect and electrical patterns one wafer at a time. After adopting digital twin models, they found that clustering of wafers with similar defects and identifying the relationships through electrical tests could be completely automated. Using a combination of visual analytics and data science, the time needed to detect and understand defects decreased from 12 hours to less than one minute per day. Data-driven insights also now enable rapid remediation of issues detected in the upstream process, before those issues can cause costly quality or yield problems.
Analysis and modeling now take less than five minutes per run. With near real-time results, the manufacturer can now identify subtle equipment changes, process shift or drift in certain tools, and remedy substandard yield for a batch moving through the factory. None of this could have been possible without model operations, which ensured that the digital twin models went into production and enacted real business change.
Case Study: Operationalizing Data Science in the Insurance Industry—Dynamic Pricing Models
Companies that still use traditional dynamic pricing software are struggling to compete in today’s digital economy. These black-box point solutions leave little room to react to market trends and regulations, or even keep up with the increasing volume and complexity of data. The insurance industry especially has started to move away from these outdated solutions.
In insurance, the goal is to acquire and retain customers with the highest potential lifetime value while covering underwriting costs, handling demand for coverage, and dealing with unexpected external factors such as natural disasters. A dynamic pricing strategy, in which a business sets prices for services based on market demands and other factors, helps insurers adjust price based on potential risks, customers’ willingness to pay, competitor pricing, and other variables. Artificial intelligence (AI)–fueled dynamic pricing models, put into production using model operations, can ensure that insurers are able to quickly react to market changes and stay competitive.
TIBCO developed and deployed a dynamic pricing system for the auto insurance unit of a large client using model operations. This pricing model solution included configurations for price optimization and customer acquisition and retention. It also showcased price elasticity data and modeling of acceptance as a function of price.
Before the company operationalized data science, it had used the same market-dominant analytics software for many years. It took new data scientists a year or so before they learned how to use that software and could begin retraining existing models and generating new ones.
But since implementing the new dynamic pricing system with model operations, the company can hire data scientists with no coding or math background, and within three months, they are able to release models and therefore generate revenue. They have at their disposal the computational power to run models for fraud identification and embedded customer value.
Users within the company are empowered and connected across departments now. In the case of a sudden rise or drop in sales, for instance, business users would normally approach IT and ask them to look into it, with no idea how long it would take to get a useful answer. Now, those same users can simply click on relevant metrics and run a model that sheds light on the change in sales volume. If business users want to dive into the data or perform predictive analysis, they have the opportunity.
The company can update its dynamic pricing models in live environments, resulting in real-time predictability and informed decision-making. Data goes out to models almost as soon as it comes in. Rather than generating simple predictions, the company is able to answer questions like “If we increase or decrease discounts, what is the effect on volume and profitability?” More importantly, the company can ask questions about what to do differently, how to change pricing, and where in the organization to make changes. This is just one example of how operationalizing data science and machine learning models with model operations can bring real value to an organization.
Conclusion
The sequence of Build, Manage, Deploy and Integrate, and Monitor introduces structure and logical flow around analytics pipelines, and allows the organization to realize the value of data science through ML Ops. It ensures that the best model gets embedded into a business system, that the deployed models are consistent with business requirements as well as constraints imposed by company policies or regulatory oversight, and that the model remains current.
Companies that build this kind of methodical thinking into their data science have a big competitive advantage over those that consistently fail to operationalize models and that fail to prioritize action over mere insight. These organizations can move beyond building models in isolation to operationalizing data science for all applicable business-critical processes, with confidence and with clear visibility into associated risks, costs, and benefits.