
Chapter 2
Memory Forensics
Analyzing Physical and Process Memory Dumps for Malware Artifacts
Solutions in this chapter:
• How Windows Memory Forensic Tools Work
• Windows Memory Forensic Tools
Introduction
The importance of memory forensics in malware investigations cannot be overstated. A complete capture of memory on a compromised computer generally bypasses the methods that malware uses to trick operating systems, providing digital investigators with a more comprehensive view of the malware. In some cases, malware leaves little trace elsewhere on the compromised system and the only clear indications of compromise are in memory. In short, memory forensics can be used to recover information about malware that was not otherwise obtainable.
Digital investigators often find useful information in memory dumps simply by reviewing readable text and performing keyword searches. However, as the size of physical memory in modern computers continues to increase, it is inefficient and ineffective to review an entire memory dump manually. In addition, much more contextual information can be obtained using specialized knowledge of data structures in memory and associated tools. Specialized forensic tools are evolving to extract and interpret a growing amount of structured data in memory dumps, enabling digital investigators to recover substantial evidence pertaining to malware incidents. Such digital evidence includes recovery of deleted or hidden processes, including the executables and associated data in memory and the pagefile. More sophisticated analysis techniques are being codified in memory forensic tools to help digital investigators find malicious code in an automated manner.
Investigative Considerations
• There is still information available during the live response that cannot be extracted from memory dumps, for instance, network configuration and enabled protocols, ARP cache, and NetBIOS sessions. Therefore, it is important to implement the process described in Chapter 1 and not just acquire a physical memory dump.
With the increasing power and automation of memory forensic tools, it is becoming more important for digital investigators to understand how the tools work in order to validate the results. Without this knowledge, digital investigators will find themselves reaching incorrect conclusions based on faulty tool output or missing important information entirely. In addition, digital investigators need to know the strengths and weaknesses of various memory forensic tools in order to know when to use them and when their results may not be entirely reliable.
Ultimately, digital investigators must have some knowledge of how malware can manipulate memory and need to be familiar with a variety of memory forensic tools and how they interpret underlying data structures. This chapter provides a comprehensive approach for analyzing malicious code in memory dumps from a Windows system and covers associated techniques and tools. Details about the underlying data structures are beyond the scope of this field guide and are discussed in the text Malware Forensics: Investigating and Analyzing Malicious Code (hereinafter Malware Forensics).1
Memory Forensics Overview
![]() After memory is preserved in a forensically sound manner, employ a strategy and associated methods to extract the maximum amount of information relating to the malware incident.
After memory is preserved in a forensically sound manner, employ a strategy and associated methods to extract the maximum amount of information relating to the malware incident.
![]() A memory dump can contain a wide variety of data, including malicious executables, associated system-related data structures, and remnants of related user activities and malicious events. Some of this information has associated date-time stamps. The purpose of memory forensics in malware incidents is to find and extract data directly relating to malware and associated information that can provide context, such as when certain events occurred and how malware came to be installed on the system. Specifically, in the context of analyzing malicious code, the main aspects of memory forensics include:
A memory dump can contain a wide variety of data, including malicious executables, associated system-related data structures, and remnants of related user activities and malicious events. Some of this information has associated date-time stamps. The purpose of memory forensics in malware incidents is to find and extract data directly relating to malware and associated information that can provide context, such as when certain events occurred and how malware came to be installed on the system. Specifically, in the context of analyzing malicious code, the main aspects of memory forensics include:
• Harvest available metadata including process details, network connections, and other information associated with potential malware for analysis and comparison with volatile data preserved from the live system.
• Perform keyword searches for any specific known details relating to a malware incident, and look through strings for any suspicious items.
• Look for common indicators of malicious code including memory injection and hooking.
• For each process of interest, if feasible, recover the executable code from memory for further analysis.
• For each process of interest, extract associated data from memory, including related encryption keys and captured data such as usernames and passwords.
• Extract contextual details such as Event Logs, URLs, MFT entries, and Registry values pertaining to the installation and activities associated with malicious code.
• Perform temporal and relational analysis of information extracted from memory, including a time line of events and a process tree diagram.
![]() These processes are provided as a guideline and not as a checklist for performing memory forensics. No single approach can address all situations, and some of these goals may not apply in certain cases. In addition, the specific implementation will depend on the tools that are used and the type of malware involved. Ultimately, the success of the investigation depends on the abilities of the digital investigator to apply digital forensic techniques and adapt them to new challenges.
These processes are provided as a guideline and not as a checklist for performing memory forensics. No single approach can address all situations, and some of these goals may not apply in certain cases. In addition, the specific implementation will depend on the tools that are used and the type of malware involved. Ultimately, the success of the investigation depends on the abilities of the digital investigator to apply digital forensic techniques and adapt them to new challenges.
Investigative Considerations
• The completeness and accuracy of the above steps depend heavily on the tools used and your familiarity with the data structures in memory. Some tools will only provide limited information or may not work on memory acquired from certain versions of Windows.
• In one case, digital investigators ran a tool on a memory dump and extracted a limited list of IP addresses that had communicated with the compromised system. Another digital investigator looked at the same memory dump and used his knowledge of memory structures to recover hundreds of additional connections that were relevant to the investigation.
• To avoid mistakes and missed opportunities, it is necessary to compare the results of multiple tools and to verify important findings manually.
![]() Analysis Tip
Analysis Tip
Field Interviews
Most incidents have a defining moment when malicious activity was recognized. The more information that digital investigators have about that moment, the more they can focus their forensic analysis and increase the chances of solving the case. Simply knowing the rough time period of the incident and knowing what evidence of malware was observed can help digital investigators develop a strategy for scouring memory dumps for relevant digital evidence. Without any such background information, forensic analysis can be like trying to find a needle in the haystack, which can result in wasted time and lost opportunities (e.g., relevant network logs being overwritten). Therefore, prior to performing forensic analysis of a memory dump, it is advisable to gather as much information as possible about the malicious code incident and subject system from relevant witnesses. The Field Interview Questions in Chapter 1 provide a solid foundation of context to support a strong forensic analysis of malware in memory.
Old School Memory Analysis
![]() In addition to using specialized memory forensic tools to interpret specific data structures, look through the data in raw, uninterpreted form for information that is not extracted automatically.
In addition to using specialized memory forensic tools to interpret specific data structures, look through the data in raw, uninterpreted form for information that is not extracted automatically.
![]() Although the memory forensic tools covered in this chapter have advanced considerably over the past few years, there is still a substantial amount of useful information in memory dumps that many specialized tools do not extract automatically. Therefore, it is generally still productive to employ “old school” memory analysis, which was essentially limited to a manual review of the memory dump, keyword searching, file carving, and use of text extraction utilities such as the strings command (with Unicode support). These old school techniques can uncover remnants of activities or data that may be related to malicious code, including but not limited to the following:
Although the memory forensic tools covered in this chapter have advanced considerably over the past few years, there is still a substantial amount of useful information in memory dumps that many specialized tools do not extract automatically. Therefore, it is generally still productive to employ “old school” memory analysis, which was essentially limited to a manual review of the memory dump, keyword searching, file carving, and use of text extraction utilities such as the strings command (with Unicode support). These old school techniques can uncover remnants of activities or data that may be related to malicious code, including but not limited to the following:
• File fragments such as Web pages and Word documents no longer present on disk
• Commands run at the Windows command line
• E-mail addresses and message contents
• URLs, including search engine queries
Unexpected information can be found in memory dumps such as intruder’s commands and communications that are not saved elsewhere on the computer, making a manual review necessary in every case.
![]() For instance, in a case involving the ZeuS Trojan program, entire HTTP GETs and POSTs are visible along with the entire encrypted data sections of the communications as shown in Figure 2.1, a benefit particularly when network traffic was not previously captured.2
For instance, in a case involving the ZeuS Trojan program, entire HTTP GETs and POSTs are visible along with the entire encrypted data sections of the communications as shown in Figure 2.1, a benefit particularly when network traffic was not previously captured.2
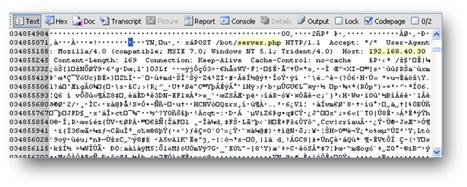
Figure 2.1 Encrypted packet contents associated with the ZeuS Trojan communications captured in memory dump
![]() Memory dumps can also capture command and control activities such as instructions executed by the attacker and portions of network communications associated with an attack. Figure 2.2
shows an example of an IP packet and payload captured in a target memory dump.
Memory dumps can also capture command and control activities such as instructions executed by the attacker and portions of network communications associated with an attack. Figure 2.2
shows an example of an IP packet and payload captured in a target memory dump.

Figure 2.2 IP packet in memory with source IP address 172.16.157.136 (ac 10 9d 88), destination IP 172.16.157.1 (“AC 10 9D 01”) starting at offset 0x0263B01A and payload visible in ASCII
![]() It is often desirable to extract certain files from a memory dump for further analysis.
It is often desirable to extract certain files from a memory dump for further analysis.
• One approach to extracting executables and other types of files for further analysis is to employ file carving tools such as Foremost and Scalpel to run on the full memory dump or on extracted memory regions relating to a specific process (Figure 2.3).
![]()
Figure 2.3 Carving memory with foremost

Figure 2.4 Volatility psscan option carving EPROCESS structures out of a memory dump
• The results of file carving can be more comprehensive than the more surgical file extraction methods used by specialized memory forensic tools.
• However, current file carving tools only salvage contiguous data, whereas the contents of physical memory may be fragmented. Therefore, the executables that are salvaged using this method may be incomplete.
![]() Even when sophisticated memory forensic tools are available, digital investigators benefit from spending some time looking through readable text in a memory dump or process memory dump.
Even when sophisticated memory forensic tools are available, digital investigators benefit from spending some time looking through readable text in a memory dump or process memory dump.
• When clues such as IP addresses are available from other aspects of a digital investigation, keyword searching is another efficient approach to locating specific information of interest.
• Given the widespread use of Unicode by the Windows operating system, it is critical to use a tool that can extract Unicode strings, such as the strings utility available from Microsoft.
Investigative Considerations
• These old school approaches to extracting information from memory dumps do not provide surrounding context. For instance, the time associated with a URL or IP packet will not be displayed automatically, and may not be available at all. For this reason, it is important to combine the results of old school analysis with those of specialized memory forensic tools to obtain a more complete understanding of activities pertaining to a malware incident.
• Although memory forensic tools provide a mechanism to perform precise extraction of executables by reconstructing memory structures, there can be a benefit to using file carving tools such as Foremost and Scalpel. File carving generally extracts a variety of file fragments that might include graphics files, reviewed document fragments showing an intruder’s collection interest, and data that may have been stolen.
How Windows Memory Forensic Tools Work
![]() Understanding the underlying operations that memory forensic tools perform can help you select the right tool for a specific task and assess the accuracy and completeness of results.
Understanding the underlying operations that memory forensic tools perform can help you select the right tool for a specific task and assess the accuracy and completeness of results.
• Some tools will only list active processes, whereas others will scan for all executive process (EPROCESS) structures.
• Some tools only extract certain areas of process memory, whereas others can extract related information from the pagefile as well as the executable associated with a process.
• Some tools will detect memory injection and hooking correctly, whereas others will identify such features incorrectly (false positive) or not at all (false negative).
• Additional details about how memory forensic tools work are provided in the Malware Forensics text.
Investigative Considerations
• Although many memory forensic tools can be used without understanding the operations that the tool uses to interpret data structures in memory, a lack of understanding will limit your ability to analyze relevant information and will make it more difficult to assess the completeness and accuracy of the information. Therefore, it is important for digital investigators to become familiar with data structures in memory.
Windows Memory Forensic Tools
![]() Choose the tool(s) that are most suitable for the type of memory analysis you are going to perform. Whenever feasible, use multiple tools and compare their results for completeness and accuracy.
Choose the tool(s) that are most suitable for the type of memory analysis you are going to perform. Whenever feasible, use multiple tools and compare their results for completeness and accuracy.
![]() Different memory forensic tools have different features and may only support specific versions of Windows. Therefore, it is necessary to be familiar with the strengths and weaknesses of multiple memory forensic tools. The types of information that most memory forensic tools provide are summarized in the following list.
Different memory forensic tools have different features and may only support specific versions of Windows. Therefore, it is necessary to be familiar with the strengths and weaknesses of multiple memory forensic tools. The types of information that most memory forensic tools provide are summarized in the following list.
![]() Some tools provide additional functionality such as extracting executables and process memory, detecting memory injection and hooking, recovering Registry values and MFT entries, and extracting URLs and e-mail addresses. Commercial forensic tools such as FTK and EnCase have adapted to include memory analysis capabilities. These and other malware forensic tools are discussed further in the Tool Box section at the end of this chapter.
Some tools provide additional functionality such as extracting executables and process memory, detecting memory injection and hooking, recovering Registry values and MFT entries, and extracting URLs and e-mail addresses. Commercial forensic tools such as FTK and EnCase have adapted to include memory analysis capabilities. These and other malware forensic tools are discussed further in the Tool Box section at the end of this chapter.
Investigative Considerations
• Memory forensic tools are in the early stages of development and may contain bugs and other limitations that can result in missed information. To increase the chance that you will notice any errors introduced by an analysis tool, whenever feasible, compare the output of a memory forensic tool with that of another tool as well as volatile data collected from the live system.
Processes and Threads
![]() Obtain as much information as possible relating to processes and associated threads, including hidden and terminated processes, and analyze the details to determine which processes relate to malware.
Obtain as much information as possible relating to processes and associated threads, including hidden and terminated processes, and analyze the details to determine which processes relate to malware.
![]() When a system is running malware, information (what, where, when, how) about the processes and threads is generally going to be significant in several ways.
When a system is running malware, information (what, where, when, how) about the processes and threads is generally going to be significant in several ways.
• What processes are hidden or injected in memory may be of interest, and where they are located in memory or on disk may be noteworthy.
• When they were executed can provide useful clues, and how they are being executed may be relevant.
• Deleted processes may also be important in an investigation. To begin with, a comparison of processes visible through the operating system with all EPROCESS structures that exist in memory can reveal deleted and hidden processes.
Command-line Memory Analysis Utilities
• The Volatility psscan plug-in scans a memory dump for the signature of an EPROCESS data structure to provide a list of active, exited, and hidden processes. The following output shows the psscan option being used to carve EPROCESS structures out of a memory dump from the FUTo rootkit scenario in Malware Forensics (Figure 2.4).3
![]()
• Comparing the output of the psscan output with a list of running processes (e.g., using Volatility pslist option) can reveal discrepancies caused by malware, or may reveal anomalies that relate to the behavior of malware.
• The psdiff Volatility plug-in automatically performs this comparison. In this example, two processes, “skls.exe” and “skl.exe,” that were not displayed in the pslist output are visible in the psscan output (shown in bold in Figure 2.4) with a process ID of zero that is generally reserved for the Windows system Idle process.
• The setting of the process identifier (PID) to zero is an artifact of the FUTo rootkit, making it difficult for digital forensic tools to reference the hidden processes by PID. To address this challenge, tools such as Volatility have added the ability to run analysis on a process by the location (offset) of the EPROCESS structure in the memory dump as shown here for the hidden “skls.exe” process to list loaded DLLs associated with this hidden process (Figure 2.5).
![]()
Figure 2.5 Using the Volatility dlllist option
• Another approach to finding hidden processes is to extract process details from the Windows “csrss” process as demonstrated by the csrpslist Volatility plug-in (Figure 2.6).4

Figure 2.6 Results of parsing a memory dump with the csrpslist plug-in
• The output of this plug-in is provided below for the FUTo rootkit example, with a zero in the second column when a process was not present in the pslist output (e.g., skl.exe). Unfortunately, this list does not show the “skls.exe” process found using psscan.
• Another free command-line tool is Memoryze from Mandiant. The command-line options for this tool are summarized in the Tool Box section at the end of this chapter. A sample command line is provided here that extracts processes and associated ports from a memory dump (Figure 2.7). ![]()
![]()
Figure 2.7 Processing a memory dump file with Memoryze
• The output from Memoryze is in XML format and can be viewed in raw form or using any XML viewer or using the AuditViewer program described next.5
![]()
![]() The threads associated with a given process identified can also be examined to provide additional information about a malware incident.
The threads associated with a given process identified can also be examined to provide additional information about a malware incident.
• The thrdscan and thrdscan2 plug-ins in Volatility will carve and display all of the ETHREAD structures it can find in a memory dump.
• Looking for threads that have a PID that was not displayed in the process list may uncover hidden processes. The orphanthreads Volatility plug-in attempts to find such hidden processes in memory dumps.
![]() Additional command-line utilities such as PTFinder to extract process and thread details from physical memory dumps are discussed in the Tool Box section at the end of this chapter.
Additional command-line utilities such as PTFinder to extract process and thread details from physical memory dumps are discussed in the Tool Box section at the end of this chapter.
GUI-based Memory Analysis Tools
• A number of tools have been developed to facilitate forensic analysis of Windows memory. These tools can be particularly useful for detecting artifacts of malware in memory such as memory injection. Although Memoryze is a command-line utility, it can be configured and run, and its output can be viewed using a GUI program named AuditViewer. Figure 2.8 shows one of the configuration screens in AuditViewer used to configure Memoryze. ![]()
• Figure 2.9 shows processes and associated details viewed using AuditViewer, focusing on the “skl.exe” process mentioned previously that was hidden using the FUTo rootkit.
• Tabs within AuditViewer provide easy access to the information that Memoryze extracts associated with each process and driver including files, Registry keys, and open ports.
• In addition, certain features in a memory dump that commonly relate to malware such as memory injection will be highlighted in red in the Memoryze results as detailed in the Dissecting Windows Process Memory section toward the end of this chapter.

Figure 2.8 AuditViewer configuration options screenshot

Figure 2.9 AuditViewer showing output of Memoryze
![]() Another GUI tool for examining memory is HBGary Responder,6 as shown in Figure 2.10, which lists processes and associated details.
Another GUI tool for examining memory is HBGary Responder,6 as shown in Figure 2.10, which lists processes and associated details. ![]()

Figure 2.10 HBGary Responder used to list processes and associated metadata
• This tool provides various details relating to processes and drivers, and can be used to perform keyword searches within a memory dump.
• For an additional cost, advanced features are available as add-ons to this tool, such as integrated debugging/disassembly and automated detection of features commonly found in malware (called Digital DNA or DDNA).7
• This tool can also be used to associate ports with a particular process as shown in Figure 2.11 with the same “skl.exe” processes selected, revealing that it has port 1900 open.

Figure 2.11 HBGary used to list ports associated with a particular process
Relational Reconstruction
![]() When examining processes in Windows memory, it can also be fruitful to perform a relational reconstruction, depicting the parent and child relationships between processes as shown in the following section.
When examining processes in Windows memory, it can also be fruitful to perform a relational reconstruction, depicting the parent and child relationships between processes as shown in the following section.
• For instance, malware will sometimes exploit a system vulnerability and cause a system process to launch a command shell.
• The Metasploit penetration testing framework8 has an option to launch a remote command shell after exploiting vulnerability in the Windows Local Security Authority Subsystem Service (LSASS).
• Figure 2.12 shows how this looks in memory using the Hacker Defender scenario from the Malware Forensics text,9 with the “lsass.exe” process launching Metasploit, which in turn launched the program “UMGR32.exe” that turns out to be Back Orifice.

Figure 2.12 Graphical depiction of relationship between processes in the Hacker Defender rootkit scenario
![]() Another anomaly to look for in this type of relational reconstruction is a user process that is the parent of what resembles a system process.
Another anomaly to look for in this type of relational reconstruction is a user process that is the parent of what resembles a system process.
• Because malware attempts to blend in with the legitimate processes on a system, digital investigators might see the “cmd.exe” process spawning a process named “lsass.exe” to resemble the legitimate Windows LSASS process.
• Conversely, suspicious activities can be found by looking for system processes spawning an unknown process or executable that is usually only started by a user.
• For instance, the ZeuS Trojan program is commonly injected into the “svchost.exe” process and, therefore, any remotely executed commands appear to be spawned by the “svchost.exe” process.10
Investigative Considerations
• Some legitimate processes such as AntiVirus and other security tools can have characteristics that are commonly associated with malware. Therefore, it is advisable to determine which processes are authorized to run on the subject system. However, intruders may assign their malware the same name as these legitimate processes to misdirect digital investigators. Therefore, do not dismiss seemingly legitimate processes simply because they have a familiar name. Take the time to examine the details of a seemingly legitimate process before excluding it from further analysis.
![]() Analysis Tip
Analysis Tip
Temporal and Relational Analysis
Analysis techniques from other forensic disciplines can be applied to malware forensics to provide insights into evidence and associated actions. In memory analysis the most common form of temporal analysis is a time line and the most common form of relational analysis is a process tree diagram. A time line and process tree diagram should be created in all cases to determine whether any processes were started substantially later than standard system processes, or whether there are unusual relationships between processes as previously discussed. The full path of an executable and any files that a process has open may also provide clues that lead to malware. Digital investigators should look for other creative ways to analyze date-time stamps and relationships found in memory not just for processes but for all data structures.
Modules and Libraries
![]() Extract details associated with modules (aka drivers) and libraries in memory, and analyze them to determine which relate to malware.
Extract details associated with modules (aka drivers) and libraries in memory, and analyze them to determine which relate to malware.
![]() Malware may create drivers or load libraries to perform core functions such as concealment and keylogging. Therefore, in addition to processes and threads, it is important to examine drivers and libraries that are loaded on a Windows system.
Malware may create drivers or load libraries to perform core functions such as concealment and keylogging. Therefore, in addition to processes and threads, it is important to examine drivers and libraries that are loaded on a Windows system.
Memory Analysis Utilities
• The Volatility modules and modscan2 plug-ins provide a list of modules running on a system, and the driverscan plug-in searches memory for specific driver objects.
• For example, Figure 2.13 shows a list of loaded modules extracted from memory using the Volatility modules option, with the module named “msdirectx.sys” associated with the FUTo rootkit highlighted in bold.
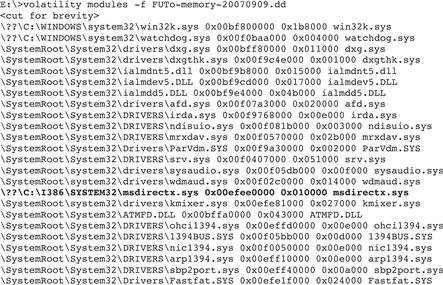
Figure 2.13 A portion of Volatility output when used to list loaded modules (aka drivers)
• If there is a chance that a module is hidden or exited, the modscan2 option may be more effective.
• Once a module of interest is identified, the executable contents can be extracted to a file for further analysis using the moddump Volatility plug-in.11
• The dlllist option of Volatility can be used to list the dynamic link libraries (DLLs) for each process.
• In the FUTo scenario of the Malware Forensics text, listing DLLs reveals that a component of KeyLogger named “kls.dll” (shown in bold in Figure 2.14) is attached to two running processes: “explorer.exe” and “helix.exe.”12

Figure 2.14 A portion of Volatility output when used to list dynamic link libraries
• The fact that KeyLogger was attached to the “helix.exe” process demonstrates the potential of malware undermining incident response tools and the potential notification of the intruder if the keylog is sent that the response has occurred. A specific DLL can be extracted from a memory dump using the dlldump Volatility plug-in.
• Memoryze has an option to list all libraries associated with each process, and provides two batch scripts named DriverSearch.bat and DriverWalkList.bat that can be used to list drivers.
• The results of running the DriverSearch.bat on the FUTo memory dump are in Figure 2.15, providing details for the “msdirectx.sys” module used by the FUTo rootkit.
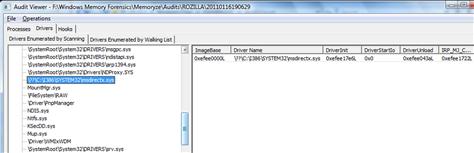
Figure 2.15 Mandiant’s AuditViewer used to list drivers including a rootkit module
• Similarly, HBGary Responder lists drivers and loaded libraries, enabling digital investigators to drill down into a specific object to obtain more details as shown in Figure 2.16.
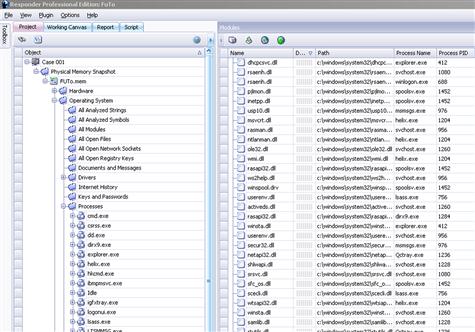
Figure 2.16 HBGary Responder used to list drivers and libraries
• Note that the example in Figure 2.16 does not have the DDNA feature enabled and does not show the automated severity checks for each object in memory.
Investigative Considerations:
• In some cases, it is necessary to understand the function of a certain library to determine whether it is normal or not. For example, knowing that “wsock32” provides network connectivity (e.g., wsock32) functions should raise a red flag when it is being called by a program that does not require network access.
Open Files and Sockets
![]() Review open files and sockets in an effort to find items associated with malware such as configuration logs, keystroke logs, and network connections.
Review open files and sockets in an effort to find items associated with malware such as configuration logs, keystroke logs, and network connections.
![]() The files and sockets that are being accessed by each process can provide insight into their operation on an infected system. A Trojan horse program or rootkit may have its configuration file open, a keylogger may have a log file to store captured keystrokes, and a piece of malware designed to search a disk for Personally Identifiable Information (PII) or Protected Health Information (PHI) may have various files open that contain social security numbers, credit card numbers, and other sensitive data.
The files and sockets that are being accessed by each process can provide insight into their operation on an infected system. A Trojan horse program or rootkit may have its configuration file open, a keylogger may have a log file to store captured keystrokes, and a piece of malware designed to search a disk for Personally Identifiable Information (PII) or Protected Health Information (PHI) may have various files open that contain social security numbers, credit card numbers, and other sensitive data.
Memory Analysis Utilities
• The files option in Volatility can be used to show the files that are being accessed by each process. In Figure 2.17, the files that a particular process has open are listed and include files with sensitive data that are relevant to the investigation (shown in bold).

Figure 2.17 Parsing a target memory dump with the Volatility files option
![]() In many cases it is desirable to associate processes running on a compromised system with activities observed on the network.
In many cases it is desirable to associate processes running on a compromised system with activities observed on the network.
• The most common approach to making this association is to determine which port(s) each process is using and look for those ports in the associated network activities.
• Information about open ports and the associated process can be extracted from a memory dump using the Volatility commands seen in Figure 2.18.
![]()
Figure 2.18 Volatility commands to open ports and associated processes
• The sockets output lists active open ports whereas the sockscan output lists all recoverable port information, including for those that have been closed.
• If there are any network connections in memory that were associated with a particular port of interest, these can be extracted using the connections and connscan2 Volatility plug-ins.
• For instance, connections associated with the ZeuS Trojan activities were recovered from a memory dump as shown in Figure 2.19, even after the network connections were closed and did not appear in the active connections.

Figure 2.19 Using the connscan2 plug-in
![]() Memoryze can also be used to list open files with the handles option, as shown in Figure 2.20.
Memoryze can also be used to list open files with the handles option, as shown in Figure 2.20.
![]()
Figure 2.20 Parsing a target memory dump for open files with Memoryze
• The resulting list of open files can be viewed using AuditViewer as shown in Figure 2.21 with open files lists on the right.

Figure 2.21 Open files associated with ZeuS malware extracted using Memoryze viewed with AuditViewer
• This example shows the main ZeuS Trojan executable file “sdra64.exe” within the winlogon.exe process, along with associated configuration files (user.ds and local.ds) and a reference to “AVIRA,” which is common for this malware.
Various Data Structures
![]() Interpret data structures in memory that have a known format such as Event logs, Registry entries, MFT entries, command history, and other details that can provide additional context relating to the installation and activities associated with malicious code.
Interpret data structures in memory that have a known format such as Event logs, Registry entries, MFT entries, command history, and other details that can provide additional context relating to the installation and activities associated with malicious code.
![]() Malware can create impressions and leave trace evidence on computers, as described in Chapter 6, which provide digital investigators with important clues for reconstructing associated malicious activities.
Malware can create impressions and leave trace evidence on computers, as described in Chapter 6, which provide digital investigators with important clues for reconstructing associated malicious activities.
• Such impressions and trace evidence created on a computer system by malicious code may be found in memory even after the artifacts are concealed on or removed from the computer.
• For instance, an Event log entry, file name, or Registry entry relating to malware may remain in memory along with associated metadata after the actual file is deleted or when it is hidden from the operating system.
• Memory forensic tools are being developed to interpret an increasing number of such data structures.
![]() Any data structure that exists on a computer system may be found in memory.
Any data structure that exists on a computer system may be found in memory.
For instance, file system information is generally cached in memory, potentially providing digital investigators with clues relating to malware and associated activities.
Event Logs
![]() It may be possible to recover Windows Event Log records in a target memory dump that shows activities relating to malware, even after they have been deleted from the log file.
It may be possible to recover Windows Event Log records in a target memory dump that shows activities relating to malware, even after they have been deleted from the log file.
• Rather than interpreting this type of data structure manually, it is generally desirable to use an automated approach to locate and interpret all such entries in a memory dump. File carving techniques can be used for this purpose Murphey. R. (2007). Automated Windows event log forensics in DFRWS2007 proceedings (Available online at www.dfrws.org/2007/proceedings/p92-murphey.pdf).
Master File Table
![]() Figure 2.22 illustrates an MFT entry in a target memory dump that shows all metadata associated with a file that relates to an investigation into potentially unauthorized access to and theft of sensitive data.
Figure 2.22 illustrates an MFT entry in a target memory dump that shows all metadata associated with a file that relates to an investigation into potentially unauthorized access to and theft of sensitive data.

Figure 2.22 MFT Entry in memory dump viewed in X-Ways.13
• The NTFS FILE Record template within X-Ways (under the View — Template Manager menu option) can be applied to an MFT entry found in memory to interpret all of the attributes, including the area on disk that contains the file contents.
• Rather than interpreting this type of data structure manually, it is generally desirable to use an automated approach to locate and interpret all such entries in a memory dump.
An EnScript was developed to enable EnCase to extract MFT entries from memory dumps automatically.14
![]()
Services
![]() Volatility can be used to extract a list of services from memory using the svcscan plug-in, which can be useful when malware is installed as a service. The following portion of svcscan output from the FUTo rootkit example shows a keylogger program installed as a services (Figure 2.23; shown in bold).
Volatility can be used to extract a list of services from memory using the svcscan plug-in, which can be useful when malware is installed as a service. The following portion of svcscan output from the FUTo rootkit example shows a keylogger program installed as a services (Figure 2.23; shown in bold).
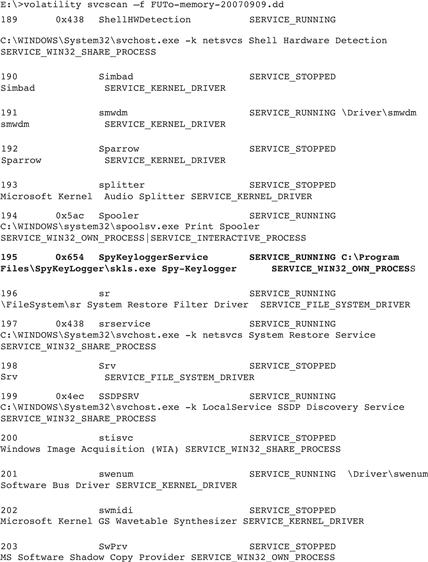
Figure 2.23 The Volatility svcscan plug-in
Registry Entries
![]() Registry entries can provide context for malware running on a computer, directing digital investigators to important information such as encryption keys stored in the Registry and used by the malware to obfuscate network traffic.
Registry entries can provide context for malware running on a computer, directing digital investigators to important information such as encryption keys stored in the Registry and used by the malware to obfuscate network traffic.
• The regobjkeys Volatility plug-in prints Registry keys that are stored in memory.
• By default, this plug-in may not recover all Registry keys, particularly when malware is involved and is manipulating memory.
• For instance, the default regobjkeys output for the FUTo example does not include Registry keys associated with the hidden processes. These keys can be extracted using the regobjkeys plug-in by specifying the offset of the associated EPROCESS structure in memory as shown in Figure 2.24 for the hidden skl.exe process.
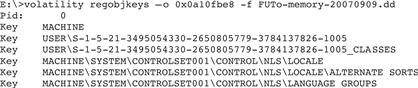
Figure 2.24 The Volatility regobjkeys plug-in
• A more comprehensive view of Registry information in memory can be extracted by looking for all Registry hives in a memory dump using the hivelist and hivescan Volatility plug-ins as shown in Figure 2.25.
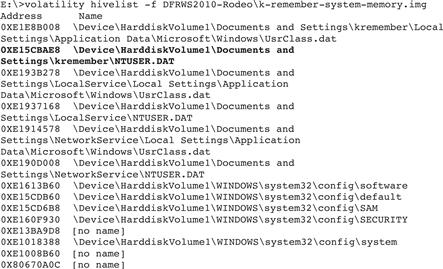
Figure 2.25 Using the hivelist plug-in to parse Registry artifacts from a memory dump
• A listing of the contents of a particular Registry hive with associated last written date-time stamps can be extracted using the hivedump Volatility plug-in.
• For instance, part of the output for a target User hive, “kremember,” in the memory dump is displayed in Figure 2.26.

Figure 2.26 Extracting a target User hive with the hivedump plug-in
• Information about a specific Registry can be extracted using the printkey plug-in, but to extract the contents of Registry values in memory using Volatility it is necessary to use the RegRipper plug-in.15 The offset in memory of each memory hive is shown in the hivelist output in Figure 2.26 and is provided as input to RegRipper along with the memory dump as shown in Figure 2.27.

Figure 2.27 Extracting a target User hive with the hivedump plug-in
• HBGary Responder also extracts Registry-related information from memory dumps as shown in Figure 2.28.

Figure 2.28 Registry entries associated with a specific process displayed by HBGary Responder Pro
Investigative Considerations
• Data structures in memory may be incomplete and should be verified using other sources of information. At the same time, even if there is only a partial data structure, it can contain leads that direct digital investigators to useful information on the file system that might help support a conclusion. For instance, if only a partial MFT entry is recoverable from a memory dump, it may contain a partial file name and date-time stamps that help focus a forensic examination.
• Not all data structures in memory can be interpreted by memory forensic tools automatically. Old school methods discussed at the beginning of this chapter may reveal additional details that can provide context for malware. In addition, through experimentation and research it may be possible to determine the format of a specific data structure located in a memory dump.
![]() Analysis Tip
Analysis Tip
Exploring Data Structures
In addition to Windows operating system data structures such as Registry and MFT entries, any application can have unique data structures in memory. Therefore, the variety of data structures in memory is limited only by the programs that have been used on the system, including peer-to-peer programs and instant messaging clients. Digital investigators need to keep this in mind when dealing with applications and may need to conduct research to interpret data structures that are relevant to their specific case. The most effective approach to learning how to interpret data structures is through application of the scientific method, conducting controlled experiments as demonstrated in Casey and Stevens (DFRWS, 2010).
Dumping Windows Process Memory
In many cases, when examining a specific process of interest, it will be possible to extract the necessary information from a memory dump acquired as detailed in Chapter 1. However, in certain situations it will be desirable to acquire memory related to a specific process running on a live system. This section addresses both needs.
![]() Extract malicious executable files and associated data in memory for further analysis.
Extract malicious executable files and associated data in memory for further analysis.
![]() When there is a specific process that you are interested in analyzing, there are two areas of memory that are necessary to acquire: the executable and the area of memory used by the process to store data. Both of these areas of memory can be extracted from a memory dump using memory forensic tools.
When there is a specific process that you are interested in analyzing, there are two areas of memory that are necessary to acquire: the executable and the area of memory used by the process to store data. Both of these areas of memory can be extracted from a memory dump using memory forensic tools.
Recovering Executable Files
![]() When a suspicious process has been identified on a subject system, it is often desirable to extract the associated executable code from a memory dump for further analysis. As straightforward as this might seem, it can be difficult to recover a complete executable file from a memory dump. To begin with, an executable changes when it is running in memory, so it is generally not possible to recover the executable file exactly as it would exist on disk. Pages associated with an executable can also be swapped to disk, in which case those pages will not be present in the memory dump. Furthermore, malware attempts to obfuscate itself, making it more difficult to obtain information about its structure and contents. With these caveats in mind, the most basic process of recovering an executable is as follows:
When a suspicious process has been identified on a subject system, it is often desirable to extract the associated executable code from a memory dump for further analysis. As straightforward as this might seem, it can be difficult to recover a complete executable file from a memory dump. To begin with, an executable changes when it is running in memory, so it is generally not possible to recover the executable file exactly as it would exist on disk. Pages associated with an executable can also be swapped to disk, in which case those pages will not be present in the memory dump. Furthermore, malware attempts to obfuscate itself, making it more difficult to obtain information about its structure and contents. With these caveats in mind, the most basic process of recovering an executable is as follows:
1. Read process environment block (PEB) structure to determine the address where the executable begins.
2. Go to the start of the executable and read the PE header.
3. Interpret the PE header to determine the location and size of the various sections of the executable.
4. Extract the pages associated with each section referenced in the PE header, and combine them into a single file.
The Malware Forensics text describes this process in detail.16 Fortunately, memory forensic tools such as Volatility, Memoryze, and HBGary Responder automate this process and can save the executable associated with a given process or module to a file. For instance, the procexedump option of Volatility saves the executable associated with a process while the procmemdump extracts an executable as a memory sample. Other memory forensic tools have a comparable capability. Memoryze provides scripts named ProcessDD.bat and DriverDD.bat to facilitate the extraction of executables and memory regions associated with processes and drivers.
![]() Analysis Tip
Analysis Tip
Running AntiVirus on Extracted Executables
Digital investigators can run multiple AntiVirus programs on executables extracted from memory dumps to determine whether they contain known malware. Although this can result in false positives, it provides a quick focus for further analysis.
Recovering Process Memory
![]() In addition to obtaining metadata and executable code associated with a malicious process, it is generally desirable to extract all data in memory associated with that process. Conceptually, the process of extracting all memory pages associated with a particular process is simple.
In addition to obtaining metadata and executable code associated with a malicious process, it is generally desirable to extract all data in memory associated with that process. Conceptually, the process of extracting all memory pages associated with a particular process is simple.
• Sequentially read the entries in the Page Directory and associated Page Tables, and extract the data in each 4096-byte page.
• The memory of a particular process can be dumped using the memdmp option in Volatility (formerly named usrdmp in earlier versions).
• However, some tools rely on a unique PID to reference processes and, therefore, cannot be used to dump the memory associated with the “skl” and “skls” processes shown earlier, which both have a PID of zero.
• Other memory forensic tools for dumping process memory rely on the physical location of the EPROCESS block, and can extract the necessary information about the location of data in order to extract the memory contents for a particular process. For instance, in Volatility, version 1.3, all of the commands related to processes can have the process object specified as a physical offset.
Investigative Considerations
• Shared memory areas may contain data relating to other processes. Therefore, it is advisable to seek corroborating clues before concluding that certain data is related to the malware being analyzed.
• Most memory forensic tools can include data stored in the pagefile, which may provide additional information when extracting memory associated with a given process.
• In addition to acquiring and parsing the full memory contents of a running system to identify artifacts of malicious code activity, it is also recommended that the digital investigator capture the individual process memory of specific processes that are running on the system for later analysis. Although it may seem redundant to collect information that is already preserved in a full memory capture, having the process memory of a piece of malware in a separate file will facilitate analysis, particularly if memory forensic tools have difficulty parsing the full memory capture. Moreover, using multiple tools to extract and examine the same information can give added assurance that the results are accurate, or can reveal discrepancies that highlight malware functionality and weaknesses in a particular tool.
Extracting Process Memory on Live Systems
![]() In some cases it may be desirable to acquire the memory of a specific process on a live system. This can apply to a computer that is the subject of an investigation, or to a test computer that is being used to examine a piece of malicious code. In such cases, there are various utilities that can be run on a live system to capture process memory, including pmdump,17 RAPIER,18 Process Dumper, and the Microsoft User Mode Process Dumper (userdump),19 as shown in Figure 2.29.
In some cases it may be desirable to acquire the memory of a specific process on a live system. This can apply to a computer that is the subject of an investigation, or to a test computer that is being used to examine a piece of malicious code. In such cases, there are various utilities that can be run on a live system to capture process memory, including pmdump,17 RAPIER,18 Process Dumper, and the Microsoft User Mode Process Dumper (userdump),19 as shown in Figure 2.29.
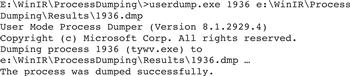
Figure 2.29 Dumping suspicious process “tywv” with userdump
Dissecting Windows Process Memory
![]() Delve into the specific arrangements of data in memory to find malicious code and to recover specific details pertaining to the configuration and operation of malware on the subject system.
Delve into the specific arrangements of data in memory to find malicious code and to recover specific details pertaining to the configuration and operation of malware on the subject system.
![]() When there is a specific process that you are interested in analyzing, there are various things you will want to look for, including:
When there is a specific process that you are interested in analyzing, there are various things you will want to look for, including:
![]() Some of this information can be found by extracting strings or performing keyword searches. Volatility can be used to extract strings from an entire memory dump or a specific process for further analysis.
Some of this information can be found by extracting strings or performing keyword searches. Volatility can be used to extract strings from an entire memory dump or a specific process for further analysis.
HBGary Responder can be used to perform keyword searches for both ASCII and Unicode, presenting any search hits in the context of which process or module they were found. Figure 2.30 shows the results of a keyword search for “sploit” on a target memory dump file, revealing 8 keyword hits in several processes.

Figure 2.30 Keyword search results for sploit using HBGary Responder
![]() Some tools look for specific keywords in memory automatically when initially processing a memory dump in an effort to recover potentially useful information such as passwords. For instance, Figure 2.31 shows the Keys and Passwords recovery feature of HBGary Responder displaying the password from the Hacker Defender rootkit.
Some tools look for specific keywords in memory automatically when initially processing a memory dump in an effort to recover potentially useful information such as passwords. For instance, Figure 2.31 shows the Keys and Passwords recovery feature of HBGary Responder displaying the password from the Hacker Defender rootkit.
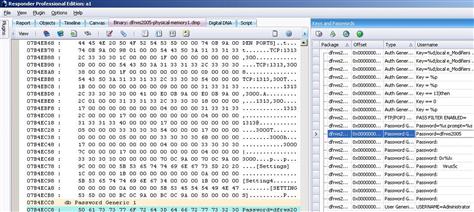
Figure 2.31 Keys and Passwords function of HBGary Responder showing password associated with rootkit extracted from memory dump
![]() Some memory forensic tools can provide additional insights into memory that are specifically designed for malware forensics.
Some memory forensic tools can provide additional insights into memory that are specifically designed for malware forensics.
• As more malware uses concealment techniques such as injection and hooking, memory forensic tools are being developed to detect new concealment methods.
• Attempts to detect specific malware concealment techniques have been codified in tools such as Memoryze, HBGary Responder, and Volatility plug-ins.
![]() Some Volatility plug-ins have been developed to look for concealment techniques commonly used by malware.
Some Volatility plug-ins have been developed to look for concealment techniques commonly used by malware.
• These plug-ins include apihooks, driverirp, ssdt_ex, and malfind.20
• A portion of output from the malfind plug-in relating to the ZeuS Trojan is provided in Figure 2.32, listing and extracting portions of memory that may be related to malware.

Figure 2.32 Parsing memory with the Volatility malfind plug-in
• The output of these Volatility plug-ins is not as focused or intuitive as memory forensic tools such as Memoryze or HBGary Responder.
• Furthermore, these plug-ins and others that attempt to detect concealment techniques in memory often result in many false positives.
Therefore, the output of these tools should be treated as a starting point for digital investigators rather than a final answer relating to malware. Other tools and techniques should be employed to validate the results of the plug-ins.
![]() Memoryze has several functions for detecting injected code and hooks in memory dumps, all of which can be enabled using the AuditViewer program.
Memoryze has several functions for detecting injected code and hooks in memory dumps, all of which can be enabled using the AuditViewer program.
• Figure 2.33 shows a suspicious memory section highlighted by AuditViewer that is associated with the Trojan horse program Back Orifice.

Figure 2.33 AuditViewer showing suspicious memory sections associated with the Back Orifice Trojan horse program highlighted
• Memoryze (using the AuditViewer front end) has strong memory injection detection capabilities as shown in Figure 2.34, identifying an injected memory section in the “Excel.exe” process, highlighted.

Figure 2.34 Identifying memory injection with AuditViewer
• Although Memoryze is a powerful tool for detecting potential concealment techniques in memory, the supporting documentation is careful to point out that not all concealment techniques will be detected using the automated tool. This again demonstrates the importance in malware forensics of utilizing multiple analysis tools and performing a comprehensive reconstruction (temporal, relational, and functional, as discussed earlier in this chapter) to ensure that a more complete understanding of the malware is obtained.
• Figure 2.35 shows HBGary Responder examining a system infected with the ZeuS Trojan, which makes extensive use of process injection. Potentially malicious objects in memory are highlighted and given a severity score in an effort to help digital investigators focus on areas of greatest potential concern.

Figure 2.35 Processes with code injected by the ZeuS Trojan viewed using HBGary Responder
• Figure 2.36 provides additional details about a specific module that HBGary Responder has rated as suspicious because of its ability to inject code into other processes.

Figure 2.36 Portions of HBGary Responder report of suspicious module injected into svchost.exe process
• Tools such as HBGary DDNA automatically extract some characteristics of executable code that can be useful for malware forensics.
• For instance, Figure 2.37 shows the traits extracted by DDNA for a malicious process. However, this approach can result in a false positive and generally requires additional analysis by a skilled digital investigator.

Figure 2.37 Traits of a malicious process automatically extracted using Digital DNA (DDNA) module
![]() Analysis Tip
Analysis Tip
Finding the Hidden in Memory
Digital investigators should not be overly reliant on automated methods for detecting hidden information and concealment techniques in memory. Free and commercial tools alike cannot detect every concealment method. As such, automated detection methods are simply one aspect of the overall process of examining volatile data in memory as described in Chapter 1, as well as the comprehensive examination and reconstruction methods discussed earlier in this chapter.
Conclusions
• As memory forensics evolves, an increasing amount of information can be extracted from full memory dumps, providing critical evidence and context related to malware on a system.
• The information that can be extracted from memory dumps includes hidden and terminated processes, traces of memory injection, and hooking techniques used by malware, metadata, and memory contents associated with specific processes, executables, and network connections.
• In addition, impressions and trace evidence such as those discussed in Chapter 6 may be present in memory dumps, waiting for digital investigators to find and interpret them.
• However, because memory forensics is in the early stage of development, it may not be able to recover the desired information from a memory dump in all cases. Therefore, it is important to take precautions to acquire the memory contents of individual processes of interest on the live system.
• Even when memory forensic tools can be employed in a particular case, acquiring individual process memory from the live system allows digital investigators to compare the two methods to ensure they produce consistent results.
• Furthermore, because malware can manipulate memory, it is important to correlate critical findings with other sources of data such as the file system, live response data, and external sources such as logs from firewalls, routers, and Web proxies.
 Pitfalls to Avoid
Failing to Validate Your Findings
![]() Learn the strengths and limitations of your tools through testing and research.
Learn the strengths and limitations of your tools through testing and research.
![]() Keep in mind that tools may report false positives when attempting to detect suspicious code.
Keep in mind that tools may report false positives when attempting to detect suspicious code.
![]() Use more than one tool and compare the results to ensure that they are consistent.
Use more than one tool and compare the results to ensure that they are consistent.
![]() Verify important findings manually by examining items as they exist in memory, and review their surrounding context for additional information that may have been missed by the tools.
Verify important findings manually by examining items as they exist in memory, and review their surrounding context for additional information that may have been missed by the tools.
Failing to Understand Underlying Data Structures
![]() Do not trust results of memory forensic tools without verification.
Do not trust results of memory forensic tools without verification.
![]() Learn the data structures that are being extracted and interpreted by memory forensic tools in order to validate important findings.
Learn the data structures that are being extracted and interpreted by memory forensic tools in order to validate important findings.
![]() When a tool fails to extract certain items of interest, interpret the data yourself.
When a tool fails to extract certain items of interest, interpret the data yourself.
![]() Find additional information in memory that memory forensic tools are not currently programmed to recover.
Find additional information in memory that memory forensic tools are not currently programmed to recover.
Memory Forensics: Field Notes
Note: This document is not intended as a checklist, but rather as a guide to increase consistency of forensic examination of memory. When dealing with multiple memory dumps, it may be necessary to tabulate the results of each individual examination into a single document or spreadsheet.


![]() Malware Forensic Tool Box
Malware Forensic Tool Box
Memory Analysis Tools for Windows Systems
In this chapter we discussed approaches to interpreting data structures in memory. There are a number of memory analysis tools that you should be aware of and familiar with. In this section, we explore these tool alternatives, often demonstrating their functionality. This section can also simply be used as a “tool quick reference” or “cheat sheet,” as there will inevitably be times during an investigation where having an additional tool that is useful for a particular function would be beneficial, since you may have little time to conduct research for or regarding the tool(s). It is important to perform your own testing and validation of these tools to ensure that they work as expected in your environment and for your specific needs.


Selected Readings
Books
1. Eagle C. The IDA Pro Book: The Unofficial Guide to the World’s Most Popular Disassembler San Francisco, CA: No Starch Press; 2008.
2. Ligh M, Adair S, Hartstein B, Richard M. Malware Analysis Cookbook: Tools and Techniques for Fighting Malicious Code New York: Wiley; 2010.
3. Malin C, Casey E, Aquilina J. Malware Forensics: Investigating and Analyzing Malicious Code Burlington, MA: Syngress; 2008.
4. Skoudis E, Zeltser L. Malware: Fighting Malicious Code Upper Saddle River, NJ: Prentice Hall; 2003.
5. Szor P. The Art of Computer Virus Research and Defense Mountain View, CA: Symantec Press; 2005.
Papers
1. Dolan-Gavitt B. The VAD Tree: A Process-Eye View of Physical Memory. Digital Investigation. 2007;Vol. 4(Suppl. 1):62–64.
2. Dolan-Gavitt B. Forensic Analysis of the Windows Registry in Memory. Digital Investigation. 2008;Vol. 5(Suppl. 1):S26–S32.
3. Hejazia SM, Talhia C, Debbabi M. Extraction of Forensically Sensitive Information from Windows Physical Memory. Digital Investigation. 2009;Vol. 6(Suppl. 1):S121–S131.
4. Kang, M., Poosankam, P., and Yin, H. (2007). Renovo: A Hidden Code Extractor for Packed Executables. WORM ’07, Proceedings of the 2007 ACM Workshop on Recurring Malcode. New York: ACM.
5. Murphey R. Automated Windows event log forensics in DFRWS2007 proceedings. http://www.dfrws.org/2007/proceedings/p92-murphey.pdf ; 2007; Available online at.
6. Petroni Jr NL, Walters A, Fraser T, Arbaugh WA. FATKit: A Framework for the Extraction and Analysis of Digital Forensic Data from Volatile System Memory. Digital Investigation. 2006;Vol. 3(Issue 4):197–210.
7. Royal, P. (2006). PolyUnpack: Automating the Hidden-Code Extraction of Unpack-Executing Malware. Annual Computer Security Applications Conference, Miami Beach, FL, December 11–15.
8. Saur K, Grizzard JB. Locating ×86 Paging Structures in Memory Images. Digital Investigation. 2010;Vol. 7(Issues 1–2):28–37.
9. Stevens RM, Casey E. Extracting Windows Command Line Details from Physical Memory. Digital Investigation. 2010;Vol. 7(Suppl. 1):S57–S63.
10. Yegneswaran, V. et. al. (2008). Eureka: A Framework for Enabling Static Analysis on Malware. Technical Report Number SRI-CSL-08-01, SRI Project 17382.
Jurisprudence/RFCs/Technical Specifications
1. Columbia Pictures Indus. v. Bunnell, 2007 U.S. Dist. LEXIS 46364 (C.D. Cal. June 19, 2007).
2. RFC 3227—Guidelines for Evidence Collection and Archiving.
13 For more information about X-Ways, go to http://www.x-ways.com/.
1 http://www.syngress.com/digital-forensics/Malware-Forensics/.
2 Cheval and Oxley (2011), Masters Thesis, Johns Hopkins University Information Security Institute.
3 Malin, C., Casey, E., and Aquilina, J. (2008). Malware Forensics: Investigating and Analyzing Malicious Code, Chap. 3, p. 147. Burlington, MA: Syngress.
4 http://code.google.com/p/volatility/wiki/Plugins.
5 For more information about AuditViewer, go to http://www.mandiant.com/products/free_software/mandiant_audit_viewer/.
6 For more information about HBGary Responder, go to http://www.hbgary.com/responder-field.
7 For more information about HBGary Responder Pro and Digital DNA, go to http://www.hbgary.com/responder-pro-2/; http://www.hbgary.com/digital-dna.
8 For more information about the Metasploit penetration testing framework, go to http://www.metasploit.com/.
9 Malin, C., Casey, E., and Aquilina, J. (2008). Malware Forensics: Investigating and Analyzing Malicious Code, Chap. 3, pp. 130–131. Burlington, MA: Syngress.
10 Cheval and Oxley (2011), Masters Thesis, Johns Hopkins University Information Security Institute.
11 http://code.google.com/p/volatility/source/browse/branches/Volatility-1.4_rc1/contrib/plugins/moddump.py?r=540.
12 Malin, C., Casey, E., and Aquilina, J. (2008). Malware Forensics: Investigating and Analyzing Malicious Code, Chap. 3, p. 143. Burlington, MA: Syngress.
14 For more information about X-Ways, go to http://www.x-ways.com/. http://www.forensickb.com/2007/11/extract-mft-records-from-memory-dump.html.
15 http://code.google.com/p/volatility/wiki/Plugins.
16 Malin, C., Casey, E., and Aquilina, J. (2008). Malware Forensics: Investigating and Analyzing Malicious Code, Chap. 3, pp. 144–146. Burlington, MA: Syngress.
17 For more information about pmdump, go to http://www.ntsecurity.nu/toolbox/pmdump/.
18 For more information about RAPIER, go to http://code.google.com/p/rapier/.
19 For more information about Microsoft User Mode Process Dumper, go to http://www.microsoft.com/downloads/en/details.aspx?FamilyID=E089CA41-6A87-40C8-BF69-28AC08570B7E&displaylang=en.