
8
DESIGNING PROCESS CONTROL AND IMPROVEMENT SYSTEMS
A company used data analytics to identify unprofitable customers not worth keeping. Despite this, they ultimately decided to keep those customers anyway. Why? Because Wall Street analysts use customer turnover as a key metric and dropping too many customers, no matter what the benefit to the bottom line, would likely lead to a decrease in market capitalization and a lack of confidence in the company. The story illustrates two points: that metrics are sometimes misguided, and coordinating balanced goals with actions can prevent businesses from making critical errors. Ultimately, business performance management is about improving corporate performance in the right direction.
IT Utility
There are literally hundreds of business processes taking place simultaneously in an organization, each creating value in some way. The art of strategy is to identify and excel at the critical few processes that are the most important to the customer value proposition.
Both private companies and governmental agencies have outsourced some of their computer processing systems to third parties. Processes commonly outsourced include
- Asset management
- Help desk
- Infrastructure maintenance
- Systems management and administration
- Network management
- Integration and configuration
These outsourced information technology (IT) services have come to be known as the “IT utility.” The larger IT utilities are typically ISO 9001/9002 certified and offer large pools of IT talent and experience. However, processes must be measured, regardless of whether or not they are outsourced.
Unisys (2003), a provider of such services, recommends the following metrics:
- Customer satisfaction
- Standardization
- Incident rates
- Security audit
- Incident prevention rates
- Security awareness
- Availability
- Reliability/quality of service
- Call volume
- First pass yields
- Cycle times
- Architecture accuracy
- IT employee satisfaction
- Root-cause analysis
- Change modification cycle times
- Change modification volume by type
- Research and development (R&D) presentation/information flow rate
- Volume of technology pilots
- Business opportunity generation rate
- Strategic IT project counts
Unisys uses these metrics to establish the foundation for management review, trend analysis, and causal analysis. Management review provides insight into current performance and forms the basis for taking corrective action. Trend and root-cause analyses identify opportunities for continuous improvement.
Based on its analysis and industry experience, Unisys states that a performance-based environment is anywhere from 10% to 40% more cost-effective than a non-performance-based environment. When deciding how best to optimize the IT infrastructure, organizations need verifiable performance and trend data. While customer satisfaction is usually touted as the key metric for IT improvement, it is actually an outcome metric dependent on several lower-level activities, as shown in Figure 8.1. Understanding the relationship between these codependent performance metrics is important in effecting sustainable positive performance.
Essentially, the IT department should consider itself an IT utility for the purposes of aligning itself to the organization’s business process objectives. In this way, IT can more effectively track performance using a balanced scorecard and make appropriate performance improvements as a result.
Wright et al. (1999) did an extrapolation of Compaq’s (now Hewlett-Packard) balanced scorecard based on research and publicly available information. As a computer company, this case history is interesting from an IT perspective, particularly if a corporate IT department thinks of itself as an IT utility.
Compaq had a number of business process objectives:
Operations cycle:
Innovation cycle:
- Under $1000 PCs
- Products preconfigured with SAP and other business software
- Pricing innovations
- Design to market requirements—workstations, laptops
- High-performance desktops
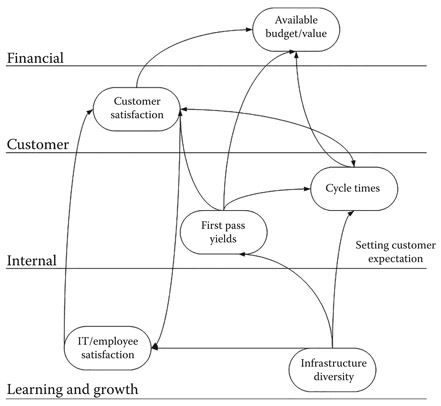
Figure 8.1
Cause and effect in the IT utility.
The business process perspective is linked downward to the learning and growth perspective by quality improvements, improved coordination, and integrated information. The business process perspective is linked upward to the customer and financial perspectives by lower operating costs, improved use of resources, reduced waste, new product capabilities, and better service programs.
For Compaq, the chief component of the business process perspective is its operations cycle. This encompasses sourcing parts, components, manufacturing, marketing, distributing, and after-sale services. This cycle had been the major focus of a reengineering effort—the goal of which was to bring them to a higher level of customer focus.
Compaq’s reengineering effort required them to change their business processes first and then their information systems to support the reengineered processes. The company relied heavily on enterprise-level IT, and by the late 1990s had begun using SAP R/3 to integrate their business processes and sales information. Compaq also built a global extranet called Compaq On Line to provide customers with a way to automatically configure and order PCs and servers. This was followed by adding an online shopping service, allowing customers to order directly from the Internet.
The newly enhanced processes and accompanying systems allowed Compaq to achieve the following process efficiencies:
- Linking orders electronically to suppliers. This improved cycle time and facilitated JIT manufacturing. It also provided production status information to be made available to customers so that they could track their own orders.
- Sharing information with suppliers enabled Compaq to anticipate changes in demand and ultimately improve their efficiency. This reduced the cost of supplies and improved on-time delivery.
- Integrating orders with SAP’s financial management and production planning modules enabled Compaq to reduce the time and cost of orders.
- Capturing customer information after a sale enabled Compaq to provide individualized service and additional marketing opportunities.
After the implementation of a balanced scorecard in 1997, Compaq sales volume improved. According to Wright et al. (1999), this resulted from delivering value, increasing customer service, innovating new products, and reducing time-to-market (TTM). This sales spurt more than made up for the decreasing prices of PCs, and ultimately generated higher revenue. Improved cycle times and decreasing costs enabled the company to operate far more efficiently, resulting in higher net income levels and, ultimately, higher revenue per employee.
Of course, a balanced scorecard is not the only performance-enhancing methodology and measurement system in use. Aside from Six Sigma, which is a set of techniques and tools for process improvement developed by Motorola in the 1980s, deployed methodologies run the gamut from business process management (BPM) to kaizen.
BPM is a field in operations management that focuses on improving corporate performance by managing and optimizing a company’s business processes. Design for Six Sigma (DFSS) is a BPM methodology related to traditional Six Sigma. It is based on the use of statistical tools such as linear regression and enables empirical research.
Define, measure, analyze, improve, and control (DMAIC) refers to a data-driven improvement cycle used for improving, optimizing, and stabilizing business processes and designs. Kaizen is the Japanese term for improvement. Kaizen refers to activities that continuously improve all functions and involve all employees from the chief executive officer (CEO) to the customer service reps. It also applies to processes. Finally, Lean software development (LSD) is a translation of Lean manufacturing and Lean IT principles and practices to the software development domain.
Getting to Process Improvements
Process improvements can be thought of in two dimensions. There are those process improvements that are internal to the IT department and there are process improvements that are quite visible to end users and senior management. For the purposes of this discussion, we will refer to the former as engineering process improvements and the latter as business process improvements.
Table 8.1 defines five levels in terms of continuous improvement.
Table 8.1 Using a Continuous Improvement Framework
| CAPABILITY LEVEL | DEFINITION | CRITICAL DISTINCTIONS |
| 5—Optimizing | A quantitatively managed process that is improved based on an understanding of the common causes of variation inherent in the process. A process that focuses on continually improving the range of process performance through both incremental and innovative improvements. | The process is continuously improved by addressing common causes of process variation. |
| 4—Quantitatively Managed | A defined process that is controlled using statistical and other quantitative techniques. The product quality, service quality, and process performance attributes are measurable and controlled throughout the project. | Using appropriate statistical and other quantitative techniques to manage the performance of one or more critical subprocesses of a process so that future performance of the process can be predicted. Addresses special causes of variation. |
| 3—Defined | A managed process that is tailored from the organization’s set of standard processes according to the organization’s tailoring guidelines, and contributes work products, measures, and other process-improvement information to the organizational process assets. | The scope of application of the process descriptions, standards, and procedures (organizational rather than project specific). Described in more detail and performed more rigorously. Understanding interrelationships of process activities and details measures of the process, its work products, and its services. |
| 2—Repeatable | A performed process that is also planned and executed in accordance with policy; employs skilled people having adequate resources to produce controlled outputs; involves relevant stakeholders; is monitored, controlled, and reviewed; and is evaluated for adherence to its process description. | The extent to which the process is managed. The process is planned and the performance of the process is managed against the plan. Corrective actions are taken when the actual results and performance deviate significantly from the plan. The process achieves the objectives of the plan and is institutionalized for consistent performance. |
| 1—Initial | A process that accomplishes the needed work to produce identified output work products using identified input work products. The specific goals of the process area are satisfied. | All of the specific goals of the process area are satisfied. |
| 0—Incomplete | A process that is not performed or is only performed partially. One or more of the specific goals of the process area are not satisfied. | One or more of the specific goals of the process area are not satisfied. |
Enhancing IT Processes
The Boston Consulting Group (Brock et al. 2015) report on large-scale IT projects paints an ugly picture. For projects over $10 million in investment, the chances of delivering on time and on budget is just one in ten. Projects fail for a myriad of reasons: chief among them is overly complex requirements, inexperienced teams, a lack of buy-in from influential stakeholders, insufficient attention to major risks, lack of testing, and a failure to manage the project plan effectively.
A report by the Hackett Group (2015) stresses that chief information officers (CIOs) must respond far more quickly to shifts in business demands, while decreasing expenses through greater efficiencies. They recommend that CIOs overhaul the service delivery model to better support the convergence of business and tech. The goal here is to introduce greater agility and flexibility so that IT can “turn on a dime” to support the changing needs of the business and create real strategic advantage.
Today’s fluid marketplace requires technology that can drive innovation, automation, and personalization much more quickly (Desmet et al. 2015). As a result, some organizations are moving to a two-speed IT model that enables rapid development of customer-facing programs while evolving core systems designed for stability and high-quality data management more slowly.
This translates to the use of high-speed IT teams that are charged with rapidly iterating software, releasing updates in beta, fixing problems in near real time, then rereleasing. One European bank created a new team that used concurrent design techniques (in which multiple development tasks are completed in parallel) to create a prototype of an account registration process, while using existing technology where it could. By testing this process with real customers in a live environment, the team was able to make constant refinements until it succeeded in cutting the process down to 5 steps from the original 15. The key here is knowing what questions to ask as one goes about improving a process, as shown in Table 8.2.
New Methods
DevOps (the integration of technical development and operations) and continuous delivery (the automation of testing, deployment, and infrastructure processes) have introduced capabilities that radically increase speed to market and lower costs. An international travel company used these approaches to reduce TTM by moving to the cloud, fully automating its testing, and rolling out a one-click deployment process (Desmet et al., 2015).
The concept of continuous development is closely linked to the Lean/agile concept of kaizen-continuous improvement. For some teams, kaizen can lead to continuous delivery and continuous deployment. Intuit’s accounting software runs on a wide variety of platforms, so it is obvious that Intuit’s development team has many technical challenges in maintaining the infrastructure that supports continuous development. Intuit’s method is known as infrastructure as code, a fully automated development, test, and production infrastructure (Denman 2015). Continuous development allows development teams to test every code and commit and deliver the working code as soon as it is ready, with a minimum of manual testing. Essentially, every code gets automated unit tests, smoke tests, and so on to catch any defects.
Table 8.2 Process Improvement Interview Questions
| HOW DOES THE PROCESS START? |
| What event triggers the process to start? |
| Is there more than one way the process could start? |
| How do you know when the process is complete? (What are the determining factors?) |
| Are there different end states for the process? For example, one that signifies successful completion and others that indicate failed or aborted attempts. |
| How does the process get from Point A to Point B? |
| Where else might the process go and why? |
| How do you know when one part is done? |
| Are all changes documented? How many changes are done each month? |
| What are the normal end states and what are the exceptions? |
| Are there rules that govern the process, states, and completion status? |
| What parts of the process do you seek to eliminate, and why? |
| Where do you spend most of your time, and why? |
| Where in the process do you repeat work? How often, and why? |
| What does your manager think happens in the process? What really happens? |
| How does management assess the process and how it is performing? |
| When pressed for time, what steps in the process do you skip or work around? |
| What is your role? |
| What are your assigned duties? |
| What are the tasks required for you to perform your duties according to your role? |
| List each task—estimate of hours per week, estimate of total hours per each term? |
| How often do you perform each task? (daily, weekly, each term, annually) |
| How many people in your office or area are involved in this process? |
| Where do cycle time delays exist? |
| Where do handoffs take place? |
| Do people actually hand something off, or is it submitted to a system with the assumption that it is handed off? |
| What data points are put into systems? What data points are taken out? |
| What pains does the process cause? What do people want or desire from the process? |
At this time, only a few of Intuit projects have fully achieved continuous deployment, where changes go into production without any manual intervention. Some projects have continuous delivery, meaning the code is pushed out to a staging environment where it is reviewed and approved before being sent into production. Other projects require manual tests by quality engineers before they can be deployed. But, the ultimate goal is complete automation and full continuous deployment, and infrastructure as code is the software that runs all that.
A push toward continuous development, which includes continuous integration; continuous testing; automated configuration management (CM) and testing; use of agile methods, including use of patterns; and application performance monitoring, needs to be handled with care. There really needs to be a culture shift within the development teams, including project managers, programmers, database designers, web designers, quality assurance (QA), and operations and management, toward enhanced collaboration.
Process Quality
Solano et al. (2003) have developed a model for integrating systematic quality—that is, a balance between product and process effectiveness and efficiency—within systems development organizations through the balanced scorecard. Table 8.3 shows the four balanced scorecard perspectives oriented toward systemic quality integration.
This quality-oriented strategy is a daily, ongoing process that needs to be “bought into” by staff members. Solano et al. (2003) provide an example of a company, VenSoft C.A., which did just this by relating organizational goals to employee remuneration. Table 8.4 shows employee incentives, based on the balanced scorecard. Each perspective and indicator was given a weight that depended on the organization’s mission. Yearly bonuses depended on the goals being totally or partially attained.
How is the process (or product) quality index calculated? One of the goals of software engineering is to produce a defect-free product. A module’s quality profile is the metric used to predict if a module will be defect free. A quality profile is predictive in that its value is known immediately after a module has completed its developer’s unit test. It is suggestive, in that it can suggest potential quality issues and thus mechanisms to redress those issues. Quality profiles adhere to software engineering dogmas that design is good, technical reviews are necessary for quality, and that high-defect density in a test phase is predictive of high-defect density in later test phases. Finally, early empirical evidence suggests that quality profiles do predict if a module is defect free. As seen in Table 8.5, a quality profile is composed of five dimensions:
The process quality index (PQI) is calculated by multiplying the five dimensions together. The Software Engineering Institute (SEI) has presented preliminary data that indicate that PQI values between 0.4 and 1 predict that the module will have zero subsequent defects.
With this model, Solano et al. (2003) tried to close the gap between software engineering projects and organizational strategy. In their view, the systemic vision of the organization, and the balance between the forces of the organization, coincide quite nicely with the balanced scorecard approach.
Philips Electronics (Gumbus and Lyons 2002) implemented a balanced scorecard predicated on the belief that quality should be a central focus of their performance measurement effort. The Philips Electronics balanced scorecard has four levels. The very highest level is the strategy review card, next is the operations review scorecard, the third is the business unit card, and the fourth level is the individual employee card.
Table 8.3 Integrating Quality with the Balanced Scorecard
| PERSPECTIVE | STRATEGIC TOPICS | STRATEGIC OBJECTIVES | STRATEGIC INDICATORS |
| Financial | Growth | F1 Increase shareholder value | Shareholder value |
| F2 New sources of revenue from outstanding quality products and services | Growth rate of volume compared with growth rate of sector | ||
| F3 Increase customer value through improvements to products and services | Rate of product renewal compared with total customers | ||
| Productivity | F4 Cost leader in the sector | Comparing expenses with the sectors: | |
| F5 Maximize utilization of existing assets | Free cash flow | ||
| Operating margin | |||
| Customer | Charm the customers | C1 Continually satisfy the customer chosen as the objective | Share of selected key markets |
| C2 Value for money | Comparing value for money with the sector | ||
| C3 Reliable operations | Percentage of errors with customers | ||
| C4 Quality service | |||
| Internal process | Growth | 11 Create and develop innovative products and services | Profitability of new product investment |
| 12 Implement a systems product quality model with a systemic approach | Rate of new product acceptance | ||
| Rate or product quality | |||
| Increase customer value | 13 Technological improvements to products | Timeliness | |
| 14 Apply flexible development methodologies | Product availability | ||
| 15 Advisory services | |||
| Operational excellence | 16 Provide a flexible global infrastructure | Cost reduction | |
| 17 Meet specifications on time | Fixed asset production | ||
| 18 Cost leader in the sector | Improved yield | ||
| 19 Implement a quality system development model process | Rate of compliance with specifications | ||
| Rate of process quality | |||
| 110 Develop outstanding relationship with suppliers | |||
| Good neighborliness | 111 Improve health, safety, and environment | Number of safety incidents | |
| Rate of absenteeism | |||
| Learning and growth | Motivated and well-prepared staff | L1 Climate for action | Employee survey |
| L2 Fundamental skills and competencies | Staff hierarchy table (%) | ||
| L3 Technology | Availability of strategic information |
Table 8.4 Balanced Scorecard Related Incentives
| CATEGORY | INDICATORS | WEIGHTING (%) |
| Financial (60%) | Shareholder value | 18 |
| Return on capital employed (ROCE) | 13 | |
| Economic value added (EVA) | 13 | |
| Free cash flow | 10 | |
| Operating costs | 6 | |
| Client (10%) | Client satisfaction index | 7 |
| Rate of growth of market | 3 | |
| Internal processes (10%) | Process quality index | 3 |
| Product quality index | 3 | |
| Productivity | 4 | |
| Training and growth (20%) | Employee quality index | 20 |
Table 8.5 A Software Quality Profile
| QUALITY PROFILE DIMENSION | CRITERIA |
| Design/code time | Design time should be greater than coding time |
| Design review time | Design review time should be at least half of design time |
| Code review time | Code review time should be at least half of coding time |
| Compile defect density | Compile defects should be <10 defects per thousand lines of code |
| Unit test defect density | Unit test defects should be <5 defects per thousand lines of code |
The corporate quality department created very specific guidelines for how metrics should link the cascaded scorecards. These guidelines indicate that all top-level scorecard critical success factors (CSFs) for which the department is responsible must link metrically to lower-level cards. Three criteria were established to accomplish this:
- Inclusion: Top-level CSFs must be addressed by lower-level CSFs to achieve top-level metric goals.
- Continuity: CSFs must be connected through all levels. Lower-level measurements should not have longer cycle times than higher-level measurements.
- Robustness: Meeting a lower-level CSF goal must assure that high-level CSF goals will be met or even surpassed.
As you can see, the goals in all card levels align with the goals in the next level above, and the goals become fewer and less complex as you drill down through the organization.
The CSFs, selected by the departments that had a major controlling responsibility, were the key balanced scorecard indicators. The management team of each business unit selected CSFs that would distinguish the business unit from the competition. They used a value map to assist in determining the customer CSFs and then derived the process CSFs by determining how process improvements can deliver customer requirements. Competence CSFs were identified by figuring out what human resource competencies were required to deliver the other three perspectives of the card. Standard financial reporting metrics were used for the financial perspective.
At this point, each business unit was charged with figuring out what key indicators could best measure the CSFs. The business units had to make some assumptions about the relationships between the processes and results to derive performance drivers and targets. These targets were set based on the gap between current performance and what was desired 2 and 4 years into the future. The criteria for these targets were that the targets had to be specific, measurable, realistic, and time phased. The targets themselves were derived from an analysis of market size, customer base, brand equity, innovation capability, and world-class performance.
Indicators selected included
- Financial: Economic profit realized, income from operations, working capital, operational cash flow, inventory turns
- Customers: Rank in customer survey, market share, repeat order rate, complaints, brand index
- Processes: Percentage reduction in process cycle time, number of engineering changes, capacity utilization, order response time, process capability
- Competence: Leadership competence, percentage of patent-protected turnover, training days per employee, quality improvement team participation
In cascading the scorecard throughout its different levels, six indicators were key for all business units:
- Profitable revenue growth
- Customer delight
- Employee satisfaction
- Drive to operational excellence
- Organizational development
- IT support
In one of the business units, Philips Medical Systems North America, results are tracked in real time. Data are automatically transferred to internal reporting systems and fed into the online balanced scorecard report with the results made immediately accessible to management. The results are then shared with employees using an online reporting system they call Business Balanced Scorecard On-Line. To share metrics with employees, they use an easy-to-understand traffic-light reporting system. Green indicates that the target was met, yellow indicates inline performance, and red warns that performance is not up to par.
Process Performance Metrics
Some researchers contend that organizations are shooting themselves in the foot by ignoring web analytics. Swamy (2002) states that without this link, a major portion of the organization’s contributions to success and/or failure is missing. He contends that most online initiatives have a dramatic impact on offline performance. Therefore, excluding web analytics, as immature as these statistics are, precludes senior executives from seeing the whole picture.
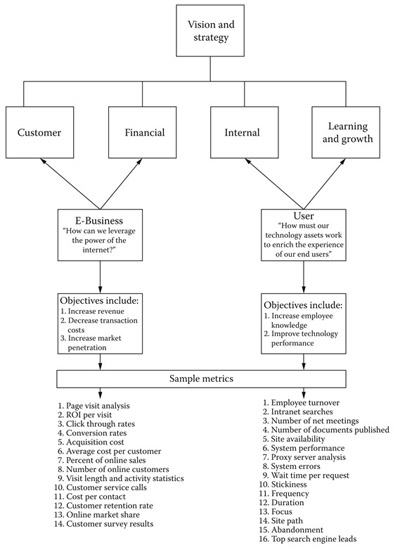
Figure 8.2
Web analytics added to the balanced scorecard.
Swamy recommends adding two new perspectives to the balanced scorecard, as shown in Figure 8.2.
IT processes are project oriented. Stewart (2001) makes the following metric recommendations when establishing project-specific balanced scorecards:
- Financial
- Customer
- Project meeting intended objectives
- Customer satisfaction (including account payment history)
- Economic value added (strategic benefits rather than financial benefits achieved referability, increased venture capital support, etc.)
- Project/internal business
- Project resource requirements management
- Average management time of project manager related to total effort
- Project portfolio comparatives
- Project cancellation rate
- Project backlog—awaiting start-up
- Risk management statistics
- Contingency time allotted and used
- Change management statistics (number of change records per designated period of time can show whether proper project scope has been set, percentage change to customer/vendor environment impact to scope)
- Quality management statistics (rework, issues, etc.)
- Project team member satisfaction
- Project resource requirements management
- Growth and innovation
- Average capabilities per team member and improvement over course of project
- Development or ongoing improvement of templates, procedures, tools, and so on
- The rate that innovative ideas are developed (new ways of doing things)
- Best practices identified
- Lessons learned and applied
- Positive achievements/impacts to the organization
- Evaluate quantitative statistics
- Examine true costs of operation, evaluating impact of project slippage and inadequate support and nonsupport infrastructure costs
- Evaluate organizational change
- Evaluate how the change has impacted the organization’s business
- Reduce to lowest common denominator
- Review support costs versus costs of delay per person
- Review actual project costs versus plans (net present value)
- Review strategic objectives achieved
- Review qualitative statistics
- Identify unanticipated benefits accrued
- Review attainment or contribution to organizational objectives versus time commitment
- Review overall business value improvement
- Revenue increase/decrease
- Team retention and promotion
- Increased market share, references
Shared First
The goal of the “shared-first,” which is an approach recommended by the U.S. federal government’s CIO Council (2013) is to improve performance, increase return on investment (ROI), and promote innovation. Through shared services, separate departments within an organization may eliminate duplication of cost structures, reduce risk, procure needed services, implement new capabilities, and innovate in a rapid and cost-efficient manner. The specific goals for implementing shared services include
- Improve the ROI through the coordinated use of approved interdepartmental shared services
- Close productivity gaps by implementing integrated governance processes and innovative shared service solutions
- Increase communications with stakeholders as managing partners, customers, and shared service providers work together to ensure value for quality services delivered, accountability, and ongoing collaboration in the full life cycle of interdepartmental shared services activities
“Shared first” principles will produce a number of beneficial outcomes, which include the following:
- Eliminate inefficient spending that results from duplicative service offerings and systems
- Enhance awareness and adoption of available shared services across the organization; promote agility and innovation by improving speed, flexibility, and responsiveness to provisioning services through a “shared-first” approach
- Focus more resources on core mission requirements rather than administrative support services
- Spur the adoption of best practices and best-in-class ideas and innovations
- Reduce the support costs of redundant IT resources
- Improve cost-efficiencies through shared commodity IT
There are two general categories of shared services: commodity IT and support. These may be delivered through cloud-based or other shared platforms. Commodity IT shared services opportunities include IT infrastructure (e.g., data centers, networks, workstations, laptops, software applications, and mobile devices), and enterprise IT services (e.g., e-mail, web infrastructure, collaboration tools, security, identity, and access management). Commodity IT is asset oriented, while enterprise IT services may, at times, be more utility oriented (defined as purchasing-by-usage rate). Support services are defined by the capabilities that support common business functions. These include functional areas such as budgeting, financial, human resources, asset, and property and acquisition management.
The following steps indicate tasks and activities, best practices, and risk areas with mitigations to consider and prepare for when implementing shared services.
Step 1: Inventory, Assess, and Benchmark Internal Functions and Services
This task focuses on determining the best set of candidate services to consider for potential migration to shared services. Each business unit should have an existing inventory of applications and systems mapped to functions and processes as part of their enterprise architecture. Business units should start with this list to identify the gaps and redundancies in capabilities to identify shared services candidates.
Tasks
- Create an analysis team consisting of business, technology management, and subject-matter experts (SMEs) to build participation and consensus.
- Review the organization’s business and technology architectures to identify opportunities to improve service delivery quality and/or reduce cost structures in existing services. Identify specific data and process flows used in the business unit(s). The degree to which a shared service is compatible with internal processes and data flows will dictate the effort needed to transition to shared services. Large mismatches between the shared service and internal processes/data indicate significant change management issues will need to be addressed before the shared service can be implemented successfully.
- Document what is required and what is not. This will involve listing business functions, their supporting systems and applications, and talking with their owners, sponsors, and users. Key areas to consider include
- Redundant systems and applications
- Business processes that are manual or paper-driven or only partially automated
- Old systems that are due for replacement or redevelopment for reasons such as functionality enhancement, expansion to meet increased usage, or new architectural platforms
- Unmet needs or new mandates
- Estimate the costs to provide the existing service internally for the selected legacy functions or services. Cost savings will be a significant driver, but not the only factor, in the decision to transition to a shared service. Other factors that may be considered include quality of service, enabling additional functionality and capabilities, more efficient processes, and improvement to management information and decision-making capabilities. If actual data are not available, the best possible estimates should be used. This step should take days or weeks, at most, to complete. Both IT and business unit costs should be included. This is especially important for candidate legacy services that currently do not employ technology automation. Include the human resources costs (e.g., for employees and contractors) that exist in both the business and IT organizations.
- Identify the major functions (e.g., capabilities) of the current and candidate services and processes. The list should address required as well as desired functionality, and include processing, servicing, data ownership, security, work flow, and similar requirements. Create a function and features checklist and an initial statement of work (SOW) for evaluating shared service providers.
- Translate costs into per transaction or annual per user costs. This may provide a baseline for comparisons to similar systems in smaller or larger agencies or shared services.
- If the service and supporting system is extensive and involves several integrated components, attempt to decouple the components. Decoupling identifies integration points and makes a modular approach possible, reducing risk exposure. Review the costing information. Determine the estimated cost of each component, if possible, and translate those costs into per transaction or annual per user costs.
- Create a change readiness evaluation checklist to assess your organization’s readiness to transition from today’s environment to a shared services solution. Research and document the answers to checklist questions such as the following:
- Does a sponsor or champion exist on the business side who is willing to lead the transition? What is his or her level of involvement and commitment?
- Are there multiple user groups or business areas impacted by the transition?
- Is the organization ready to give up the “we are unique” point of view?
- Is there organizational leadership to push organization subunits to get onboard?
- Have users been involved in considering the change?
- Have specific resistance issues and concerns been documented?
- Do technical resources exist to plan and execute the transition; and if not, how can they be obtained?
- What are the annual costs for each function being considered (e.g., per person, per transaction, or fixed fee)?
- Has funding been committed (or is it available) to cover the transition costs?
- What is required of the vendor or third party to ensure a successful transition to the shared service?
- Does a strategic communication plan exist to ensure that participants and other stakeholders are engaged in the process?
Step 2: Identify Potential Shared Services Providers
Service catalogs should be created that list all functions and services supported throughout the organization. This catalog can be used to locate and contact shared service providers that align with a prioritized list of candidate opportunities for transition. Business units should compare their internal shared service offerings and assessments of internally supported functions and services with the service catalog offerings to determine which internal functions and services may be viable candidates for migration to shared services. The results of the search should be a “short list” of potential service providers. Specific activities within this step include
Tasks
- Create a customer/user team to conduct market research. Cultural resistance to the transition may be overcome by including stakeholders in the decision-making process. The team’s buy-in to the endeavor will make the change easier.
- Conduct market research by using the shared services catalog. Meet with each shared service provider to understand the capabilities and functionality of their services and then evaluate their capabilities against the set of requirements, functions, processes, and criteria that was created in Step 1. Track each provider’s ability to meet the required and desired services and service levels. If a shared service does not exist in the shared service catalog, contact shared service providers to see if they would be willing to develop one.
- Create or obtain a shared service cost model for each potential provider that meets the requirements of your candidate system. Elements to be included in the model are shown in Table 8.6.
Step 3: Compare Internal Services versus Shared Services Providers
The selection of the best value shared service is guided by, among other criteria, a comparison of internal legacy service costs with those of the potential shared services and the performance quality they deliver to end users. In the transition year(s), costs may be higher due to the support of two services—legacy and shared. However, in the out years, cost savings should accumulate. The resulting cost comparison forms the financial basis of a business case to inform the leadership team on whether or not to proceed with a shared service. Other aspects of the business case include strategic alignment; qualitative value, such as cost avoidance, improved management information, quality of service, and risk analysis. Ultimately, the shared services that business units implement are based on their own unique business model, culture, organizational structure, and risk tolerance. The business case should address what, when, and how to move business capability and its delivery into the shared services environment.
Table 8.6 Shared Service Cost Model
| YEAR 1 | YEAR 2 | YEAR 3 | TOTAL | |
| HARDWARE | ||||
| • Production/dev/test | ||||
| • Disaster recovery | ||||
| SOFTWARE SERVICES | ||||
| • OS and database | ||||
| • COTs | ||||
| • Requirements management | ||||
| • Application development | ||||
| • Database administration | ||||
| • Testing management | ||||
| • Project management | ||||
| ONGOING SUPPORT | ||||
| • Hosting costs | ||||
| • Data conversion | ||||
| • Development/enhancement labor | ||||
| • Maintenance labor | ||||
| • Help desk | ||||
| • HW maintenance | ||||
| • SW maintenance | ||||
| • Information security | ||||
| • Network & telecom | ||||
| • Training | ||||
| • Communication |
Step 4: Make the Investment Decision
Using the results of the function and features checklist, change readiness evaluation checklist, and legacy and shared service pricing comparison and analysis, the leadership team determines whether or not to proceed with the transition to a shared service. If a decision to transition to a shared service is made, then formalize a project team and proceed with developing a project plan and negotiating the service-level agreement (SLA). Both business and IT staff should participate in this effort. If the decision is made not to transition to a shared service, then document the rationale for not proceeding or for deferring the transition.
Step 5: Determine Funding Approach
There are several methods that consuming business units may use to fund shared services. These methods are determined in part by the type of service being procured and the provider’s offering.
Step 6: Establish Service-Level Agreements
The organization and shared service provider need to negotiate, agree, and formally document the services and service levels to be provided. The agreement needs to include, at a minimum, a project title, names of the parties to the agreement, the purpose of the agreement, the duration of the agreement, a termination provision, a dispute resolution provision, and a return path or exit strategy if things do not work out as per expectations.
Step 7: Postdeployment Operations and Management
Once a process, capability, and supporting system(s) have transitioned to a shared services provider, ownership and management of the service does not end. Active daily management from a contractual and performance perspective must still be maintained. Organizations need to remain actively engaged with the service provider to ensure the long-term success of the transition and achieve the benefits identified in the business case.
Configuration Management
CM provides the means to manage technology-related processes in a structured, orderly, and productive manner. As an engineering discipline, CM provides a level of support, control, and service to the organization. CM is a support function in that it supports the program, the corporation, and, in a number of situations, the customer.
The process of CM has not really changed much during the past 20–30 years. However, the environment that CM operates within has changed significantly and is likely to continue to change. Regardless of the fast-paced changes in the technology arena, the process of CM is basically immutable—that is, the process does not change, only what is being managed changes. The key is in the process.
CM and Process Improvement
Improvement depends on changing current processes along with the accompanying environment. CM, then, provides the underlying structure for change and process improvement. We refer to this as process-based CM.
For example, the first step to improve the product is to know how the product is currently produced. The second step for improvement is to foster an atmosphere in which change can be readily accommodated. If change does not appear possible, then improvement is also unlikely. CM measurements of current practices and their associated metrics can help identify where processes are working and where they need to be improved. Such change efforts should lead to increased productivity, integrity, conformance, and customer satisfaction.
CM can be defined as the process of managing the full spectrum of an organization’s products, facilities, and processes by managing all requirements, including changes, and assuring that the results conform to those requirements. By this definition, CM can also be called process configuration management because it includes the process of managing an organization’s processes and procedures.
Many organizations can be characterized as Level 1 organizations as defined in the SEI’s software capability maturity model. These Level 1 organizations rely heavily on “heroes” to accomplish the work. The organization’s processes are not documented, and few people know how the work is accomplished, how things are organized, and even where things might be located. The process is characterized as ad hoc, and occasionally even chaotic.
An effective CM program organizes all of this. Any changes, updates, and needed additions are tracked and documented. Adhering to these policies and procedures will reduce the likelihood of problems with employees using unapproved hardware, software, and processes.
Implementing CM in the Organization
One of the first steps in successfully implementing CM is to obtain management sponsorship. This means public endorsement for CM, and making sure the resources needed for success are allocated to the project. Management also needs to establish CM as a priority and help facilitate implementation.
An organization can maintain management sponsorship by identifying and resolving risks, reporting progress, managing CM implementation details, and communicating with all members of the organization.
The next step is to assess current CM processes. Every organization is practicing some type of CM. This may not be a formal process or even thought of as CM. After assessing your current processes, the next step is to analyze your requirements. What is it that your organization wants to accomplish? The requirement may be an ISO 9000 certification, some other standard or certification, or simply to improve.
Document the requirements for your organization, how you will implement them, and how you will measure success. Depending on the requirements of your organization, the various roles and formality of the CM team may differ. At a minimum, there should be a point of contact for CM. Other recommended roles and functions include
- A control and review board should be in place to analyze and approve changes.
- Managers and leaders also play a role in CM in establishing or following a CM plan, ensuring requirements are properly allocated, ensuring adequate tools are available to support activities, and conducting regular reviews.
- A librarian is also necessary to track baselines and versions of files included in each release. A CM tool can assist in those activities.
- QA can be used to verify that documented CM processes and procedures are followed.
In Conclusion
Organizations are composed of systems, which are composed of individual processes. For an organization to improve its performance, it must embark on a systematic approach to optimize its underlying processes to achieve more efficient results.
References
Brock, J., Saleh, T., and Iyer, S. (2015). Large-scale IT projects: From nightmare to value creation. BCG Perspectives, May 20. Retrieved from https://www.bcgperspectives.com/content/articles/technology-business-transformation-technology-organization-large-scale-it-projects/.
CIO Council. (2013). Federal shared services implementation guide, April 16. Retrieved from https://cio.gov/wp-content/uploads/downloads/2013/04/CIOC-Federal-Shared-Services-Implementation-Guide.pdf.
Denman, J. (2015). Continuous development carries continuous improvement into 2015. Software Quality Insights, January 12. Retrieved from http://itknowledgeexchange.techtarget.com/software-quality/continuous-development-carries-continuous-improvement-into-2015/. Desmet, D., Duncan, E, Scanlan, J., and Singer, M. (2015). Six building blocks for creating a high-performing digital enterprise. McKinsey & Company Insights & Publications, September. Retrieved from http://www.mckinsey.com/insights/organization/six_building_blocks_for_creating_a_high_performing_digital_enterprise?cid=other-eml-nslmip-mck-oth-1509.
Gumbus, A. and Lyons, B. (2002). The balanced scorecard at Philips Electronics. Strategic Finance, pp. 45–49, November.
The Hackett Group. (2015). The CIO agenda: Key issues for IT in 2015. Retrieved from http://www.thehackettgroup.com/research/2015/keyissuesit15/.
Solano, J., Perez de Ovalles, M., Rojas, T., Griman Padua, A., and Mendoza Morales, L. (2003). Integration of systemic quality and the balanced scorecard. Information Systems Management, pp. 66–81, Winter.
Stewart, W. (2001). Balanced scorecard for projects. Project Management Journal, pp. 38–52, March.
Swamy, R. (2002). Strategic performance measurement in the new millennium: Fitting web-based initiatives into a company’s balanced scorecard is critical. Here is a guide on how to do it. CMA Management, 76(3), 44(4), May.
Unisys. (2003). Performance-based contracting: Measuring the performance in the information technology utility. White Paper.
Wright, W., Smith, R., Jesser, R., and Stupeck, M. (1999). Information technology, process reengineering and performance measurement: A balanced scorecard analysis of Compaq Computer Corporation. Communications of AIS, 1, Article 8, January.