
Termination Diagonal Triangle Pattern
The Diagonal Triangle you will see most often brings a message of market trend exhaustion. It is running on fumes in the direction of the larger trend. The pattern has a wedge appearance and the internals of these patterns are all corrective patterns building upon one another.
As an example, Figure 4.1 was a Termination Diagonal Triangle that developed in the S&P 500 mini futures contract in a 60-minute time horizon. If your company saves intraday data, you will find this pattern in the data that developed from February 10 to February 22, 2011. Figure 4.1 is a classic example of these patterns, showing you that the resolution is a fast market retracement to the origin of the wedge pattern.
FIGURE 4.1 S&P 500 Mini Futures, 60 Minutes Forming a Diagonal Triangle
Source: Aerodynamic Investments Inc., © 1996–2012, Daily Market Report, www.aeroinvest.com; TradeStation.
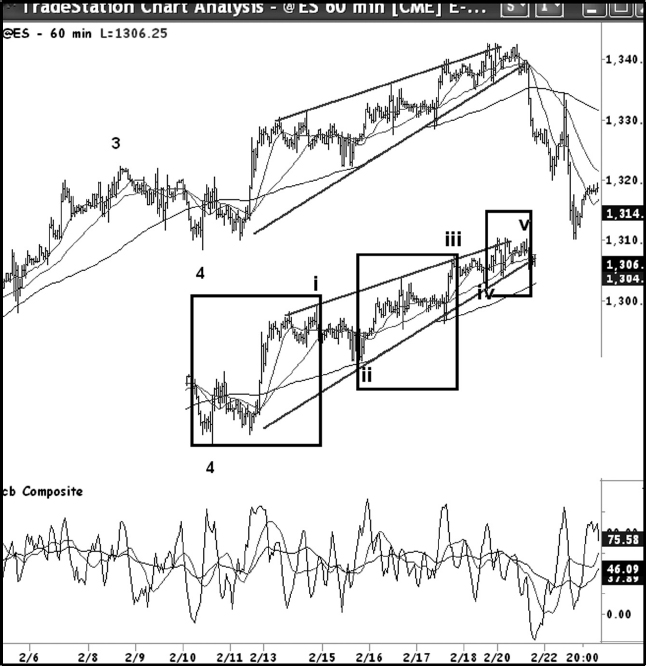
Below the actual market chart is a copy of the wedge with the impulse waves i, iii, and v all contained within their own boxes. The slope of each is easily compared by looking at an imaginary line running from the bottom left corner to top right corner. The slope falls forward in each box relative to the previous box.
The termination wedge follows the same guideline as developing triangles. Each wave must be a three-wave pattern, and you will often see them alternate in each wave as to the corrective pattern they display. In Figure 4.1 this wedge defines three corrective patterns within each box. The box to the left is an expanded flat. The ‘B’ is a failure as it did not fall below the ending of wave ‘4’, which is also the start of wave ‘a’ in an expanded flat pattern. I am comfortable with this because the trend preceding this failure was so strong. If you believed the first small move up (above ‘4’) is a five-wave pattern, you would call the move into the end of wave ‘i’ a zigzag pattern. You can see how different patterns might be used to describe a pattern and they do not change the end of the move or the outcome that follows. That is very important to understand. In the real world the market may hand you a structure that falls in a gray area when you have to label it. Use common sense. In this case, you would not know a termination wedge was about to occur from just the data that creates wave ‘i’ of 5. But you catch on very quickly when wave ‘ii’ is clearly a corrective choppy pattern. Wave ‘iii’ grinds onward and makes two new highs. All the choppy action and corrective swings warn that a rising wedge is under construction. The length of each bar is getting shorter and shorter, and some people might have considered the middle leg in wave ‘iii’ to be a distribution top. I do not use classic patterns such as distribution patterns because they have a low probability for giving guidance on when to execute the trade. But if you know enough to use the oscillator for guidance it is too soon to think the end will occur in the middle of wave ‘iii’ of 5. The use of oscillators will be covered in a higher skill level.
Consider the middle box far more closely. Within the middle box there is a swing up followed by a choppy sideways stall, followed by a small thrust up from the chop to end wave ‘iii’ of 5. This is where many people are drawn in too early to execute trades for the decline to come. They label the first swing up as wave ‘iii’, the sideways price chop as wave ‘iv’, and the last move up as wave ‘v’. They try to fit all the required waves—‘iii’, ‘iv’, and ‘v’—into the middle box. But if you know about the slope comparison between impulse waves ‘i’, ‘iii’, and ‘v’, you would know the top right corner of the middle box is only the end of wave ‘iii’. Then a correction that is shallow develops and that leads to the third box. Inside this third box we have a contracting triangle. The market has exhausted the upward trend and the reaction is strong and swift as a counter-trend move unfolds.
Where is the safest place to enter an order to sell this market? It is not anywhere within the wedge. If you try to catch the top you could be forced to stay out of the counter-trend move because your losses are so large from stepping in several times prematurely. When the move finally occurs, which you had anticipated, you are wounded on the sidelines with no entry level of low risk to step in. Don’t be the guy who has to hold the top ticket for the move. There are no bonus chips for being first. That took me years to learn when I was just beginning. You think you want to be first so you can just sit there and enjoy the ride. A safer place is to sell as the market stalls under the lower trend line of the wedge for several hours. The truth is you do not know if the pattern is complete because that small pullback that stalls under the trend line could have become wave ‘iv’ that creates its own triangle pattern. But the Composite Index under the data is telling me otherwise as it is topping at an old resistance level. That is why I apply all the methods that I have developed a familiarity with to build a wave interpretation. If I know a Gann target date, the time element will be more important than the pattern itself. If the date needed more time, an extension in the wave ‘iv’ position would have been favored. Whether you know these other methods of technical analysis or not, the message does not change what Elliott described for us. These wedges with overlapping internals that develop corrective patterns linked together are trend killers. Pay attention to them.
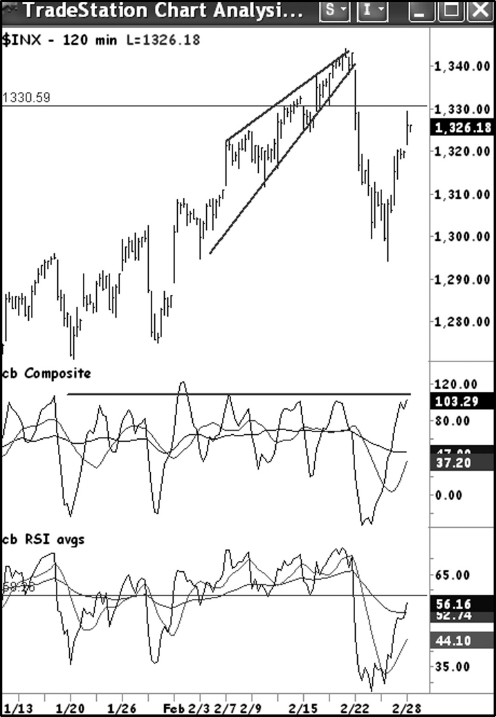
Diagonal Triangles love company. Figure 4.2 is slightly different than Figure 4.1. Follow both Cash and Futures, as the minor differences will help your entry timing. This is the same underlying market relative to the futures chart in Figure 4.1. But you may see wedges develop in T-Bonds, or metals, or other financial markets all at the same time. When you do see this you know something big is coming. Let’s test your understanding of Diagonal Triangle patterns to this point.
FIGURE 4.2 S&P 500 Cash Index, 120-minutes—A Diagonal Triangle with Pattern Resolution
Source: Aerodynamic Investments Inc., © 1996–2012, Daily Market Report, www.aeroinvest.com; TradeStation.
QUIZ:
Is Figure 4.2 correct? Remember, every swing will create a complete corrective pattern.
STOP
![]()
Well, this example is incorrect. The first wave of the wedge has to start from the pivot low just to the left. A chart can be found in the Exercise Appendix in Figure 4.2a. The first wave of the wedge connects more than one basic corrective pattern. When this happens we call them complex corrections. But they only use the same basic patterns we covered in Chapter 3. I am going to separate the more complex corrections for the more advanced levels.
The way to see the start of the wedge is by correctly identifying the end of wave 4. Wave 4 is an expanded flat pattern though wave ‘c’ in the last leg does not break below wave ‘a’ in the first swing down in the box. The decline that follows the wedge in Figure 4.2 does not retrace the entire wedge. The only way to know if the first break is the first leg down in a larger decline, or an alternate scenario is to use oscillators.
Knowing how a wedge appears in a slightly longer time horizon can be important.
Figure 4.3 returns to the S&P 500 futures mini contract in a 240-minute time horizon. The time horizon is four times that used in Figure 4.1. The ratio of 1-to-4 is important. In this chart we see how the wedge fits within the larger trend. We see a fifth wave developing from a flat correction that just has waves ‘A’, ‘B’, and ‘C’ identified.
FIGURE 4.3 S&P 500 Mini Futures, 240-Minutes
Source: Aerodynamic Investments Inc., © 1996–2012, Daily Market Report, www.aeroinvest.com; TradeStation.

At the top of wave 5 where the Diagonal Triangle ends, the Composite Index is showing bearish divergence to both the price data and the 14-period RSI. RSI is failing to detect the trend change approaching. This is the reason I developed the Composite Index. The formula has momentum imbedded in it and serves to show when RSI is failing.
The underlying support levels in the chart show where Fibonacci confluence zones offer strong support. The corrective flat pattern in this chart is a fourth wave and the decline has fallen to the top of ‘B’ within the flat pattern. That is why the bounce that follows is significant. But that rally is a zigzag pattern and the last swing down shows the market retraces the entire corrective zigzag. The larger decline was incomplete.
The message a termination Diagonal Triangle will carry is a warning that the trend will reverse. The reversal that follows to the origin of the wedge is often the beginning of a much larger move.
The internals are all corrective and abide by the same rule for a corrective triangle. No swing marked as a complete wave within a termination diagonal triangle may have a five-wave pattern on its own.
Because we have both contracting corrective triangles and expanding corrective triangles, I do wonder if R. N. Elliott has one pattern omission. It would be an Expanding Diagonal Triangle. You run into them on rare occasions and I have always been able to find an alternate way to label them using the patterns viewed as the complete set we have already examined. But is there a fourteenth pattern? If there is, the DJIA pattern in Figure 3.10 is a scary proposition on what that pattern message is describing for the years ahead. I favor wave (E) down in a large fourth wave. So the message is the same up to a point. But then a few hard questions will have to be considered in the years ahead when the DJIA stalls on support levels at 5100 to 5400 or 4500.