Step 2—HA Primary Variables Gauge
It is now time to properly place your arrows (these will be relative value indications) on each of the primary variable gauges. The placement of the assessment arrow on each of the 10 variables should be done as accurately as possible and as rigorously as possible. Each variable continuum should be evenly divided into a scale of some kind and an exact value should be determined or calculated to help place the arrow. As an example, the cost of downtime (per hour) variable could be a scale from $0/hr at the bottom (left) to $500,000/hr at the top (right) for Company X. The $500,000/hr top scale value would represent what might have been the peak order amounts ever taken in by the online order entry system for Company X and thusly would represent the known dollar amount being lost for this period. Remember, everything is relative to the other systems in your company and to the perceived value of each of these variables. In other words, some companies won't place much value on the end-user tolerance of downtime variable if the application is for internal employees. So, adjust accordingly.
For all of the primary variable gauges you will need to
1. | Assign relative values to each primary variable (based on your company's characteristics). |
2. | Place an arrow on the perceived (or estimated) point in each gauge that best reflects the system being assessed. |
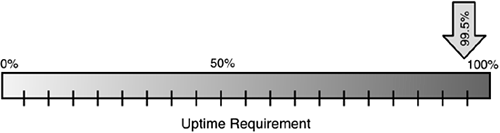
As another example, let's look at the first HA primary variable of total “uptime requirement percentage.” If we are assessing an ATM system, the placement of the assessment arrow would be at a percentage of 98% or higher. Remember that five 9s means a 99.999% uptime percentage. Also remember that this uptime requirement is for the “planned” time of operation, not the total time in a day (or a year)—except, of course, if the system is a 24x7x365 system. Very often the service level agreement that is defined for this application will spell out the uptime percentage requirement. Figure 3.1 shows the placement of the assessment arrow at 99.5% for the ATM application example. This places this application on the bottom edge of what we call “Extreme Availability” (at least from the uptime percentage point of view).