In this chapter:
Performance Monitoring Best Practices 367
Configuring Event Logs and Diagnostic Logging 372
Best Practices Analyzer for Windows SharePoint Services and SharePoint Server 377
Proper configuration of the native logging, auditing, reporting, and analysis tools allows you to maintain and continually improve your Windows SharePoint Services and SharePoint Server implementations. It is of particular importance to correctly configure logging and reporting in SharePoint Products, or you will have little data to troubleshoot in the event of a problem. Careful system monitoring can avert outages and is useful for quickly and accurately identifying and correcting problems should they arise. Note that, although it is important to maintain adequate system information, the amount of information can become overwhelming. Therefore, determine carefully and deliberately the levels of logging, auditing, reporting, and analysis you require because both too little and too much information can make interpretation difficult. Following is a list of the tools available to maintain and troubleshoot SharePoint Technologies:
System Monitor The System Monitor is useful for monitoring acute issues, such as memory utilization, CPU utilization, and disk I/O performance.
Counter Logs Counter Logs are ideal for long-term tracking of performance issues. They can be stored in an SQL database, which allows the data to be queried.
Alerts Alerts are triggered when critical values are met. They are useful for initiating monitoring or running other functions when a usage spike is encountered.
Trace Logs Trace Logs are useful when a server is severely affected or STOP errors are encountered.
Windows Event Logs Windows SharePoint Services and SharePoint Server are capable of sending events to the Windows Server Event Viewer, Eventvwr.exe. In fact, this is the most common method of routine monitoring and reporting of SharePoint Products.
All versions of Microsoft Windows Server include the basic set of tools required for successful performance monitoring. The most valuable native tool at your disposal is the Performance tool, which provides a core set of monitoring functions. The Performance tool can be found either by clicking on Start > All Programs > Administrative Tools > Performance, or from the Run prompt by typing perfmon.exe and ENTER. The default view of the Performance tool is System Monitor. When it opens you see the three default counters: Pages/Second, Average Disk Queue, and % of Processor Time.
System Monitor is the first view of the Performance tool and its most commonly used element. Figure 15-1 shows an example of the default view.

To monitor a performance object, click on the "+" symbol on the tool bar and a new window will then open.
In the new window define the computer, object, counter, and instance properties for the performance counter. The instance property is not required. Many items do not have an instance or have only a default instance that will be chosen and grayed out.
Click Add to monitor the newly defined counter.
Click the Close button to return to the System Monitor window. There is no limit to the number of counters that can be added to System Monitor, but after six to eight counters the view becomes difficult to interpret.
Counter Logs are located beneath the Performance Logs And Alerts heading of the Performance Monitor, as seen in Figure 15-2.
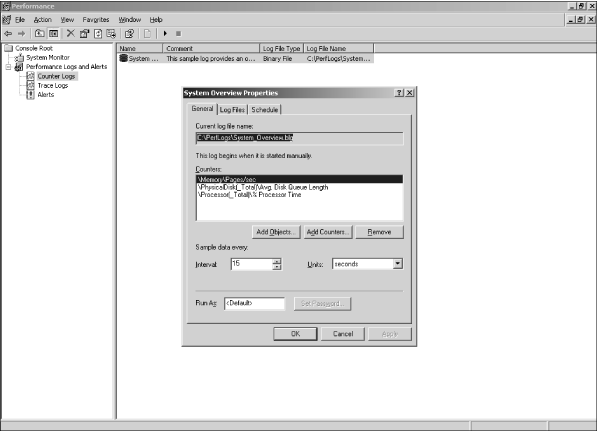
The Counter Logs are similar to the System Monitor, except that the output is sent to a file, rather than the screen. The same counters can be used, and it is possible to have multiple sets of counters monitoring at the same time. Monitoring Counter Logs adds several options, as explained in the following procedure.
Click on Counter Logs in the left pane of the Perfmon.exe window.
Right-click on one of the items in the right pane and select New Log Settings.… Type in a name of your choice and click OK.
Click the Add Counters button.
Select the computer, object, counter, and instance properties for the counter. The instance property is not required.
Under the Log Files tab, specify the type of log file you want to use, such as text or binary. Binary is typically more size efficient, but can only be read by the Performance tool. Logging to a SQL Server can be very useful because it allows for queries on your log data and is the most space-efficient option.
Under the Schedule tab, you can set a schedule for the logging operation.
Windows Server 2003 Trace Logs are not as configurable as counters and are therefore a less frequently used feature of the Performance tool. Trace Logs are meant to gather information from the system after the occurrence of a specific event. The events that trigger writing to a Trace Log are set by the system.
Trace Logs are typically used when there is a serious system problem that the Counter Logs are unable to record. Trace Logs use a lower level method of recording data that is less subject to system function interference. For example, if a certain type of network traffic is causing the system to crash, Counter Logs would not be able to gather data, but Trace Logs would.
SharePoint Products and Technologies provide rich trace logging, which is covered later in this chapter.
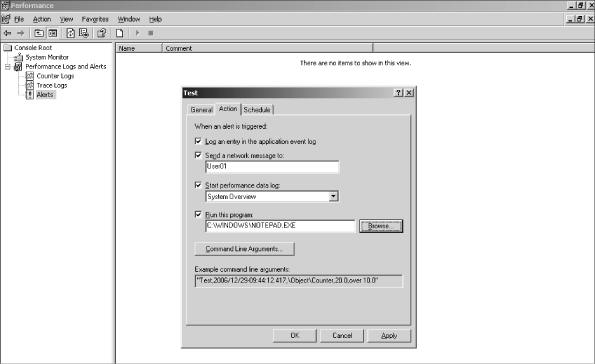
Alerts help you know when servers are reaching high levels of utilization. Alerts can be set on any number of counter thresholds, and once those thresholds are met, Alerts can inform administrators in a variety of ways. If a counter or set of counters reaches a threshold, several actions can occur. Figure 15-3 shows the types of actions available to the systems administrator.