![]()
Monitoring and Reporting
Introducing Azure Monitoring and Reporting
Monitoring IT services is critical to understanding how IT events impact the systems involved and to the users who rely on the IT services those systems provide. E-mail, although usually not a top-tier line-of-business application, is frequently monitored because outages and performance issues affect a large number of users in near real time. Organizations have embraced monitoring at various levels; some monitor everything and want deep insight into the errors that systems generate, whereas others just want to know that the systems hosting a service are up or respond to a ping.
The latter scenario doesn’t provide much value. To be able to monitor technology proactively, IT administrators need to be able to identify trends and thresholds and alert the necessary individuals when those thresholds are exceeded. Identifying trends facilitates capacity planning and also helps identify workloads that are good use cases for cloud computing. If you can identify a system that is never used on a weekend, at certain times of day, and so forth, that system’s services can be provided from the cloud and scale up and down as needed. To do so, you can use the auto-scaling capabilities provided by Azure, which would be cost prohibitive to set up on-premises.
The monitoring capabilities of Azure services vary, depending on the service you are examining. This chapter reviews Azure monitoring, logging, and alerting capabilities built into the following Azure services:
- Cloud Services
- Mobile Services (metrics for mobile endpoint availability only)
- SQL Databases
- Storage
- Virtual Machines
- Websites (metrics for web endpoint availability only)
This chapter is not designed to be a comprehensive guide to monitoring. Rather, it presents an overview of the built-in monitoring capabilities of Microsoft Azure for some of the mainstream services that consumers are using in Azure.
Monitoring a Microsoft Azure Websites
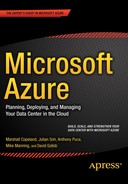
Microsoft provides a variety of web sites in Azure; at the time of this writing, there were 59 sites in the Azure Websites Gallery. Azure web sites, as shown in Figure 13-1 and Figure 13-2, are platform as a service (PaaS) offerings that run in a shared environment. Customers can set up their own Azure web sites on a number of different Windows OS versions or Linux OS version VMs, but the Azure Websites workspace provides PaaS web sites.
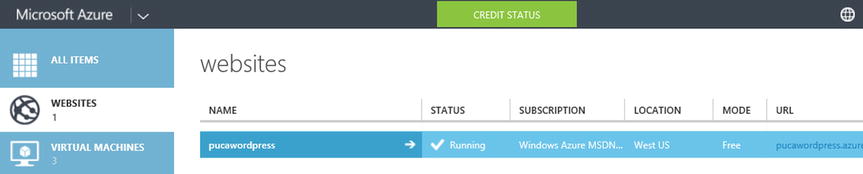
Figure 13-1. Azure web site in the Azure Management Portal
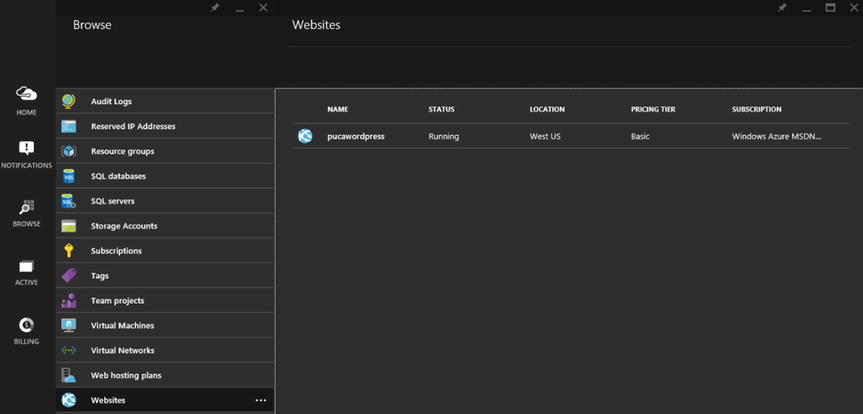
Figure 13-2. Azure web site in the new Azure Management Portal
To monitor availability information for web sites, you first need to enable endpoint monitoring for the appropriate resource. When you click the Azure web site that you wish to monitor, you are presented with a slew of options or tabs at the top of the page, including the dashboard and monitor.
![]() Note These tab fields are dynamic and updated as Microsoft releases new features into Preview. Look for the word Preview in green to identify newly released features. These features are not covered under the normal SLA until they are out of the Preview stage.
Note These tab fields are dynamic and updated as Microsoft releases new features into Preview. Look for the word Preview in green to identify newly released features. These features are not covered under the normal SLA until they are out of the Preview stage.
By clicking the dashboard tab on the Websites page, you can see how the following metrics are graphed:
- CPU Time
- Data In
- Data Out
- HTTP Server Errors
- Requests
Above the upper-right corner of the graph in Figure 13-3 are three items that allow you to configure the graph as you like. The first option specifies whether the graph is shown for ease of reading (Relative) or to the scale of the counters with a grid (Absolute). The second drop-down is the timeframe you wish to display: the last hour, the last 24 hours, or the last 7 days. The arrow in a circle acts as a refresh button for the graph data.
Figure 13-3. Azure web site dashboard showing performance data
These metrics are important to help you identify items such as how many hits your web site is getting and how much outbound traffic you are generating. Data Out is important because Azure customers pay for Data Out, or egress traffic, when they are not using ExpressRoute.
In Figure 13-4, you can see how different the new Azure Portal dashboard looks from the former one. This page scrolls down and provides quite a bit of additional data.
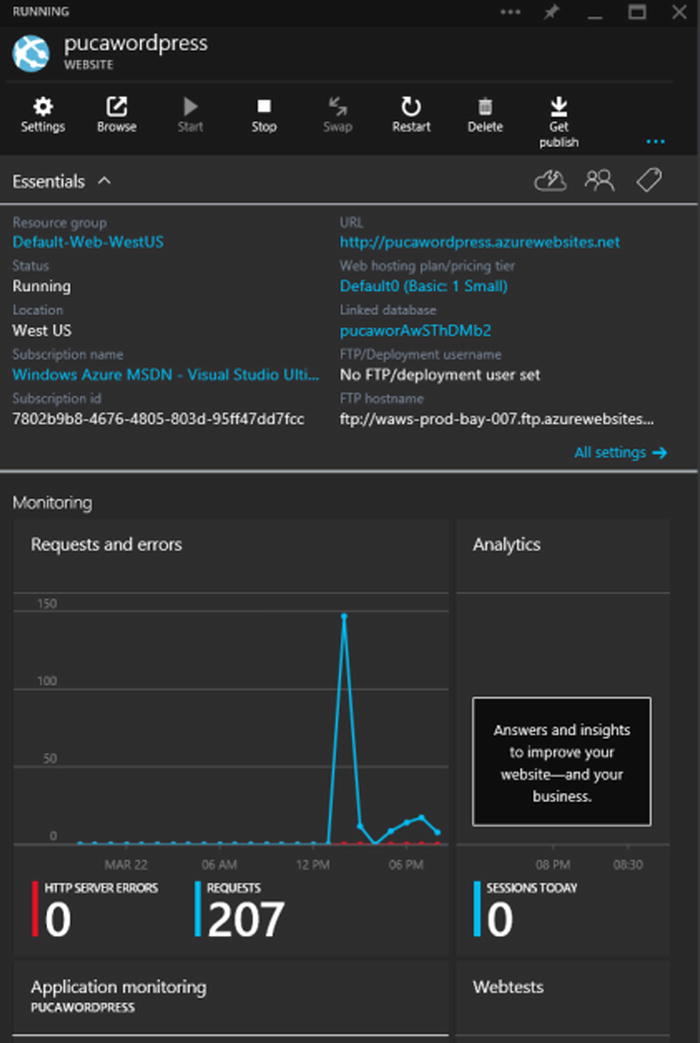
Figure 13-4. Azure Websites dashboard in the new Portal, showing performance data
Also notice that on the dashboard page, shown in Figure 13-5, you are presented with configuration items on the right, such as the connection strings, the site URL, and so on. Under Usage Overview is a series of graphs that represent near-real-time data metrics:
- CPU Time: Per day
- CPU Time: Per 5 minutes
- Data Out: Per day
- File System Storage: In GB
- Memory Usage: Per hour
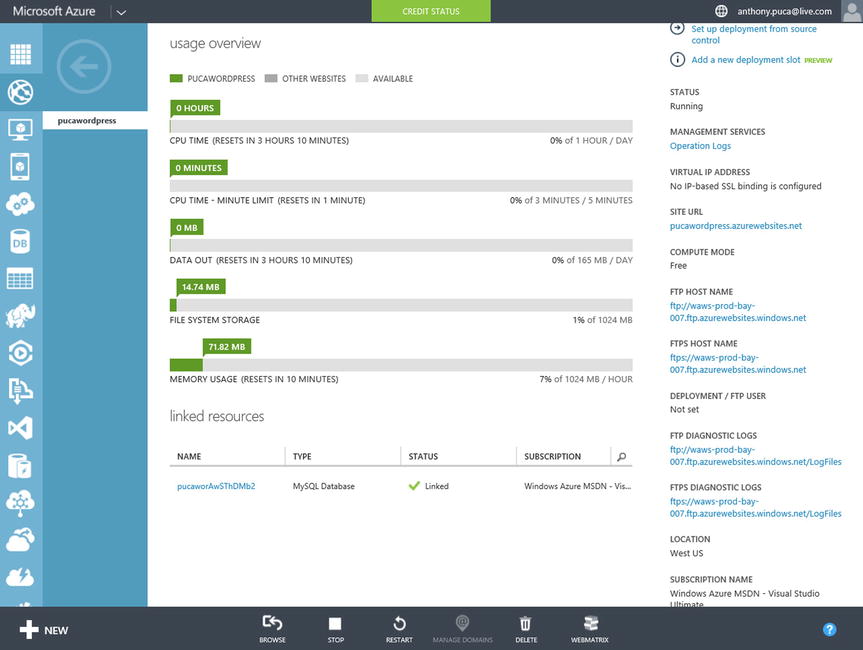
Figure 13-5. Azure Websites dashboard, showing usage data
In the new Azure Portal example in Figure 13-6, as you select or drill into items, fly-out menus and detail panes appear to the right.
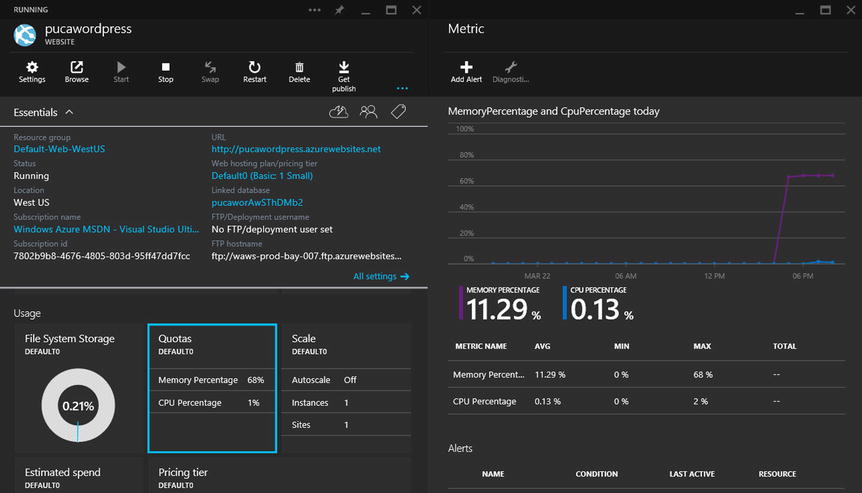
Figure 13-6. Azure Websites dashboard in the new Portal, showing usage data
When you click the web site’s Monitor tab, you see the same five counters that are graphed on the dashboard tab; see Figure 13-7. Their corresponding Min/Max/Avg/Total values are displayed, as well as whether any alerts are configured.
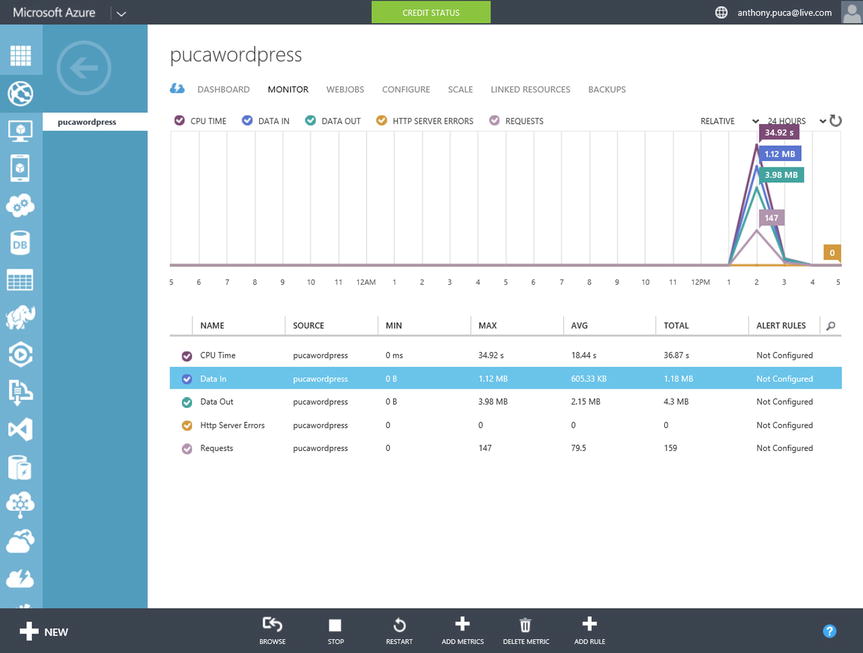
Figure 13-7. Azure web site in the Portal, showing the default monitors
Because only six counters can be graphed at once, it is important to understand how to tailor the graph to your specific needs. To remove some of the counters from the graph, simply click the checkmark on the left side of each counter’s line. The checkmark disappears, and the counter is grayed out, as shown in Figure 13-8.
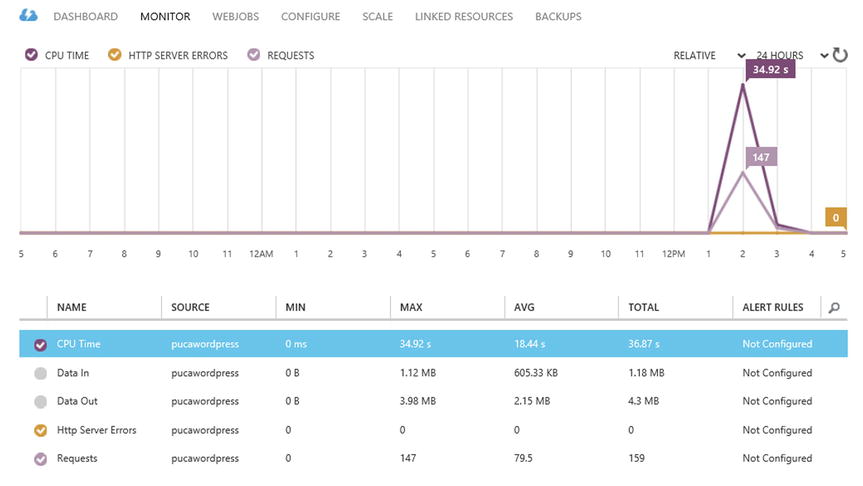
Figure 13-8. Azure web site in the Portal, showing disabled monitors
CREATING AN ALERT
Let’s say that you want to know whenever Data Out is greater than a specific amount. You can set a threshold and have Azure send you an e-mail when it is exceeded. To set up a web site monitor, follow these steps:
- On the Monitor tab of the web site you want to monitor, select the counter for which you want to create a threshold. In this example, use the Data Out counter.
- Select Add Rule at the bottom of the browser window, as shown in Figure 13-9.
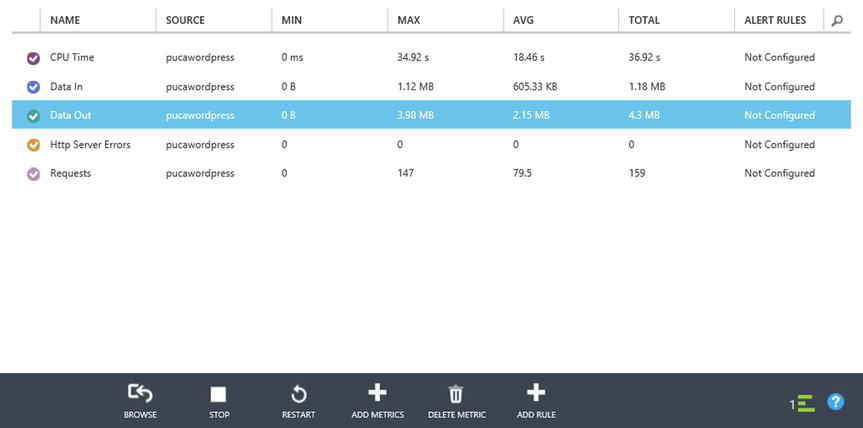
Figure 13-9. Configuring an Azure web site alert rule
- Give the alert a name and description, and then click the arrow in the lower-right corner, as shown in Figure 13-10.
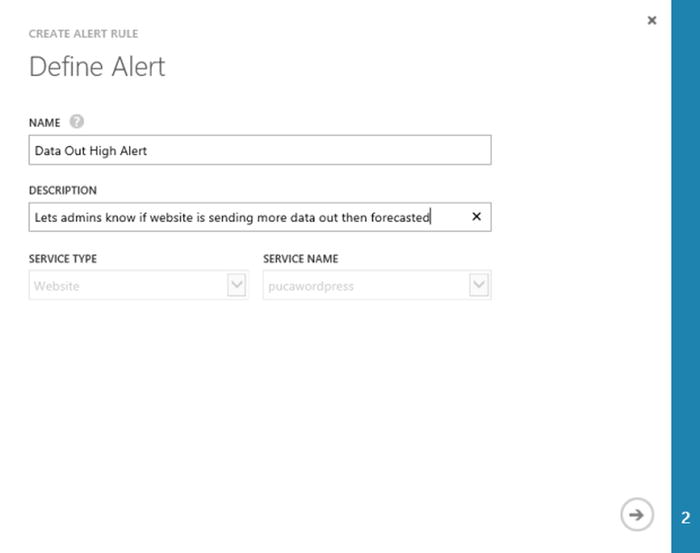
Figure 13-10. Azure web site alert-rule wizard
- Select the condition and threshold value, the window of time over which you want to evaluate the condition, and whom you want e-mails sent to, as shown in Figure 13-11.
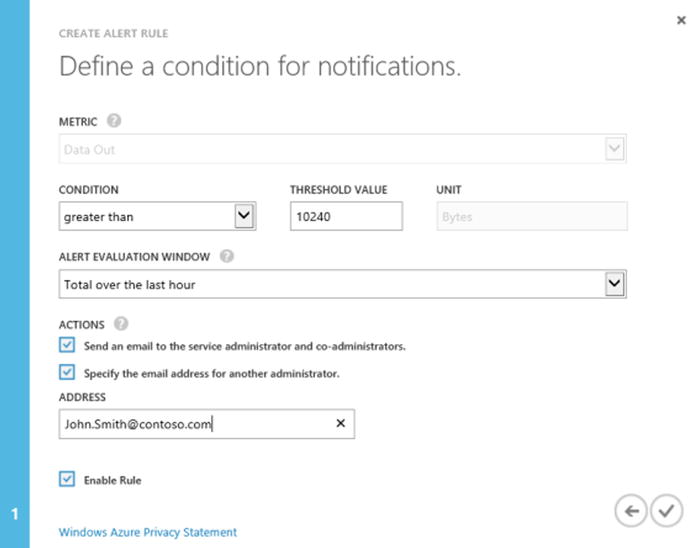
Figure 13-11. Specifying Azure web site alert recipients
- After you see the success-notification ribbon at the bottom of the Azure Portal, notice that the Monitor dashboard now reflects the rule you created. Click the hyperlink in the Alert Rules column to jump to the Management Services section of the Azure Portal, as shown in Figure 13-12.
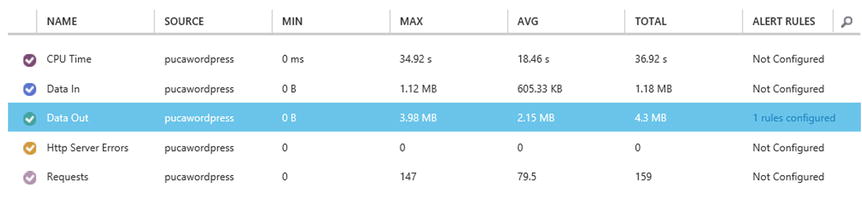
Figure 13-12. Azure web site alert rule configured
- Once the alert becomes active, you can see when the threshold is broken. Figure 13-13 shows that the alert status is at a warning level.
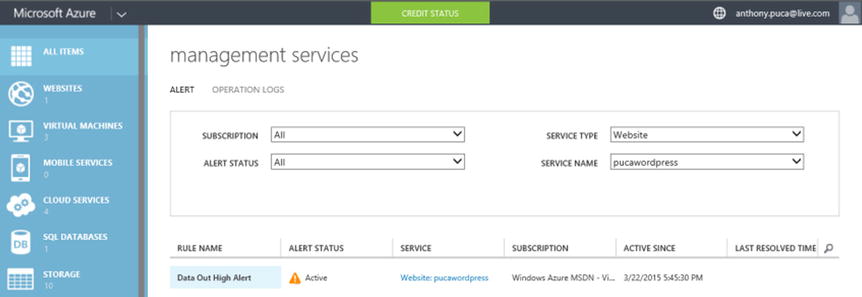
Figure 13-13. Azure Management Services workspace
- Click the rule’s name: in this example, it’s Data Out High Alert. You see a detailed view of the monitoring-rule data, as shown in Figure 13-14.
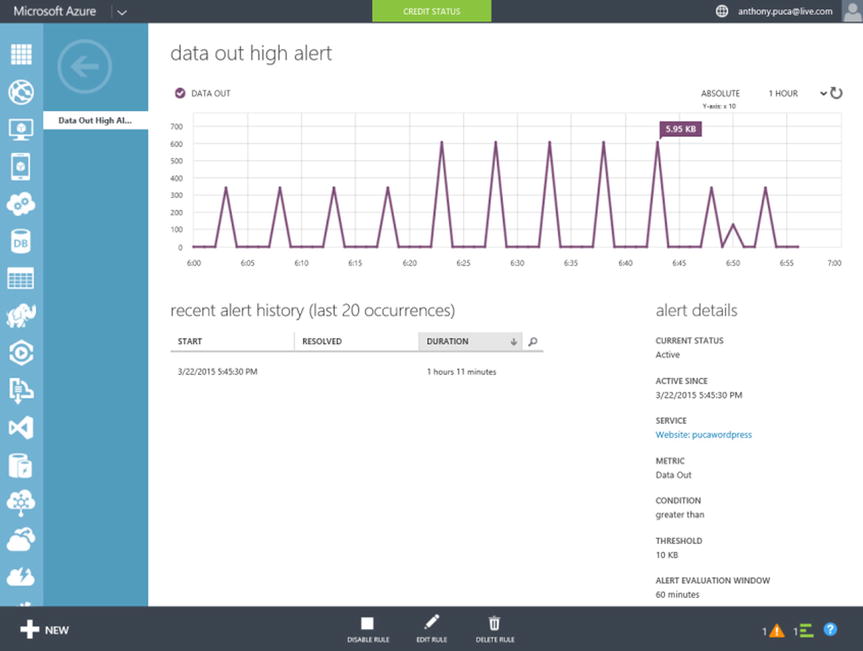
Figure 13-14. Azure Alert History view
Also notice in Figure 13-15 that at right, you can see the times the threshold has been exceeded and by how much it has been exceeded, as well as a number of attributes about this monitoring rule. The status of notifications and jobs appears in the lower-right corner of any screen in the Azure Portal.

Figure 13-15. Azure alert notifications
In the new Azure Portal, you create an alert rule by selecting Add Alert at the top of the metric graph. A flyout appears on the right, as shown in Figure 13-16, with all the necessary fields in one location.
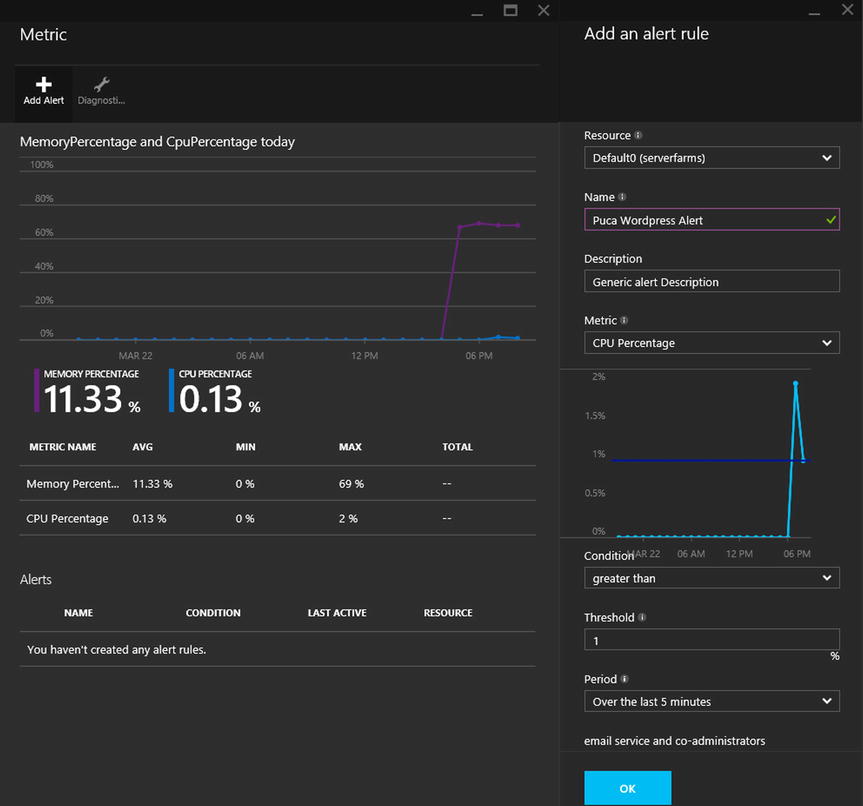
Figure 13-16. Adding an alert rule in the new Azure Portal
Metrics to Monitor
You can monitor other metrics and set thresholds to generate alerts in Azure. Table 13-1 lists the web site metrics available at the time of this writing.
Table 13-1. Azure Web Site Metrics
|
Name |
Unit |
|---|---|
|
AverageMemoryWorkingSet |
Bytes |
|
AverageResponseTime |
Milliseconds |
|
CPU Time |
Milliseconds |
|
Data In |
Bytes |
|
Data Out |
Bytes |
|
Http 401 errors |
Count |
|
Http 403 errors |
Count |
|
Http 404 errors |
Count |
|
Http 406 errors |
Count |
|
Http Client Errors |
Count |
|
Http Redirects |
Count |
|
Http Server Errors |
Count |
|
Http Successes |
Count |
|
MemoryWorkingSet |
Bytes |
|
Requests |
Count |
Table 13-2 lists the SQL database metrics available at the time of this writing.
Table 13-2. SQL Database Metrics
|
Name |
Unit |
|---|---|
|
Blocked by Firewall |
Count |
|
CPU Percentage |
% |
|
Data IO Percentage |
% |
|
Deadlocks |
Count |
|
DTU Percentage |
% |
|
Failed Connection |
Count |
|
Log IO Percentage |
% |
|
Storage |
Bytes |
|
Successful Connection |
Count |
Table 13-3 lists the VM metrics available at the time of this writing.
Table 13-3. Virtual Machine Metrics
|
Name |
Unit |
|---|---|
|
CPU Percentage |
% |
|
Disk Read Bytes/Sec |
Bytes/s |
|
Disk Write Bytes/Sec |
Bytes/s |
|
Network In |
Bytes |
|
Network Out |
Bytes |
Whenever you have services that are published via HTTP or HTTPS, you should use endpoint monitoring. Endpoint monitoring lets you monitor availability from geo-distributed locations. These tests will fail if the HTTP response code is 400 or greater or if the response time is greater than 30 seconds.
To configure endpoint monitoring, either select it from the dashboard or click the Configure tab and scroll down to the Monitoring section. As you can see in Figure 13-17, this is where you input a name, a URL, and up to three Azure locations from which you want to test connectivity.
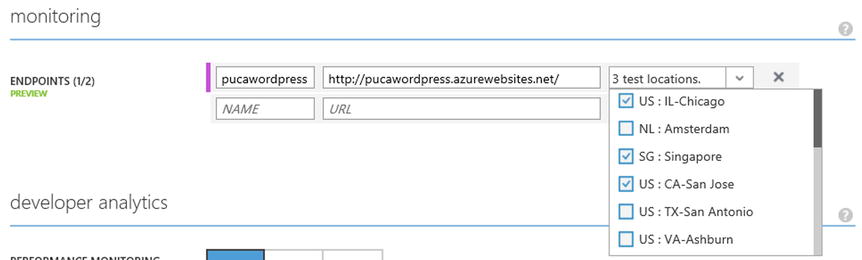
Figure 13-17. Configuring Azure endpoint monitoring
The status of endpoint monitoring is available on the dashboard of any service that supports it, as shown in Figure 13-18.
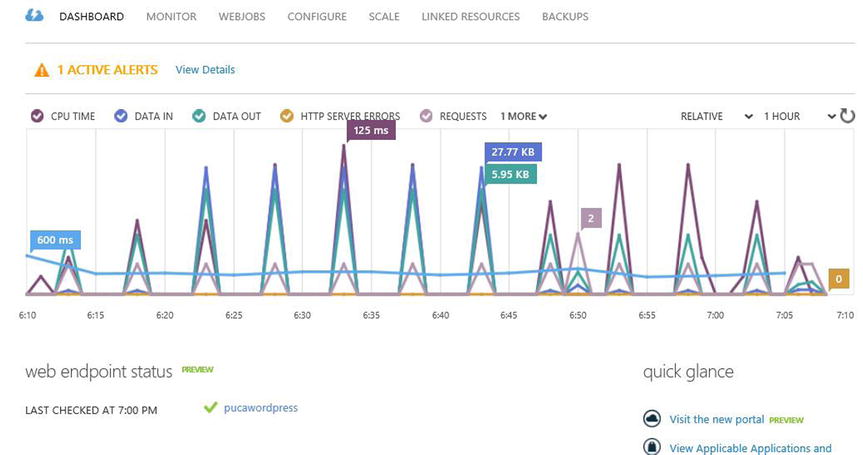
Figure 13-18. Azure endpoint monitoring history view
Endpoints currently support two metrics that you can monitor by creating a rule:
- Response Time in Seconds
- Uptime in Percent (%)
Monitoring Azure Virtual Machines
Azure VMs are monitored just like Azure web sites, with some small differences. For example, Azure VMs are provisioned with two endpoints already available. In Figure 13-19, port address translation is occurring through the Azure Management Portal to allow RDP access to the VM.
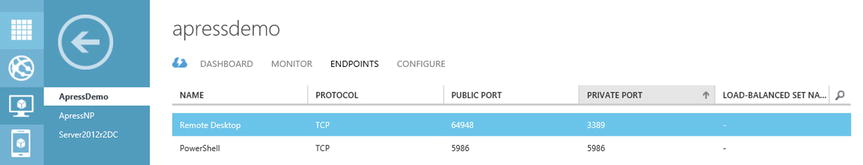
Figure 13-19. Azure VM endpoint monitoring
As you can see in Figure 13-20, the new Azure Portal provides much more information in a single pane. It shows the VM name, IP info, CPU performance trend, and endpoints that are published, as well as a slew of other attributes about the VM.
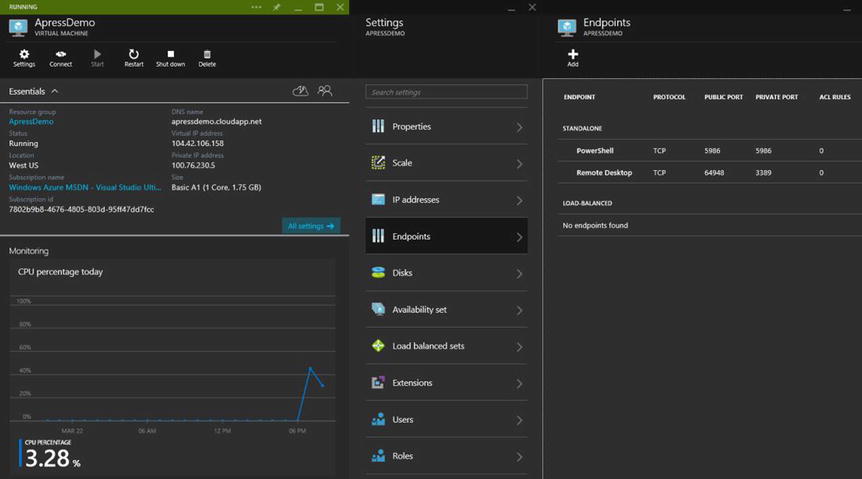
Figure 13-20. Azure new Portal VM endpoint monitoring
Minimal monitoring of VMs is available in Azure natively. For more detailed monitoring of VMs in Azure, Microsoft recommends using Microsoft System Center 2012 R2. System Center provides unified management across on-premises, service provider, and Azure environments. It provides VM portability between on-premises and Azure, as well as deep insight into the fabric, operating system performance, health, security, and service availability. System Center also gives you an outside-in view of the health and availability of the IT services you are providing, allowing you to configure your datacenter monitoring just as this chapter illustrated for endpoint monitoring of Azure web sites.
For more information on Microsoft System Center, visit www.microsoft.com/systemcenter.
Monitoring Storage
Azure supports monitoring blob, table, and queue storage. Storage monitoring includes aggregated transaction statistics and capacity data for a storage service. This data is aggregated at hourly or minute intervals for each storage service. Transaction data is recorded at the service level and the API operation level. At the service level, statistics summarizing all requested API operations are written to a table entity every hour, even if no requests were made to the service. At the API operation level, statistics are written to an entity only if the operation was requested within that hour.
When enabling storage monitoring, your options are as follows:
- Off: No storage monitoring occurs.
- Minimal: Collects data such as the amount of ingress and egress traffic, storage availability, storage performance, and success percentages. This data is then aggregated for the Blob, Table, and Queue services.
- Verbose: Includes all the data that is collected with the Minimal setting, along with the same metrics for each storage operation. This setting enables a closer analysis of issues that occur during application operations.
For each storage service that you monitor, you are asked to specify a retention period with a range of 0–365 days. It is recommended, as a best practice, that you specify a retention period slightly longer than you typically need to go back and look at performance data. Some organizations may only need a few weeks, whereas others may need 6–12 months.
![]() Note If you choose a retention period of 0, the system never deletes the analytics data, and thus it is your responsibility to do so.
Note If you choose a retention period of 0, the system never deletes the analytics data, and thus it is your responsibility to do so.
To monitor Azure storage, it must be configured at the storage-instance level under the Configure tab of the Azure Management Portal. After you enable storage monitoring, it takes about an hour for the data to appear in the Portal. Figure 13-21 shows Blobs storage monitoring data being retained for 90 days.
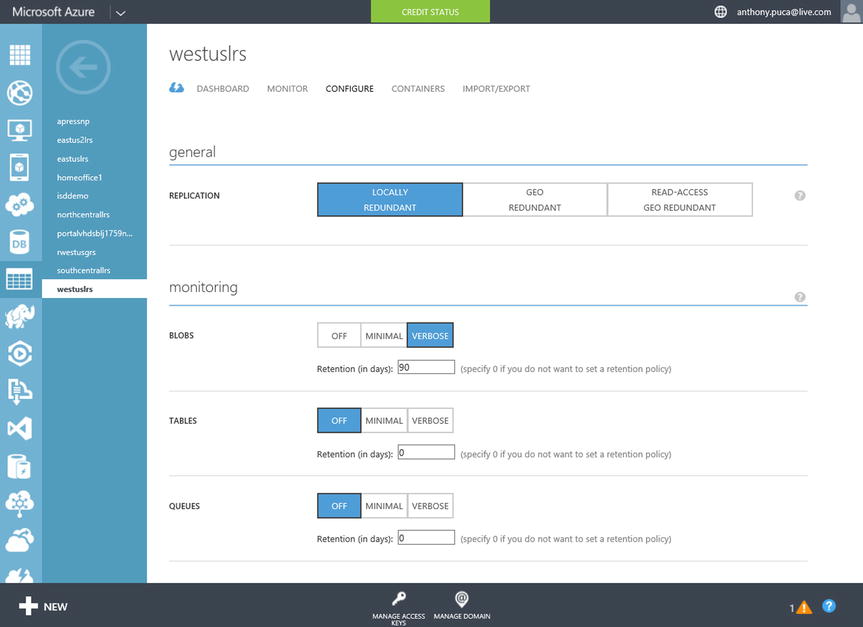
Figure 13-21. Configuring Azure storage monitoring
![]() Note At the time of this writing, capacity metrics are only available for the Blob service. Capacity metrics for the Table service and Queue service will be available in future versions of storage analytics.
Note At the time of this writing, capacity metrics are only available for the Blob service. Capacity metrics for the Table service and Queue service will be available in future versions of storage analytics.
Management Services
The Management Services section of the Azure Portal, shown in Figure 13-22, is essentially where all the monitoring rules you create are stored. From this workspace, you can see all the rules and the services to which they are linked, and you can jump right from the rule to the service using the hyperlink in the Service Name column. The Management Services workspace is also where you can view the operation logs for the Azure systems for which you have logging enabled.
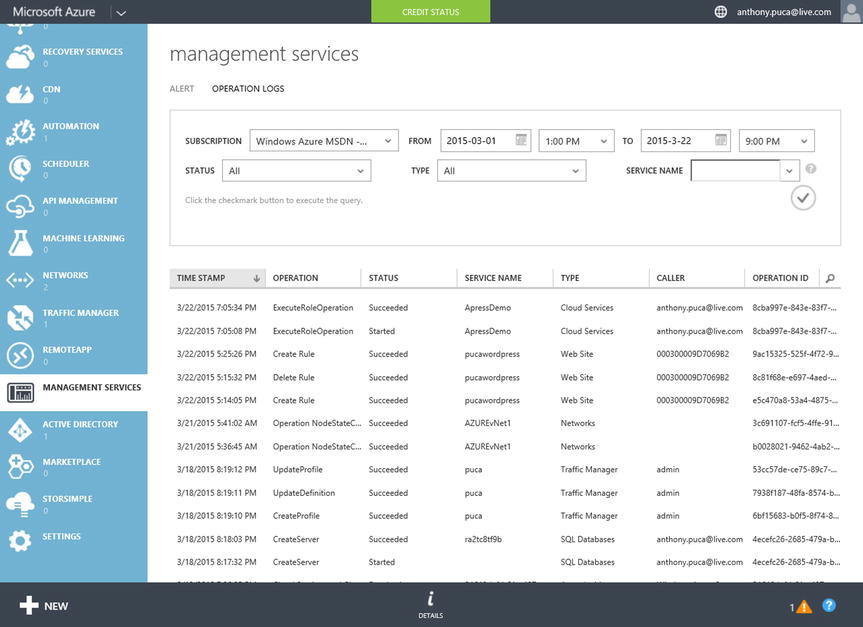
Figure 13-22. Azure Management Services log view
Summary
Azure includes the basic monitoring that most organizations need. Whether you want to see basic availability and performance data or you wish to perform more detailed synthetic transactions from outside the datacenter in which your systems reside, Azure monitoring exposes a rich list of attributes for monitoring and trending your systems. You should now have a good understanding of Azure monitoring, metrics, and endpoints; you can use these together to provide a monitoring framework or integrate them into your on-premises solution.
The next chapter introduces you to the Azure Machine Learning service. You learn what it is and how you can use it to recognize patterns based on historical data, which can help you predict trends.