Today organizations use computers for all sorts of processes. Chances are if you work in one of these modern organizations your day starts by logging into a computer. Once you are logged in, you use various Software Systems all throughout the day to perform the various information worker roles particular to your job.
As the software developer, what tool do you use most? Visual Studio! If you look at the various other tools to use besides Visual Studio, chances are you use a system to input timesheet information. You probably use Exchange Server. In your projects, you use some sort of bug tracking software. Something to manage feature requests. However, now imagine if youare an investment consultant, finance specialist, or an insurance broker, your reliance on all this data would be even more important.
Using these various systems, organizations collect a lot of valuable data. Smart organizations look back into this data and use the collected data to run reports. These reports help improve existing business processes. That is really what business intelligence is all about.
Business intelligence is a set of concepts, methods, and processes to improve business decisions using information from multiple sources and applying experience and assumptions to develop an accurate understanding of business dynamics. It is the gathering, management, and analysis of data to produce information that is distributed to people throughout the organization to improve strategic and tactical decisions.
Business intelligence involves the integration of core information with relevant contextual information to detect significant events and illuminate cloudy issues. It includes the ability to monitor business trends, to evolve and adapt quickly as situations change, and to make intelligent business decisions on uncertain judgments and contradictory information. It relies on exploration and analysis of unrelated information to provide relevant insights, identify trends, discover opportunities, take proactive decisions, and create value.
In short, business intelligence means leveraging the organizations' internal and external information assets for making better business decisions.
Microsoft has many products to support the BI initiative. Some of these products are the following:
Microsoft dynamics
Excel
Project
SharePoint
SQL server
Visio
Particularly, SharePoint is central to Microsoft's BI offering. Since this is a SharePoint book, we will look at Microsoft's BI offerings from a SharePoint point of view. In SharePoint, there are three major offerings from Microsoft in the BI spectrum.
Some people also consider BCS as a BI offering. Since I have already described BCS in Chapter 9, I won't be describing BCS in this chapter. It is important to understand that frequently SQL server is central to all of these. However, SQL server doesn't necessarily have to be the engine powering BI reports through SharePoint. Reports that are surfaced through SharePoint can have any backend data source; it can be any database or it doesn't even have to be a database.
In this chapter, I will evaluate each of these one by one.
Visio is a tool that ships with Microsoft office and allows users to create diagrams. We have been creating diagrams since we were kids and since we were prehistoric apes. Diagrams are an excellent way to communicate a complex concept. Even though high-level languages have evolved, sometimes a picture does speak a thousand words.
Visio helps you create beautiful looking diagrams, but until the last version of SharePoint these diagrams were mostly static pictures. That is about to change starting this version. In SharePoint 2010, there is a component of SharePoint called as Visio Services. Visio Services allows you to view any of your diagrams created in Visio, right through the browser. Also, it allows you to give that diagram life. In other words, the diagram can show live data by formatting itself in different ways or presenting indicator icons depending upon the state of the data. The data can come from various sources. Let's look at an example.
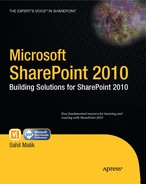
I am a really busy guy, so I like to maintain all my tasks in a tasks list in SharePoint. Figure 11-1 shows my tasks list in SharePoint after I populated some tasks in it.
Let's say I intend to communicate to everyone in a graphical way the percent complete on all these tasks. What I intend to do is present these tasks using a web browser interface served in SharePoint. To do this, create a blank Visio diagram in Visio 2010, and start by inserting a new container under the insert button from the ribbon. Inside this container drag and drop three "To do" shapes which you will find under the ScheduleCalendar stencil. If you can't find the "To do" shape, just drag and drop any other shape. You're just learning here, so you don't need to be all artsy about it. At this point, your Visio diagram should look like Figure 11-2.

Next, click the data tab then click the link data to shapes button in the ribbon. In the ensuing wizard that pops open, choose to import data from the tasks list using "Microsoft SharePoint foundation list" as your choice data source.
At the bottom of your Visio window, you should see the various rows that have been pulled from the linked data source. This can be seen in Figure 11-3.

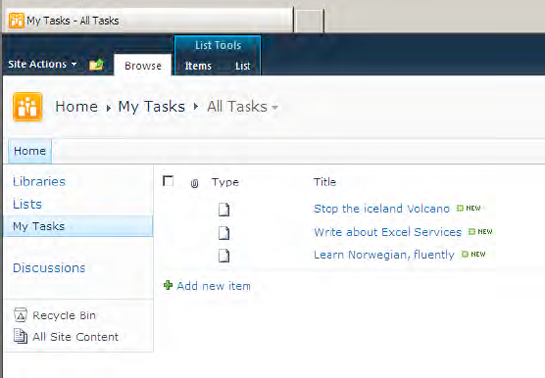
As the tooltip prompts you, drag and drop each one of the three rows onto the three "to do" icons you had placed earlier. Dragging and dropping each one of these three rows one by one will link the row to the target shape that you drag drop the row to. It will also create a default data graphic for you, as shown in Figure 11-4.
The default data graphic shows the title and start date. The default data graphic is fine, but I'd like it to be little bit more interesting. For example, let's show some decent formatting. Therefore, maybe the text should be a little bit wider and also show the percent complete as a progress bar.
In order to do so, click the data graphics button in the ribbon and choose to create a new graphic. In the new data graphic window that pops open, click the new item button. Choose to specify the new item being driven from the data field percent complete, displayed as a data bar, in the style of progress bar. This can be seen Figure 11-5.

Repeat the previous step for the title and start date columns as well. The title and the start date columns are to be shown as text. You will also have to play a bit with the width. The final changes are shown in Figure 11-6.

Finally, click OK and apply this newly created data graphic to the three shapes that you had earlier on the screen. After some formatting, aligning, and final touches on color, your Visio diagram should look like Figure 11-7.

Go ahead and save this on your disk. Next, you need to make some changes to your SharePoint site collection. Activate the SharePoint enterprise features under site collection because Visio Services is a part of those enterprise features. Also, create a document library called "Visio diagrams".
Next, in the backstage view of Visio 2010, click on Save and SendSave to SharePointSave as Web Drawing (Data-refreshable drawing for use with Visio Services on SharePoint). Choose to save it at http://sp2010/Visio Diagrams. Save the file as "Sahils Tasks.vdw". Saving the file will immediately open this Visio diagram in the web browser. If it doesn't, you need to activate the SharePoint enterprise features on your site collection, and you should have created a document library called "Visio Diagrams".
On the default.aspx page of your site collection, choose to drop a "Visio Web Access" WebPart. Configure this WebPart to point to the http://sp2010/Visio Diagrams/Sahils tasks.vdw file. Also, you may need to configure the height width, etc., of this WebPart. Once the WebPart is configured, you should see it running in the web browser.
This looks very good! So let's say that I've started on task one, and let's say that I'm only 25% complete with that task. Therefore, I go to the tasks list and update the percent complete of this task to 25%. Now I come back to Visio Services diagram running in the browser. Note that the percent complete is beautifully reflected on the diagram, as shown in Figure 11-8.

As you can see, I've barely started stopping the Icelandic volcano that is disrupting European air travel at the moment. But, hopefully, that problem will figure itself out. Let me start talking about Excel Services.
Excel services is yet another important pillar in Microsoft's business intelligence offering. Business users really like Excel. This is because Excel for them is easy to use and they are able to add complex formulas to Excel to express their logic. They can do so without involving the IT guy. The problem with this scenario, however, is that it becomes very difficult to share this Excel sheet with their coworkers. Usually they would e-mail the sheet around, but sometimes these sheets are too large to be emailed, sometimes they have backend data connections, and sometimes emailing causes version confusion hell.
Excel services solves all of those problems. In short, Excel services allows you to publish an Excel sheet in a document library, the Excel sheet is then calculated on the server, and is then presented to one or more clients. In the calculation, Excel sheets can involve external datasources or even custom UDF's (user defined functions) written in .NET. Once this Excel sheet has been published, it can be consumed directly through the browser by using the Excel web application component, Excel web access webpart, or Excelservice.asmx web service. The Excel sheet functionality is also available over REST based APIs and thus can be exposed as atom feeds or JSON.
Let's look at a practical example. Start by setting up the Northwind database in a SQL server. You will find the script to set up the Northwind database in the associated code download of this chapter. Next, you're going to craft up an Excel sheet that displays orders information from this database as a pivot table and pivot chart.
Then, start Excel 2010, and click on the data tab in the ribbon. In the data tab, click "From other sources ", and choose to import data from SQL server. You would note that you have the ability to import data from various other sources as well. When prompted to import data from SQL server, choose to import the data from the "Orders" table in the Northwind database using windows authentication. You have the ability to use either windows authentication, SQL server authentication, or to provide a secure store service ID and get credentials at runtime. Once you have finished importing the data from SQL server, choose to save the .odc file in a SharePoint "Data Connections Library " that you will need to create beforehand.
At this point, Excel will prompt you to import the data as either a table, a pivot table, or a pivot table and pivot chart. Choose to import the data as a pivot table and pivot chart.
Now in the pivot table make the following changes:
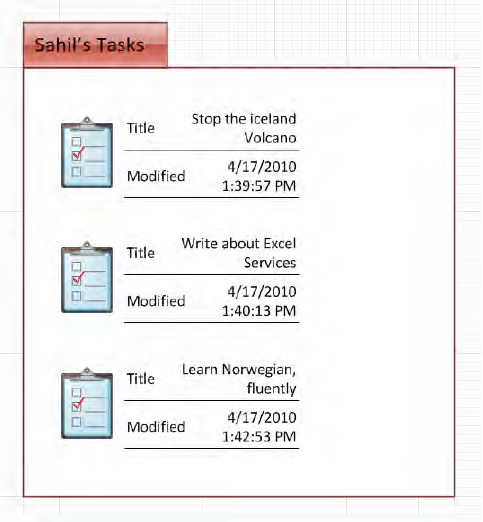
Choose to make it filtered by selected country. Your pivot table should look like Figure 11-9.

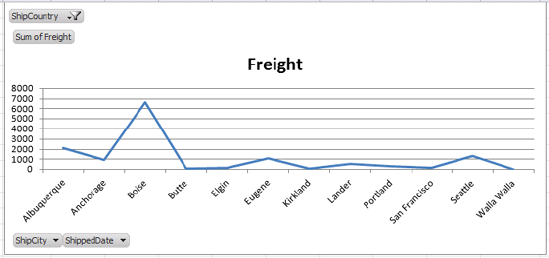
Note that the pivot chart has been updating itself and is showing you a graphical view of the data you see in the pivot table. Thus, the pivot chart and pivot table are connected with each other. Format the chart a bit, like choosing to show a line graph instead of a bar chart, and your pivot chart looks like Figure 11-10.
Next, add a column next to the pivot table and give it a heading of "Difference from Avg.". Give it a formula of "=B4-AVERAGE(B4:B15)" and choose to repeat this formula on all available cells. Also, apply conditional formatting to this cell, so it graphically shows you all cities have freight less than average and which cities have freight greater than average. The pivot table now looks like Figure 11-11.

Finally, select the A1 cell in the pivot table to make the options tab in the ribbon visible. With the options visible, click on insert slicer, and then choose to make shipregion available in the slicer. This will allow you to slice the data at runtime and subsequently affect the pivot table and pivot chart.
The final Excel sheet looks like Figure 11-12.

From the backstage view of Excel 2010, click save and sendSave to SharePointBrowse for a location. For now, publish this sheet to a document library called sheets. You will have to pre-create this document library in your site collection. Also, you will need to pre-activate the enterprise features in your site collection. If you have used Excel services with SharePoint 2007, you would remember that you would also have to go into central administration and add a trusted file location. This is no longer necessary in SharePoint 2010. By default, all SharePoint sites are available as trusted file locations. You can verify this by going to central administration, clicking on manage service applications, and choosing to manage the Excel services service. In there, click on trusted file locations and you should see an entry similar to Figure 11-13.
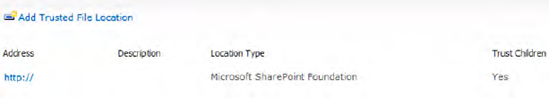
This entry makes the entire SharePoint farm available as a trusted file location.
With the Excel sheet published, drop the Excel web access WebPart on the homepage of your SharePoint site collection and configure it to show your newly published Excel sheet. You should see your Excel sheet running with full interactivity in both the pivot table, pivot chart, the slicer, and showing live data from the Northwind database. This can be seen in Figure 11-14.

This is a very compelling example, because the end business user can craft up such sheets talking to real data and publish them for the world to see. However, it gets even more interesting than this. For the current web session, these sheets can be edited in the browser and can recalculate themselves and present new data. In Excel services, you also have the ability of parameterizing certain sheets. Finally, the logic of the sheets is exposed over a web service and REST API.
Here is the best news. The Excel sheet that you have so far been working with is already being exposed over the rest based API. Don't believe me? Assuming that your filename was "Northwind Orders.xlsx ", Visit the following URL:
http://sp2010/_vti_bin/ExcelRest.aspx/Sheets/Northwind%20Orders.xlsx/model[4].
As you will note, the URL provides you with all the details embedded in your Excel sheet over an atom feed. Now visit the following URL:
http://sp2010/_vti_bin/ExcelRest.aspx/Sheets/Northwind%20Orders.xlsx/model/Charts('Chart%201')?$format=image.
You would note that your Excel sheet chart is being exposed as a simple image. This is really useful. I'm going to show a practical demonstration of this. Imagine that your task is to craft up a document that shows the graph of the freight cost for USA. Usually, you would copy then paste such a chart from an existing web site and embed it in the document. That is not a perfect approach because sooner or later the chart will become out of date. However, you can use Excel services to create a chart that updates with live data every time the document is opened. To do so, start Word 2010 and under the insert tab click quick parts. Choose to include a new field and in the ensuing dialog box choose to "IncludePicture ", which provides the appropriate URL as shown in Figure 11-15.
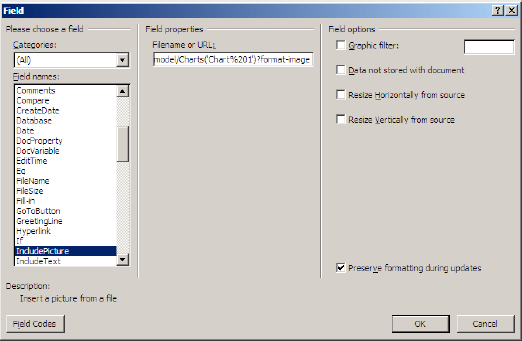
This will immediately insert a chart from the web-based URL, and every time the Word document is opened this chart will automatically be refreshed. This can be seen in the Figure 11-16.

It goes without saying that you can embed this chart in any web-based content, such as a content editor WebPart, blog post, or even a non SharePoint application. What is really compelling is that this functionality of Excel service being exposed as atom-based feeds is also available on sky drive in the cloud as well. Therefore, you can technically host Excel sheets in your sky drive, and have those generate graphs that can be embedded in your blog posts or anywhere else.
Not only can you embed charts, but you can embed truly any content being exposed from an Excel sheet into any other consumer. For example, now try visiting the URL:
http://sp2010/_vti_bin/ExcelRest.aspx/Sheets/Northwind%20Orders.xlsx/model/PivotTables('PivotT
able1')?$format=html.
Note the end of the query string parameter in the previous URL. By default, the content is exposed as atom feeds, but you can choose to request JSON or even HTML.
The previous URLs renders an HTML table, as shown in Figure 11-17.

Now this HTML table can be embedded into any container that can render HTML. This can be your browser, Word or Excel, or something else. For example, to insert this content into Word again choose to insert a quick part, but this time choose to insert using "IncludeText".
Just as you're able to access Excel sheets over REST based APIs, they are also exposed over SOAP based APIs. The previous sheet that I was working with involved a pivot table and pivot chart. Pivot tables and pivot charts are extremely powerful, but since their data is being driven by an external data source, they do not lend themselves to be changed easily from the front end.
For this section, let's craft up a slightly different and perhaps simpler Excel sheet. Let's say the sheet that I want to create reflects my daily activities for the day. This sheet can be seen in Figure 11-18.

If you note closely, C7 is filled with a formula, whereas the other rows in the C column are static values. Also, there is a pie chart being driven from the same data. Anytime I change the number of hours spent in any activity, the pie chart automatically redraws itself to show the updated data.
Publish this to Excel services and choose to also display this in the Excel web access WebPart. When choosing to display the sheet in the Excel web access WebPart, look for a check box called "All Workbook interactivity" under "General Interactivity Settings" when the webpart is in edit mode. Check that checkbox. The Excel sheet running in the browser looks like Figure 11-19.
Let's say that people are complaining that I was spending too much time drinking others. So, I need to reduce the time spent in biting and perhaps increase the time spent in eating. Go ahead and edit the Excel sheet, and change cell C6's value to eight. At the same time, click on cell C3 and change its value to four. You would note that the chart immediately reflects your changed values and also the formula at C7 immediately reflects your changed values in the browser. I wish my parents that easily reflected my changed values.

There is one important thing to note here though. All the changes that you're doing from the Excel web access WebPart are being changed only for your current web session. In other words, if you were to close your browser and come back to the Excel web access WebPart, all the changes you had done previously would be lost. To make the changes permanent, you need to edit the source Excel sheet using thick client Excel or using Excel web applications.
Interestingly, all these embedded formulas and intelligence are a sheet that is exposed over a soap based API. Let's see this in action. Start Visual Studio 2010 and create a console application. In this console application, you will add a reference to /_vti_bin/excelservice.asmx, so this can be any version of .NET that can consume a web service. Since WCF can consume web services using basicHttpBinding, you're going to go with the .net 3.5 application. Call your console application ExcelSvcClient. In this console application, choose to add a service reference to http://sp2010/_vti_bin/ExcelService.asmx in the namespace ExcelService. After you have added the service reference, quickly examine the app.config for your client application. You should see a section that specifies the security settings for the client WCF application and you should change it to the following code:
<security mode="TransportCredentialOnly">
  <transport clientCredentialType="Ntlm" proxyCredentialType="Ntlm" realm="" />
  <message clientCredentialType="UserName" algorithmSuite="Default" />
</security>
This section now ensures that the client sends the NTLM identity to the server with all its requests. This is necessary since your SharePoint installation is protected behind active directory authentication.
Now modify the source code for your console application, as shown in Listing 11-1.
Example 11.1. Source Code for Your ExcelService As WCF client
private static string workbookURL = "http://sp2010/sheets/Book1.xlsx";
static void Main(string[] args)
{
  ExcelService.ExcelServiceSoapClient client =
    new ExcelService.ExcelServiceSoapClient();
  client.ClientCredentials.Windows.AllowedImpersonationLevel =
    TokenImpersonationLevel.Impersonation;
  ExcelService.Status[] outStatus;
  string sessionID =
    client.OpenWorkbook(workbookURL, "en-US", "en-US", out outStatus);
  ExcelService.RangeCoordinates rc = new ExcelService.RangeCoordinates()
  {
    Column = 3,
    Row = 6,
    Height = 1,
    Width = 1
  };
  client.SetCell(sessionID, "Sheet1", 4, 2, 10);
  outStatus = client.Calculate(sessionID, "Sheet1", rc);
  Console.WriteLine(
    client.GetCell(
     sessionID, "Sheet1", 6,2, false, out outStatus).ToString());
}
At this time, if you compile and run your console application, you would note that the total which is calculated out of a formula is written out to your console. Again, it is important to note that you interact with Excel services using the sessionID and these changes are specific only to your sessionID. The actual sheet itself is unchanged. You should further explore the various other methods available to you in ExcelService.asmx. Some of the interesting methods allow you to export binary data out of the sheet, or to export a snapshot of an edited sheet as a byte array.
There used to be a product called Microsoft Office business scorecard manager. It had some compelling monitoring and analytic capabilities. As a successor to that product, Microsoft released a product called Microsoft Office PerformancePoint server in November 2007.
PerformancePoint server 2007 included Monitoring and Analytics features, which include Dashboards, Scorecards, Key Performance Indicators (KPIs), Reports, Filters, and Strategy Maps are delivered via a Monitoring Server. They were primarily two client user interfaces to the monitoring server, namely the dashboard designer and various SharePoint webparts. The dashboard designer was a thick client application downloaded from the monitoring server, which allowed power users to do the following:
All of this information was stored to a SQL server 2005 database that was managed directly through the monitoring server. Note that I'm still talking about the PerformancePoint server available with SharePoint 2007.
Once a dashboard had been published to the monitoring system database, it could then be deployed to Microsoft Office SharePoint Server 2007 or Windows SharePoint Services. Therefore, in that sense PerformancePoint server was a product that worked in parallel with SharePoint. Yet another portion of the PerformancePoint server was the planning center operation. PerformancePoint planning server supported a variety of management processes which included the ability to define, modify, and maintain logical business models integrated with business rules workflows and enterprise data.
Finally, there was the management report which was a component designed for financial reporting.
That is all history! The product Microsoft Office PerformancePoint server was discontinued in April 2009. Before you feel sad or shed any tears for the loss, the product was instead reincarnated as PerformancePoint Services for SharePoint 2010. It is available as a part of non-free versions of SharePoint 2010. Plus it is envisioned to be quite disruptive to the marketplace that it is entering, because it is indeed a highly reengineered and well thought out product.
What is PerformancePoint Services for SharePoint 2010? PerformancePoint Services for SharePoint 2010 is that part of SharePoint that allows you to create rich context-driven dashboards that aggregate data and content to provide a complete view of how your business is performing at all levels. In other words, it is the easiest way to create and publish business intelligence dashboards in SharePoint 2010. At the heart of PerformancePoint services is the dashboard designer. The dashboard designer is a thick client that you can launch directly from the browser, and it allows you to create KPIs, scorecards, analytic charts and grids, reports, filters and dashboards.
Compared to PerformancePoint server 2007, they are many enhancements in PerformancePoint services 2010. Some of these enhancements include the following:
Enterprise level scalability: Built upon the new services infrastructure in SharePoint 2010, PerformancePoint Services has the ability to scale a lot more than PerformancePoint server 2007.
SharePoint repository: There is no longer a separate monitoring server database. All objects created are now stored in the content database. This has numerous advantages, centered around security, administration, backup and restore, and even the end user experience.
All PerformancePoint features are now SharePoint features: There is a business intelligence repository available as a site definition or you have the ability to create new sites based upon other site definitions and enable certain features to make use of PerformancePoint features in any site collection.
PerformancePoint filters can now be connected with standard SharePoint webparts, because they build upon the standard WSS WebPart connection framework.
Integration with SharePoint also makes it possible for PerformancePoint to work with every other SharePoint feature such a search, indexing, workflows Excel Services, Visio Services and so on so forth.
There are some significant improvements in the various SharePoint WebParts, chart types, and the dashboard designer.
With this theory, let's start with the process of administrating configuring and using PerformancePoint services in SharePoint 2010. Configuring PerformancePoint services is split into two halves: one that you would need to do in central administration and one that you would need to do in the site collections you intend to use PerformancePoint services.
If you used the farm wizard to configure your SharePoint installation, chances are PerformancePoint services ready to go for you. Let's look at the specific configuration necessary to use PerformancePoint services on any particular farm. Visit central administration for your farm. Under central administration click on manage service applications. PerformancePoint services is yet another shared services application within SharePoint. Look for PerformancePoint service application within central administration, if one isn't here choose to create one in central administration using the page at /_admin/ServiceApplications.aspx. If you click on properties for PerformancePoint service application, you should see a screen shown in Figure 11-20.

The check box that you see next to the name of the PerformancePoint service application is telling SharePoint that all new web applications by default would use this particular instance of PerformancePoint service application. Therefore, for any web site to use a different instance you would have to explicitly go into the web site settings and allow a certain web site to use a different application instance. This is an important consideration from a planning and scalability point of view.
There is yet another very important service available on SharePoint called as the secure store service. The secure store service is the evolution of what used to be single sign-on in SharePoint 2007. Single sign on in SharePoint 2007, and the secure store service, provide a secure mechanism to store various credentials for various application IDs. Specifically, if the PerformancePoint Services application was not associated with a secure store service, you would not been be able to set an unattended service account for PerformancePoint services to connect to datasources with. As a result, the only mechanism you would be able to use to connect to data sources would be where the identity of the logged in user is used to connect to the backend data source. This means that Kerberos must be running properly on your network. For practical reasons though, you need to configure Kerberos on your network anyway, so this is not such a big deal.
One other thing I should mention here is that PerformancePoint services is claims aware. However, in today's world, a lot of backend datasources are not claims aware. As a result, even though the identity being passed within the PerformancePoint infrastructure is a claims based identity, the identity acquire to talk to backend datasources as of today usually is a Kerberos identity.
Next choose to manage the PerformancePoint Service application. You will then see a screen with four options as shown in Figure 11-21.

Starting from the bottom, the "Import PerformancePoint server 2007 content", as the name suggests allows you to import content from previous versions of PerformancePoint to PerformancePoint services for SharePoint 2010.
Trusted content locations and trusted datasource locations work in a manner very similar to Excel services. By default all SharePoint locations are trusted. This is a setting similar to Excel Services.
The setting at the top "PerformancePoint service applications settings " is where all of the other settings go. At the very top of this page is a section for secure store and the unattended service account. In Central Administration, under Manage service applications, if you use the farm configuration wizard to set up your farm, you should see an instance of the secure store service already created for you. If it isn't created for you go ahead and create one.
Back in the PerformancePoint services application settings page, provide the name of the secure store service application name and provide an unattended service account. The unattended service account is what will be used to authenticate with backend data sources. Thus, you want to ensure that this account is not a highly privileged account and is different from your farm account or any application pool accounts. Not doing so may inadvertently give access to data sources that you didn't plan on giving access to. Also, before you're able to specify the unattended service account, you will first have to visit your secure store service application settings page and ensure that you generate a new key first. This generated key requires you to specify a password using which the database will be encrypted. Try not to lose this password.
The one final setting that you do not have to perform, but you should know about is that under manage web applications, select your port 80 web application and choose "Service Connections " from the ribbon. This should pop open a dialog box that lets you associate various service application instances with existing web applications. This can be seen in Figure 11-22.

Let me start with a bit of good news first! If you have installed SharePoint enterprise, you do not need to do anymore farm level or web application level configurations. The various webparts, web services, and the dashboard designer are already there for you. All you need to do now is to activate the appropriate features on the sites and site collections to start making use of PerformancePoint services.
Now I'm in the laziest guy you'll ever meet. I like to take the simplest possible way to get my work done. Right out of the box there is a site definition called the business intelligence center provided for you, which makes use of all the necessary features. But just like as I had described in the enterprise content management chapter earlier, all those features that make up that site definition can also be individually activated in other site collections so you can use PerformancePoint services anywhere you wish. This truly gives you immense flexibility, and even though I'm the laziest guy you'll ever meet, I will demonstrate the use and configuration of PerformancePoint services in a blank site collection. Start by creating a blank site collection at the root level in your port 80 web application.
Configuring your site collection is a matter of activating a few features. You need to activate the following site collection features in the following order:
Note that SharePoint server publishing infrastructure is a prerequisite for PerformancePoint services site collection features. This is because the dashboard publishing uses the SharePoint server publishing infrastructure.
Once the above features are activated, also activate the "PerformancePoint services site features" at the site level.
Earlier in this chapter, I had mentioned that PerformancePoint server 2007 used a separate database to store all of its necessary information. That has changed, because all the necessary information is now stored inside of lists and document libraries; lists that contain dashboards definitions, reports, scorecards, filters, KPIs, and indicators as well as document libraries that contain exported dashboards and datasources.
Now that you have properly configured PerformancePoint both in central administration and in the site collection you now have available all the list definitions and the necessary content types to get started.
Create a new list based on the "PerformancePoint Content List" list definition and call it "PerformancePoint Content".
Create a new document library called "Dashboards " based on "Dashboards Library" list definition.
Create another document library called "Data Connections " based on the "Data Connections for PerformancePoint" list definition.
In the PerformancePoint content list, you would see all the necessary content types as shown in Figure 11-23.
One thing is clear, the driving force behind PerformancePoint services are nothing but content types. Therefore, anything that applies to content types, reusability, queryability, structure, information management policies, all of that can be used with PerformancePoint content.
Click on any one of them and that should launch a click once application which is your dashboard designer. Once the dashboard designer is launched, you can then work entirely in the dashboard designer to create various artifacts. Start by saving your dashboard as MyDashBoard.ddwx on your local disk before you add any new items in the workspace. At this point, your workspace in the dashboard designer should look Figure 11-24.


Before you can start creating any artifacts in PerformancePoint, let's first set up the database that you will use. PerformancePoint services is very versatile and can work with various backend sources such as Excel services, analysis services, a regular SQL table, or even reporting services. For this chapter, I will demonstrate the usage of PerformancePoint services using analysis services.
To begin, set up the adventure works sample databases downloaded from http://msftdbprodsamples.codeplex.com/releases/view/24854.
Once you have downloaded and installed the adventure works sample databases, open the C:Program FilesMicrosoft SQL Server100ToolsSamplesAdventureWorks 2008R2 Analysis Services ProjectenterpriseAdventure Works.sln project in the BI Studio of SQL Server 2008.
After opening the solution, in the Solution Explorer double-click the "Adventure Works.ds" data source. Click the Edit...button just below the Connection String box. Supply your SQL Server (database engine) server and instance name (if it's a named instance). Click the Test Connection Button. If the test succeeds, click OK to save the changes.
Right click the solution in Solution Explorer, choose Properties. On the Adventure Works DW 2008 SE Property Pages dialogue, choose the tree item for Deployment. Change the Target ~TRA Server property to your Analysis Services server name and instance name (if it is not a default instance).
In the solution explorer, right-click the solution (Solution 'Adventure Works') and click Deploy.
Once the project is deployed, right-click the data connections document library in your dashboard designer and choose to create a new data source. Create a new Analysis services based project, using the "Adventure Works DW 2008R2" database and use the "Adventure Works" cube. This can be seen in Figure 11-25.

Choose to save this data connection as "AdventureWorks".
Next, right-click the PerformancePoint content list and choose to add a new report. When prompted, choose to add a new analytic chart. Choose the new AdventureWorks Data connection you have just created as the data source for this analytic chart. In the new report, drag and drop product categories in the Series and in the bottom axes drag drop geography. This can be seen in Figure 11-26.
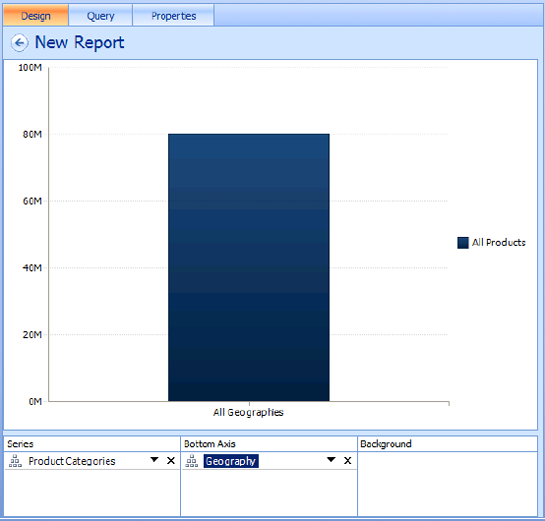
Save this report as "AdventureWorks Products". Once this report is saved in your list, note that it is saved as a certain content type. I'd like to point out here that if you were to add that content type in any other list, you would be able to save your reports in any list in SharePoint you wished. This really gives you the maximum flexibility you need.
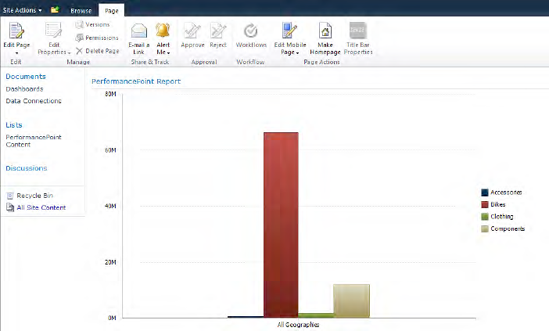
Back on your SharePoint site on the default page, put the page in edit mode and drop the PerformancePoint report WebPart. Then, point this WebPart to this newly created report that you'vejust uploaded in your SharePoint site. You would note that the report is running in full interactivity on the SharePoint site. You should see a big blue bar called all geographies. Go ahead and click on the big blue bar, and the report should update giving you the various products available. This can be seen in Figure 11-27.
So far, so good. Why is it that my bike sales are so high? I'm not asking this, but I know my business users will. When you see the bright red bar, right-click it and choose decomposition. This would bring up a decomposition tree for the underlying data source, and it would immediately tell you that you are selling a lot of road bikes (see Figure 11-28).

Why are you selling so many Road bikes? As an analyst now, you can click on it and easily choose the dimension you wish to expand upon (see Figure 11-29).

Let's expand on Geography, which reveals that you are selling a lot of bikes in California. Expanding further by city reveals that you are selling a lot of bikes in Carson City, and especially in the months of May, November, August, and February. This is a pattern that repeats every year! This can be seen in Figure 11-30.

This clearly tells you that the Carson City market is pivotal to your company's success! And, you were able to know this without bothering a developer. How nice!
Business intelligence is a very important part of any organization. It is certainly a very important part of SharePoint. There are numerous features in SharePoint 2010 that fall in the BI spectrum. In this chapter, I talked about Visio Services, which allows you to take a Visio diagram connected to data and show it on a browser. I then talked about Excel services, which allows you to render a rich Excel sheet with some interactivity directly through the browser. Finally, I talked about the kingpin of the business intelligence offering from Microsoft which is PerformancePoint services.
In the next and last chapter off this book, I will talk about security, which is central to everything we have talked about in this book so far.
[4] Note that the URL contains the name of the Excel sheet. If you named your sheet something else, your URL would be different.