
Chapter 18 Proactively Monitoring SQL Server 2008 with System Center Operations Manager 2007
System Center Operations Manager (OpsMgr) 2007, also known as SCOM, provides the best-of-breed approach to proactively monitoring and managing a SQL Server 2008 infrastructure. Through the use of monitoring and alerting components, OpsMgr helps to identify specific environmental conditions before they evolve into problems.
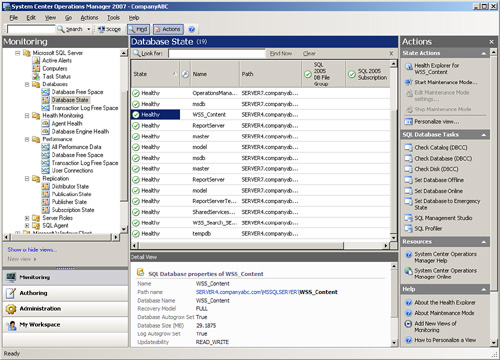
OpsMgr provides a timely view of important conditions in SQL Server 2008, as displayed in Figure 18.1, and intelligently links problems to knowledge provided in the monitoring rules. Critical events and known issues are identified and matched to technical reference articles in the Microsoft Knowledge Base for troubleshooting and quick problem resolution.
The monitoring is accomplished using standard operating system components such as Windows Management Instrumentation (WMI), Windows event logs, and Windows performance counters, along with OpsMgr-specific components designed to perform synthetic transactions and track the health and availability of network services such as SQL Server 2008. In addition, OpsMgr provides a reporting feature that allows administrators to track problems and trends occurring on the network. Reports can be generated automatically, providing database administrators, network administrators, managers, and decision makers with a current and long-term historical view of environmental trends in SQL Server.
Note
System Center Operations Manager was originally developed by NetIQ and then purchased and released as Microsoft Operations Manager (MOM) 2000. OpsMgr was subsequently updated and released as MOM 2005. Recently, the product has been completely redesigned and was released as System Center Operations Manager 2007. OpsMgr 2007 contains powerful management capabilities and presents a fundamental change in the way systems are monitored. In addition to individual server monitoring, groups of systems can now be monitored together as a service with multiple interdependent and distributed components.
OpsMgr is a sophisticated monitoring system that effectively allows for large-scale management of mission-critical servers. Organizations with a medium to large investment in Microsoft technologies will find that OpsMgr has an unprecedented ability to keep on top of the tens of thousands of event log messages that occur on a daily basis. In its simplest form, OpsMgr performs two functions: processing monitored data and issuing alerts and automatic responses based on that data.
The model-based architecture of OpsMgr presents a fundamental shift in the way a network is monitored. The entire environment can be monitored as groups of hierarchical services with interdependent components. Microsoft, in addition to third-party vendors and a large development community, can leverage the functionality of OpsMgr components through customizable monitoring rules.
OpsMgr provides for several major pieces of functionality as follows:
![]() Management packs— Application-specific monitoring rules are provided within individual files called management packs. For example, Microsoft provides management packs for Windows server systems, SQL Server, Exchange, SharePoint, DNS, and DHCP, along with many other Microsoft technologies. Management packs are loaded with the intelligence and information necessary to properly troubleshoot and identify problems. The rules are dynamically applied to agents based on a custom discovery process provided within the management pack. Only applicable rules are applied to each managed server.
Management packs— Application-specific monitoring rules are provided within individual files called management packs. For example, Microsoft provides management packs for Windows server systems, SQL Server, Exchange, SharePoint, DNS, and DHCP, along with many other Microsoft technologies. Management packs are loaded with the intelligence and information necessary to properly troubleshoot and identify problems. The rules are dynamically applied to agents based on a custom discovery process provided within the management pack. Only applicable rules are applied to each managed server.
![]() Event monitoring rules— Management pack rules can monitor for specific event log data. This is one of the key methods of responding to conditions within the environment.
Event monitoring rules— Management pack rules can monitor for specific event log data. This is one of the key methods of responding to conditions within the environment.
![]() Performance monitoring rules— Management pack rules can monitor for specific performance counters. This data is used for alerting based on thresholds or archived for trending and capacity planning.
Performance monitoring rules— Management pack rules can monitor for specific performance counters. This data is used for alerting based on thresholds or archived for trending and capacity planning.
![]() State-based monitors— Management packs contain monitors, which allow for advanced state-based monitoring and aggregated health rollup of services. Monitors also provide self-tuning performance threshold monitoring based on a two- or three-state configuration.
State-based monitors— Management packs contain monitors, which allow for advanced state-based monitoring and aggregated health rollup of services. Monitors also provide self-tuning performance threshold monitoring based on a two- or three-state configuration.
![]() Alerting— OpsMgr provides advanced alerting functionality by enabling email alerts, paging, short message service (SMS), instant messaging (IM), and functional alerting roles to be defined. Alerts are highly customizable, with the ability to define alert rules for all monitored components.
Alerting— OpsMgr provides advanced alerting functionality by enabling email alerts, paging, short message service (SMS), instant messaging (IM), and functional alerting roles to be defined. Alerts are highly customizable, with the ability to define alert rules for all monitored components.
![]() Reporting— Monitoring rules can be configured to send monitored data to both the operations database for alerting and the reporting database for archiving.
Reporting— Monitoring rules can be configured to send monitored data to both the operations database for alerting and the reporting database for archiving.
![]() End-to-end service monitoring— OpsMgr provides service-oriented monitoring based on System Definition Model (SDM) technologies. This includes advanced object discovery and hierarchical monitoring of systems.
End-to-end service monitoring— OpsMgr provides service-oriented monitoring based on System Definition Model (SDM) technologies. This includes advanced object discovery and hierarchical monitoring of systems.
OpsMgr proactively manages and monitors Windows networks including a SQL Server infrastructure through monitoring rules used for object discovery, Windows event log monitoring, performance data gathering, and application-specific synthetic transactions. Monitoring rules define how OpsMgr collects, handles, and responds to the information gathered. OpsMgr monitoring rules handle incoming event data and allow OpsMgr to react automatically, either to respond to a predetermined problem scenario, such as a failed hard drive, with predefined corrective and diagnostic actions (for example, trigger an alert, execute a command or script) to provide the operator with additional details based on what was happening at the time the condition occurred.
OpsMgr monitoring rules can generate alerts based on critical events, synthetic transactions, or performance thresholds and variances found through self-tuning performance trending. An alert can be generated by a single event or by a combination of events or performance thresholds. Alerts can also be configured to trigger responses such as email, pages, Simple Network Management Protocol (SNMP) traps, and scripts to notify you of potential problems. In brief, OpsMgr is completely customizable in this respect and can be modified to fit most alert requirements.
OpsMgr is primarily composed of five basic components: the operations database, reporting database, Root Management Server, management agents, and Operations Console. These components make up a basic deployment scenario. Several optional components are also described in the following bulleted list; these components provide functionality for advanced deployment scenarios.
OpsMgr was specifically designed to be scalable and can be configured to meet the needs of any size company. This flexibility stems from the fact that all OpsMgr components can either reside on one server or can be distributed across multiple servers.
Each of these various components provides specific OpsMgr functionality. OpsMgr design scenarios often involve the separation of parts of these components onto multiple servers. For example, the database components can be delegated to a dedicated server, and the management server can reside on a second server.
The following list describes the different OpsMgr components:
![]() Operations database— The operations database stores the monitoring rules and the active data collected from monitored systems. This database has a 7-day default retention period.
Operations database— The operations database stores the monitoring rules and the active data collected from monitored systems. This database has a 7-day default retention period.
![]() Reporting database— The reporting database stores archived data for reporting purposes. This database has a 400-day default retention period.
Reporting database— The reporting database stores archived data for reporting purposes. This database has a 400-day default retention period.
![]() Root Management Server— This is the first management server in the management group. This server runs the software development kit (SDK) and Configuration service and is responsible for handling console communication, calculating the health of the environment, and determining what rules should be applied to each agent.
Root Management Server— This is the first management server in the management group. This server runs the software development kit (SDK) and Configuration service and is responsible for handling console communication, calculating the health of the environment, and determining what rules should be applied to each agent.
![]() Management server— Optionally, an additional management server can be added for redundancy and scalability. Agents communicate with the management server to deliver operational data and pull down new monitoring rules.
Management server— Optionally, an additional management server can be added for redundancy and scalability. Agents communicate with the management server to deliver operational data and pull down new monitoring rules.
![]() Management agents— Agents are installed on each managed system to provide efficient monitoring of local components. Almost all communication is initiated from the agent with the exception of the actual agent installation and specific tasks run from the Operations Console. Agentless monitoring is also available with a reduction of functionality and environmental scalability.
Management agents— Agents are installed on each managed system to provide efficient monitoring of local components. Almost all communication is initiated from the agent with the exception of the actual agent installation and specific tasks run from the Operations Console. Agentless monitoring is also available with a reduction of functionality and environmental scalability.
![]() Operations Console— The Operations Console is used to monitor systems, run tasks, configure environmental settings, set author rules, subscribe to alerts, and generate and subscribe to reports.
Operations Console— The Operations Console is used to monitor systems, run tasks, configure environmental settings, set author rules, subscribe to alerts, and generate and subscribe to reports.
![]() Web console— The Web console is an optional component used to monitor systems, run tasks, and manage maintenance mode from a web browser.
Web console— The Web console is an optional component used to monitor systems, run tasks, and manage maintenance mode from a web browser.
![]() Audit Collection Services— This is an optional component used to collect security events from managed systems; this component is composed of a forwarder on the agent that sends all security events, a collector on the management server that receives events from managed systems, and a special database used to store the collected security data for auditing, reporting, and forensic analysis.
Audit Collection Services— This is an optional component used to collect security events from managed systems; this component is composed of a forwarder on the agent that sends all security events, a collector on the management server that receives events from managed systems, and a special database used to store the collected security data for auditing, reporting, and forensic analysis.
![]() Gateway server— This optional component provides mutual authentication through certificates for nontrusted systems in remote domains or workgroups.
Gateway server— This optional component provides mutual authentication through certificates for nontrusted systems in remote domains or workgroups.
![]() Command shell— This optional component is built on PowerShell and provides full command-line management of the OpsMgr environment.
Command shell— This optional component is built on PowerShell and provides full command-line management of the OpsMgr environment.
![]() Agentless Exception Monitoring— This component can be used to monitor Windows and application crash data throughout the environment and provides insight into the health of the productivity applications across workstations and servers.
Agentless Exception Monitoring— This component can be used to monitor Windows and application crash data throughout the environment and provides insight into the health of the productivity applications across workstations and servers.
![]() Connector Framework— This optional component provides a bidirectional web service for communicating, extending, and integrating the environment with third-party or custom systems.
Connector Framework— This optional component provides a bidirectional web service for communicating, extending, and integrating the environment with third-party or custom systems.
OpsMgr itself utilizes two Microsoft SQL Server databases for all collected data. Both databases are automatically maintained through OpsMgr-specific scheduled maintenance tasks.
The operations database stores all the monitoring rules and is imported by management packs and operational data collected from each monitored system. Data in this database is retained for 7 days by default. Data retention for the operations database is lower than the reporting database to improve efficiency of the environment. This database must be installed as a separate component from OpsMgr but can physically reside on the same server, if needed. The reporting database stores data for long-term trend analysis and is designed to grow much larger than the operations database. Data in the reporting database is stored in three states: raw data, hourly summary, and daily summary. The raw data is only stored for 14 days, whereas both daily and hourly data are stored for 400 days. This automatic summarization of data allows for reports that span days or months to be generated very quickly.
The agents are the monitoring components installed on each managed computer. They monitor the system based on the rules and business logic defined in each of the management packs. Management packs are dynamically applied to agents based on the various discovery rules included with each management pack.
OpsMgr utilizes the concept of management groups to logically separate geographical and organizational boundaries. Management groups allow you to scale the size of OpsMgr architecture or politically organize the administration of OpsMgr.
At a minimum, each management group consists of the following components:
OpsMgr can be scaled to meet the needs of different sized organizations. For small organizations, all the OpsMgr components can be installed on one server with a single management group. In large organizations, on the other hand, the distribution of OpsMgr components to separate servers allows the organizations to customize and scale their OpsMgr architecture. Multiple management groups provide load balancing and fault tolerance within the OpsMgr infrastructure. Organizations can set up multiple management servers at strategic locations, to distribute the workload among them.
Note
The general rule of thumb with management groups is to start with a single management group and add more management groups only if they are absolutely necessary. Administrative overhead is reduced, and there is less need to re-create rules and perform other redundant tasks with fewer management groups.
Using OpsMgr is relatively straightforward. The OpsMgr monitoring environment can be accessed through three sets of consoles: an Operations Console, a Web console, and a command shell. The Operations Console provides full monitoring of agent systems and administration of the OpsMgr environment, whereas the Web console provides access only to the monitoring functionality. The command shell provides command-line access to administer the OpsMgr environment.
As mentioned in the preceding section, two methods are provided to configure and view OpsMgr settings. The first approach is through the Operations Console and the second is through the command shell.
In the Administration section of the Operations Console, you can easily configure the security roles, notifications, and configuration settings. In the Monitoring section of the Operations Console, you can easily monitor a quick “up/down” status, active and closed alerts, and overall environment health.
In addition, a web-based monitoring console can be run on any system that supports Microsoft Internet Explorer 6.0 or higher. This console can be used to view the health of systems, view and respond to alerts, view events, view performance graphs, run tasks, and manage maintenance mode of monitored objects.
OpsMgr management packs commonly include a variety of preconfigured reports to show information about the operating system or the specific application, such as SQL Server, they were designed to work with. The reports provide an effective view of systems and services on the network over a custom period, such as weekly, monthly, or quarterly. They can also help you monitor your networks based on performance data, which can include critical pattern analysis, trend analysis, capacity planning, and security auditing. Reports also provide availability statistics for distributed applications, servers, and specific components within a server.
The reports can be run on demand or at scheduled times. OpsMgr can also generate HTML-based reports that can be published to a web server and viewed from any web browser. Vendors can also create additional reports as part of their management packs.
Another key feature of OpsMgr is the capability to monitor and track server performance. OpsMgr can be configured to monitor key performance thresholds through rules that are set to collect predefined performance data, such as memory and CPU usage over time. Rules can be configured to trigger alerts and actions when specified performance thresholds have been met or exceeded, allowing network administrators to act on potential performance issues. Performance data can be viewed from the OpsMgr Operations Console.
In addition, performance monitors can establish baselines for the environment and then alert the administrator when the counter subsequently falls outside the defined baseline envelope. Performance Monitoring with Operations Manager works in conjunction with SQL Server 2008’s Performance Studio. In essence, SQL Server Performance Studio can write performance data to the local Windows Server 2008 application and security logs. Operations Manager can then comb these logs and centralize data into a central warehouse for further analysis and reporting.
Active Directory integration provides a way to install management agents on systems without environment-specific settings. When the agent starts, the correct environmental settings, such as the primary and failover management servers, are stored in Active Directory. The configuration of Active Directory integration provides advanced search and filter capabilities to fine-tune the dynamic assignment of systems.
Network management is not a new concept. Simple management of various network nodes has been handled for quite some time through the use of the SNMP. Quite often, simple or even complex systems that utilize SNMP to provide for system monitoring are in place in an organization to provide for varying degrees of system management on a network.
OpsMgr can be configured to integrate with non-Windows systems through monitoring of syslog information, log file data, and SNMP traps. OpsMgr can also monitor TCP port communication and website transaction sequencing for information-specific data management.
Special connectors can be created to provide bidirectional information flows to other management products. OpsMgr can monitor SNMP traps from SNMP-supported devices as well as generate SNMP traps to be delivered to third-party network management infrastructures.
Network management is not a new concept. Simple management of various network nodes has been handled for quite some time through the use of SNMP. Quite often, simple or even complex systems that utilize SNMP to provide for system monitoring are in place in an organization to provide for varying degrees of system management on a network.
OpsMgr can be configured to integrate with these network systems and management infrastructures. Special connectors can be created to provide bidirectional information flows to other management products. OpsMgr can monitor SNMP traps from SNMP-supported devices as well as generate SNMP traps to be delivered to third-party network management infrastructures. In addition, OpsMgr can also monitor live events on Unix systems using the syslog protocol.
Recently the OpsMgr team has released new extensions for Cross Platform monitoring and management. Systems that can be monitored include; including HP-UX, Sun Solaris, Red Hat Enterprise Linux, and Novell SUSE Linux Enterprise. Currently this technology is still in Beta.
Software and hardware developers can subsequently create their own management packs to extend OpsMgr’s management capabilities. These management packs extend OpsMgr’s management capabilities beyond Microsoft-specific applications. Each management pack is designed to contain a set of rules and product knowledge required to support its respective products. Currently, management packs have been developed for APC, Cisco, Citrix, Dell, F5, HP, IBM, Linux, Oracle, Solaris, UNIX, and VMware, to name a few. A complete list of management packs can be found at the following Microsoft site:
http://www.microsoft.com/technet/prodtechnol/mom/catalog/catalog.aspx
Each OpsMgr component has specific design requirements, and a good knowledge of these factors is required before beginning the design of OpsMgr. Hardware and software requirements must be taken into account, as well as factors involving specific OpsMgr components, such as the Root Management Server, gateway servers, service accounts, mutual authentication, and backup requirements.
Having the proper hardware for OpsMgr to operate on is a critical component of OpsMgr functionality, reliability, and overall performance. Nothing is worse than overloading a brand-new server only a few short months after its implementation. The industry standard generally holds that any production servers deployed should remain relevant for three to four years following deployment. Stretching beyond this time frame might be possible, but the ugly truth is that hardware investments are typically short term and need to be replaced often to ensure relevance. Buying a less expensive server might save money in the short term but could potentially increase costs associated with downtime, troubleshooting, and administration. That said, the following are the Microsoft-recommended minimum requirements for any server running an OpsMgr 2007 server component:
![]() 1.8Ghz+ Pentium or compatible processor
1.8Ghz+ Pentium or compatible processor
![]() 20GB of free disk space
20GB of free disk space
![]() 2GB of random access memory (RAM)
2GB of random access memory (RAM)
These recommendations apply only to the smallest OpsMgr deployments and should be seen as minimum levels for OpsMgr hardware. Future expansion and relevance of hardware should be taken into account when sizing servers for OpsMgr deployment.
OpsMgr components can be installed on either 32-bit or 64-bit versions of Windows Server 2008, Windows Server 2003 R2, or Windows Server 2003 SP1. The database for OpsMgr must be run on a Microsoft SQL Server 2005 (Standard or Enterprise SP1 or above) server. The database can be installed on the same server as OpsMgr or on a separate server, a concept that is discussed in more detail in following sections.
OpsMgr itself must be installed on a member server in a Windows Active Directory domain. It is commonly recommended to keep the installation of OpsMgr on a separate server or set of dedicated member servers that do not run any other applications that could interfere in the monitoring and alerting process.
A few other factors critical to the success of an OpsMgr implementation are as follows:
![]() DNS must be installed to utilize required mutual authentication between domain members and management servers.
DNS must be installed to utilize required mutual authentication between domain members and management servers.
![]() Microsoft .NET Framework 2.0 and 3.0 must be installed on the management server and the reporting server.
Microsoft .NET Framework 2.0 and 3.0 must be installed on the management server and the reporting server.
![]() Client certificates must be installed in environments to facilitate mutual authentication between nondomain members and management servers.
Client certificates must be installed in environments to facilitate mutual authentication between nondomain members and management servers.
![]() SQL Reporting Services must be installed for an organization to be able to view and produce custom reports using OpsMgr’s reporting feature.
SQL Reporting Services must be installed for an organization to be able to view and produce custom reports using OpsMgr’s reporting feature.
The most critical piece of OpsMgr, the SQL databases, should be backed up regularly using a standard backup software that can effectively perform online backups of SQL databases. If integrating these specialized backup utilities into an OpsMgr deployment is not possible, it becomes necessary to leverage built-in backup functionality found in SQL Server, such as the SQL Server backup utility included in SQL Server Management Studio.
OpsMgr agents are deployed to all managed servers through the OpsMgr existing deployment functionality, or by using software distribution mechanisms such as Active Directory GPOs or System Center Configuration Manager 2007. Installation through the Operations Console uses the fully qualified domain name (FQDN) of the computer. When searching for systems through the Operations Console, you can use wildcards to locate a broad range of computers for agent installation. Certain situations, such as monitoring across firewalls, can require the manual installation of these components.
OpsMgr’s simple installation and relative ease of use often betray the potential complexity of its underlying components. This complexity can be managed with the right amount of knowledge of some of the advanced concepts of OpsMgr design and implementation.
As previously mentioned, OpsMgr components can be divided across multiple servers to distribute load and ensure balanced functionality. This separation allows OpsMgr servers to come in four potential “flavors,” depending on the OpsMgr components held by those servers. The four OpsMgr server types are as follows:
![]() Operations database server— An operations database server is simply a member server with SQL Server 2005 and above installed for the OpsMgr operations database. No other OpsMgr components are installed on this server. The SQL Server component can be installed with default options and with the system account used for authentication. Data in this database is kept for 4 days by default.
Operations database server— An operations database server is simply a member server with SQL Server 2005 and above installed for the OpsMgr operations database. No other OpsMgr components are installed on this server. The SQL Server component can be installed with default options and with the system account used for authentication. Data in this database is kept for 4 days by default.
![]() Reporting database server— A reporting database server is simply a member server with SQL Server 2005 and above and SQL Server Reporting Services installed. This database stores data collected through the monitoring rules for a much longer period than the operations database and is used for reporting and trend analysis. This database requires significantly more drive space than the operations database server. Data in this database is kept for 13 months by default.
Reporting database server— A reporting database server is simply a member server with SQL Server 2005 and above and SQL Server Reporting Services installed. This database stores data collected through the monitoring rules for a much longer period than the operations database and is used for reporting and trend analysis. This database requires significantly more drive space than the operations database server. Data in this database is kept for 13 months by default.
![]() Management server— A management server is the communication point for both management consoles and agents. Effectively, a management server does not have a database and is often used in large OpsMgr implementations that have a dedicated database server. Often, in these configurations, multiple management servers are used in a single management group to provide for scalability and to address multiple managed nodes.
Management server— A management server is the communication point for both management consoles and agents. Effectively, a management server does not have a database and is often used in large OpsMgr implementations that have a dedicated database server. Often, in these configurations, multiple management servers are used in a single management group to provide for scalability and to address multiple managed nodes.
![]() All-in-one server— An all-in-one server is effectively an OpsMgr server that holds all OpsMgr roles, including that of the databases. Subsequently, single-server OpsMgr configurations use one server for all OpsMgr operations.
All-in-one server— An all-in-one server is effectively an OpsMgr server that holds all OpsMgr roles, including that of the databases. Subsequently, single-server OpsMgr configurations use one server for all OpsMgr operations.
As previously defined, an OpsMgr management group is a logical grouping of monitored servers that are managed by a single OpsMgr SQL database, one or more management servers, and a unique management group name. Each management group established operates completely separately from other management groups, although they can be configured in a hierarchical structure with a top-level management group able to see “connected” lower-level management groups.
The concept of connected management groups allows OpsMgr to scale beyond artificial boundaries and also gives a great deal of flexibility when combining OpsMgr environments. However, certain caveats must be taken into account. Because each management group is an island in itself, each must subsequently be manually configured with individual settings. In environments with a large number of customized rules, for example, such manual configuration would create a great deal of redundant work in the creation, administration, and troubleshooting of multiple management groups.
Based on the factors outlined in the preceding section, it is preferable to deploy OpsMgr in a single management group. However, in some situations an organization needs to divide its OpsMgr environment into multiple management groups. The most common reason for division of OpsMgr management groups is division along geographic lines. In situations in which wide area network (WAN) links are saturated or unreliable, it might be wise to separate large “islands” of WAN connectivity into separate management groups.
Simply being separated across slow WAN links is not enough reason to warrant a separate management group, however. For example, small sites with few servers would not warrant the creation of a separate OpsMgr management group, with the associated hardware, software, and administrative costs. However, if many servers exist in a distributed, generally well-connected geographical area, that might be a case for the creation of a management group. For example, an organization could be divided into several sites across the United States but decide to divide the OpsMgr environment into separate management groups for East Coast and West Coast, to roughly approximate their WAN infrastructure.
Smaller sites that are not well connected but are not large enough to warrant their own management group should have their event monitoring throttled to avoid being sent across the WAN during peak usage times. The downside to this approach, however, is that the reaction time to critical event response is increased.
The less common method of dividing OpsMgr management groups is by political or security lines. For example, it might become necessary to separate financial servers into a separate management group to maintain the security of the finance environment and allow for a separate set of administrators.
Politically, if administration is not centralized within an organization, management groups can be established to separate OpsMgr management into separate spheres of control. This would keep each OpsMgr management zone under separate security models.
As previously mentioned, a single management group is the most efficient OpsMgr environment and provides for the least amount of redundant setup, administration, and troubleshooting work. Consequently, artificial OpsMgr division along political or security lines should be avoided, if possible.
Depending on several factors, such as the type of data collected, the length of time that collected data will be kept, or the amount of database grooming that is scheduled, the size of the OpsMgr database will grow or shrink accordingly.
It is important to monitor the size of the database to ensure that it does not increase well beyond the bounds of acceptable size. OpsMgr can be configured to monitor itself, supplying advance notice of database problems and capacity thresholds. This type of strategy is highly recommended because OpsMgr could easily collect event information faster than it could get rid of it.
The size of the operations database can be estimated through the following formula:
Number of agents x 5MB x retention days +![]() 1024 overhead = estimated database size
1024 overhead = estimated database size
For example, an OpsMgr environment monitoring 1,000 servers with the default 7-day retention period will have an estimated 35GB operations database.
(1000 * 5 * 7) + 1024 = 36024 MB
The size of the reporting database can be estimated through the following formula:
Number of agents x 3MB x retention days +![]() 1024 overhead = estimated database size
1024 overhead = estimated database size
The same environment monitoring 1,000 servers with the default 400-day retention period will have an estimated 1.1TB reporting database.
(1000 * 3 * 400) + 1024 = 1201024 MB
As with any system, OpsMgr includes some hard limits that should be taken into account before deployment begins. Surpassing these limits could be cause for the creation of new management groups and should subsequently be included in a design plan. These limits are as follows:
![]() Operations database— OpsMgr operates through a principle of centralized, rather than distributed, collection of data. All event logs, performance counters, and alerts are sent to a single centralized database, and subsequently there can only be a single operations database per management group. The use of a backup and high-availability strategy for the OpsMgr database is, therefore, highly recommended, to protect it from outage. It is recommended to keep this database with a 50GB limit to improve efficiency and reduce alert latency.
Operations database— OpsMgr operates through a principle of centralized, rather than distributed, collection of data. All event logs, performance counters, and alerts are sent to a single centralized database, and subsequently there can only be a single operations database per management group. The use of a backup and high-availability strategy for the OpsMgr database is, therefore, highly recommended, to protect it from outage. It is recommended to keep this database with a 50GB limit to improve efficiency and reduce alert latency.
![]() Management servers— OpsMgr does not have a hard-coded limit of management servers per management group. However, it is recommended to keep the environment between three to five management servers. Each management server can support approximately 2,000 managed agents.
Management servers— OpsMgr does not have a hard-coded limit of management servers per management group. However, it is recommended to keep the environment between three to five management servers. Each management server can support approximately 2,000 managed agents.
![]() Gateway servers— OpsMgr does not have a hard-coded limit of gateway servers per management group. However, it is recommended to deploy a gateway server for every 200 nontrusted domain members.
Gateway servers— OpsMgr does not have a hard-coded limit of gateway servers per management group. However, it is recommended to deploy a gateway server for every 200 nontrusted domain members.
![]() Agents— Each management server can theoretically support up to 2,000 monitored agents. In most configurations, however, it is wise to limit the number of agents per management server, although the levels can be scaled upward with more robust hardware, if necessary.
Agents— Each management server can theoretically support up to 2,000 monitored agents. In most configurations, however, it is wise to limit the number of agents per management server, although the levels can be scaled upward with more robust hardware, if necessary.
![]() Administrative consoles— OpsMgr does not limit the number of instances of the Web and Operations Consoles; however, going beyond the suggested limit might introduce performance and scalability problems.
Administrative consoles— OpsMgr does not limit the number of instances of the Web and Operations Consoles; however, going beyond the suggested limit might introduce performance and scalability problems.
In addition to the scalability built in to OpsMgr, redundancy is built in to the components of the environment. Proper knowledge of how to deploy OpsMgr redundancy and place OpsMgr components correctly is important to the understanding of OpsMgr redundancy.
Having multiple management servers deployed across a management group allows an environment to achieve a certain level of redundancy. If a single management server experiences downtime, another management server within the management group will take over the responsibilities for the monitored servers in the environment. For this reason, it might be wise to include multiple management servers in an environment to achieve a certain level of redundancy if high uptime is a priority.
The first management server in the management group is called the Root Management Server. Only one Root Management Server can exist in a management group, and it hosts the software development kit (SDK) and Configuration service. All OpsMgr consoles communicate with the management server, so its availability is critical. In large-scale environments, the Root Management Server should leverage Microsoft Clustering technology to provide high availability for this component.
Because there can be only a single OpsMgr database per management group, the database is subsequently a single point of failure and should be protected from downtime. Utilizing Windows Server 2008 clustering or third-party fault-tolerance solutions for SQL databases helps to mitigate the risk involved with the OpsMgr database.
Security has evolved into a primary concern that can no longer be taken for granted. The inherent security in Windows 2008 is only as good as the services that have access to it; therefore, it is wise to perform a security audit of all systems that access information from servers. This concept holds true for management systems as well because they collect sensitive information from every server in an enterprise. This includes potentially sensitive event logs that could be used to compromise a system. Consequently, securing the OpsMgr infrastructure should not be taken lightly.
Each server that contains an OpsMgr agent and forwards events to management servers has specific security requirements. Server-level security should be established and should include provisions for OpsMgr data collection. All traffic between OpsMgr components, such as the agents, management servers, and database, is encrypted automatically for security, so the traffic is inherently secured.
In addition, environments with high security requirements should investigate the use of encryption technologies such as IPSec to scramble the event IDs that are sent between agents and OpsMgr servers, to protect against eavesdropping of OpsMgr packets.
OpsMgr uses mutual authentication between agents and management servers. This means that the agent must reside in the same forest as the management server. If the agent is located in a different forest or workgroup, client certificates can be used to establish mutual authentication. If an entire nontrusted domain must be monitored, the gateway server can be installed in the nontrusted domain, agents can establish mutual authentication to the gateway server, and certificates on the gateway and management server are used to establish mutual authentication. In this scenario, you can avoid needing to place a certificate on each nontrusted domain member.
OpsMgr servers that are deployed across a firewall have special considerations that must be taken into account. Port 5723, the default port for OpsMgr communications, must specifically be opened on a firewall to allow OpsMgr to communicate across it. The following describes communication for other OpsMgr components:
![]() Operations Console to RMS—TCP 5724
Operations Console to RMS—TCP 5724
![]() Operations Console to Reporting Server—TCP 80
Operations Console to Reporting Server—TCP 80
![]() Web console to Web console server—TCP 51908, 445
Web console to Web console server—TCP 51908, 445
![]() Agent to Root Management Server—TCP 5723
Agent to Root Management Server—TCP 5723
![]() ACS forwarder to ACS collector—TCP 51909
ACS forwarder to ACS collector—TCP 51909
![]() Agentless management—Remote Procedure Call (RPC)
Agentless management—Remote Procedure Call (RPC)
![]() Management server to databases—OLEDB TCP 1433
Management server to databases—OLEDB TCP 1433
In addition to the aforementioned security measures, security of an OpsMgr environment can be strengthened by the addition of multiple service accounts to handle the different OpsMgr components. For example, the Management Server Action account and the SDK/Configuration service account should be configured to use separate credentials, to provide an extra layer of protection in the event that one account is compromised.
![]() Management Server Action account— The account responsible for collecting data and running responses from management servers.
Management Server Action account— The account responsible for collecting data and running responses from management servers.
![]() SDK and Configuration service account— The account that writes data to the operations database; this service is also used for all console communication.
SDK and Configuration service account— The account that writes data to the operations database; this service is also used for all console communication.
![]() Local Administrator account— The account used during the agent push installation process. To install the agent, local administrative rights are required.
Local Administrator account— The account used during the agent push installation process. To install the agent, local administrative rights are required.
![]() Agent Action account— The credentials the agent will run as. This account can run under a built-in system account, such as Local System, or a limited domain user account for high-security environments.
Agent Action account— The credentials the agent will run as. This account can run under a built-in system account, such as Local System, or a limited domain user account for high-security environments.
![]() Data Warehouse Write Action account— The account used by the management server to write data to the reporting data warehouse.
Data Warehouse Write Action account— The account used by the management server to write data to the reporting data warehouse.
![]() Data Warehouse Reader account— The account used to read data from the data warehouse when reports are executed.
Data Warehouse Reader account— The account used to read data from the data warehouse when reports are executed.
![]() Run As accounts— The specific accounts used by management packs to facilitate monitoring. These accounts must be manually created and delegated specific rights as defined in the management pack documentation. These accounts are then assigned as run-as accounts used by the management pack to achieve a high-degree of security and flexibility when monitoring the environment.
Run As accounts— The specific accounts used by management packs to facilitate monitoring. These accounts must be manually created and delegated specific rights as defined in the management pack documentation. These accounts are then assigned as run-as accounts used by the management pack to achieve a high-degree of security and flexibility when monitoring the environment.
When imported, the SQL Server management pack automatically discovers the following objects on managed SQL Server systems in the management group:
![]() SQL Server 2008 Database Engine
SQL Server 2008 Database Engine
![]() SQL Server 2008 Analysis Services
SQL Server 2008 Analysis Services
![]() SQL Server 2008 Reporting Services
SQL Server 2008 Reporting Services
![]() SQL Server 2008 Integration Services
SQL Server 2008 Integration Services
![]() SQL Server 2008 Distributor
SQL Server 2008 Distributor
![]() SQL Server 2008 Publisher
SQL Server 2008 Publisher
![]() SQL Server 2008 Subscriber
SQL Server 2008 Subscriber
![]() SQL Server 2008 DB
SQL Server 2008 DB
![]() SQL Server 2008 Agent
SQL Server 2008 Agent
![]() SQL Server 2008 Agent Jobs
SQL Server 2008 Agent Jobs
![]() SQL Server 2008 DB File Group
SQL Server 2008 DB File Group
![]() SQL Server 2008 DB File
SQL Server 2008 DB File
![]() SQL Server 2008 Transaction Log File
SQL Server 2008 Transaction Log File
As you can see, OpsMgr finds many of the components associated with a SQL Server and not just the server itself. Availability statistics of each component can be calculated independently or together as a group. For example, an availability report can be scheduled for a single database on a server or the entire server. This type of discovery also allows each component to be placed into maintenance mode independently of other components on the server. For example, a single database can be placed into maintenance mode to prevent alerts from being generated when the database is worked on or repaired while other databases on the server are still being monitored.
In addition to basic monitoring of SQL Server—related events and performance data, the SQL Server management pack provides advanced monitoring through custom scripts associated with rules in the management pack. The following rules are specific to SQL Server monitoring. Each rule can be customized for the environment or even a specific server being monitored.
![]() Block Analysis— When an SPID is blocked for more than one minute, an alert is generated. This detection can be configured through the Blocking SPIDs monitor associated with the SQL 2008 DB Engine object. Alert details include; blocked SPID, blocked by SPID, program name, block duration, login name, database name and resources.
Block Analysis— When an SPID is blocked for more than one minute, an alert is generated. This detection can be configured through the Blocking SPIDs monitor associated with the SQL 2008 DB Engine object. Alert details include; blocked SPID, blocked by SPID, program name, block duration, login name, database name and resources.
![]() Database Configuration— SQL Server—specific configurable options such as Auto Close, Auto Create Statistics, Auto Shrink, Auto Update, DB Chaining, and Torn Page Detection. This detection can be configured through the corresponding configuration monitors associated with the SQL 2008 DB object.
Database Configuration— SQL Server—specific configurable options such as Auto Close, Auto Create Statistics, Auto Shrink, Auto Update, DB Chaining, and Torn Page Detection. This detection can be configured through the corresponding configuration monitors associated with the SQL 2008 DB object.
![]() Database Health— Tracks the availability and current state of databases on SQL Servers in the environment. This detection can be configured through the Database Status monitor associated with the SQL Server 2008 DB object.
Database Health— Tracks the availability and current state of databases on SQL Servers in the environment. This detection can be configured through the Database Status monitor associated with the SQL Server 2008 DB object.
![]() Database and Disk Space— The free space within database and transaction logs is monitored. An alert is an event generated when predefined thresholds are exceeded or a significant change in size is detected. This detection can be configured through the corresponding performance monitors associated with the SQL Server 2008 DB object.
Database and Disk Space— The free space within database and transaction logs is monitored. An alert is an event generated when predefined thresholds are exceeded or a significant change in size is detected. This detection can be configured through the corresponding performance monitors associated with the SQL Server 2008 DB object.
![]() Replication Monitoring— The whole SQL Server replication topology is monitored indicating overall health and alerts based on replication failures.
Replication Monitoring— The whole SQL Server replication topology is monitored indicating overall health and alerts based on replication failures.
![]() Backups— Monitoring of all backup items such as failed and successful backups are captured and presented.
Backups— Monitoring of all backup items such as failed and successful backups are captured and presented.
![]() Jobs— Agent jobs that run for more than 60 minutes will generate an alert by default. This detection can be configured through the Long Running Jobs performance monitor associated with the SQL 2008 Agent object. Other jobs and associated items such as failed SQL Server Agent jobs, job corruption and SQL Server Mail are also monitored and alerted upon.
Jobs— Agent jobs that run for more than 60 minutes will generate an alert by default. This detection can be configured through the Long Running Jobs performance monitor associated with the SQL 2008 Agent object. Other jobs and associated items such as failed SQL Server Agent jobs, job corruption and SQL Server Mail are also monitored and alerted upon.
![]() Security Monitoring— Tracks security and audit events such as; license compliance, shutdowns, configuration issues, collection of audit data, denied administration functions, and both successful and failed logons.
Security Monitoring— Tracks security and audit events such as; license compliance, shutdowns, configuration issues, collection of audit data, denied administration functions, and both successful and failed logons.
![]() Service Pack Compliance— The current service pack level can be monitored by configuring the Service Pack Compliance configuration monitor associated with the SQL Server 2008 DB Engine object. An alert is generated when a server is not at the required service pack level.
Service Pack Compliance— The current service pack level can be monitored by configuring the Service Pack Compliance configuration monitor associated with the SQL Server 2008 DB Engine object. An alert is generated when a server is not at the required service pack level.
Within the Monitoring area of the Operators console, the following views are available to assist with monitoring the environment:
![]() Alerts view
Alerts view
![]() Computers View
Computers View
![]() Database Free Space Performance
Database Free Space Performance
![]() Transaction Log Free Space Performance
Transaction Log Free Space Performance
![]() Database State
Database State
![]() Agent Health State
Agent Health State
![]() Database Engine Health State
Database Engine Health State
![]() Analysis Services State
Analysis Services State
![]() Database Engines State
Database Engines State
![]() Integration Services State
Integration Services State
![]() Reporting Services State
Reporting Services State
![]() Database Mirroring State
Database Mirroring State
![]() Server Resource Utilization
Server Resource Utilization
![]() SQL Agent Job State
SQL Agent Job State
![]() SQL Agent State
SQL Agent State
The SQL Server management pack also includes several default reports to help with trend-specific SQL:
![]() SQL Broker Performance
SQL Broker Performance
![]() SQL Server Database Counters
SQL Server Database Counters
![]() SQL Server Configuration
SQL Server Configuration
![]() SQL Server Lock Analysis
SQL Server Lock Analysis
![]() SQL Server Service Pack
SQL Server Service Pack
![]() SQL User Activity
SQL User Activity
![]() Top Five Deadlocked Databases
Top Five Deadlocked Databases
![]() User Connections by Day
User Connections by Day
![]() User Connections by Peak Hours
User Connections by Peak Hours
![]() SQL Database Space Report
SQL Database Space Report
The latest version of management packs should always be used because it includes many improvements and updates from the release code.
As previously mentioned, management packs contain intelligence about specific applications and services and include troubleshooting information specific to those services. The SQL Server 2008 Management Pack is required for effectively proactively monitoring a SQL Server 2008 infrastructure.
To install the SQL 2008 Management Pack on an OpsMgr management server, first download it from the Microsoft downloads page at www.microsoft.com/technet/prodtechnol/mom/catalog/catalog.aspx?vs=2007.
To install the SQL Server 2008 Management Pack on the OpsMgr management server, follow these steps:
1. Double-click on the downloaded executable.
2. Select I Agree on the license agreement page and click Next to continue.
3. Select a location to which to extract the management pack and then click Next.
4. Click Next again to start the installation.
5. Click Close when the file extraction is complete.
After extracting the management pack, follow these steps to upload the management pack files directly into the OpsMgr administrator console:
1. From the OpsMgr Console, navigate to the Administration node.
2. Click the Import Management Packs link.
3. From the Select Management Packs to Import dialog box, browse to the location where the files were extracted and select all of them. Click Open.
4. From the Import Management Packs dialog box, shown in Figure 18.2, click Import.
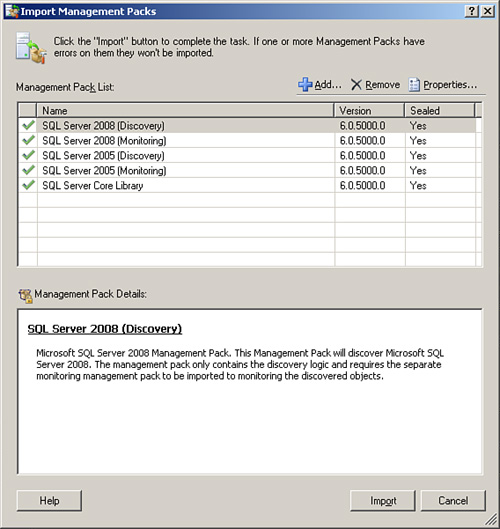
5. Click Close when finished.
Note
When managing a Windows infrastructure, it is a best practice not to download only the SQL Server Management Pack. Other management packs that should be downloaded and installed include: Windows Server 2003/2008 Base Operating System Management Pack and the Windows Server 2003/ 2008 Active Directory Management Pack.
Installation of OpsMgr agents on SQL Server can be automated from the OpsMgr console. To initiate the process of installing agents, follow these steps:
1. From the OpsMgr 2007 Console, click the Monitoring node.
2. Click the Required: Configure Computers and Devices to Manage link.
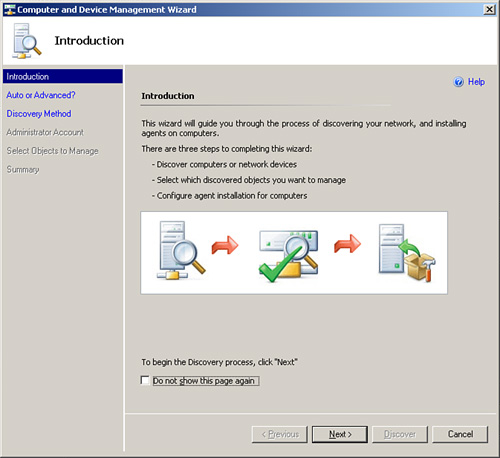
3. From the Computer and Device Management Wizard, shown in Figure 18.3, select Next to start the process of deploying agents.
4. In the Auto or Advanced dialog box, select Automatic Computer Discovery or experiment by doing a selective search. Note that Automatic Computer Discovery can take a while and have a network impact. Click Next to continue.
5. Enter a service account to perform the search; it must have local admin rights on the boxes where the agents will be installed. You can also select to use the Action account. Click Discover to continue.
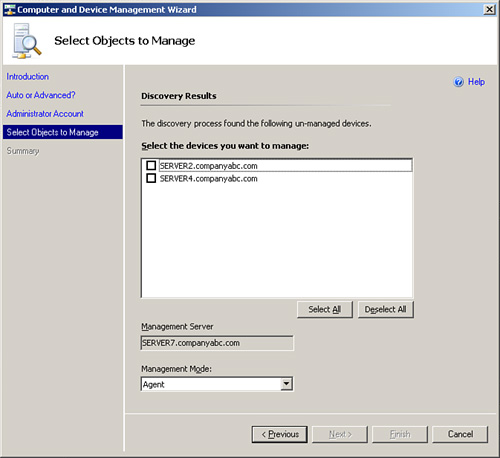
6. After discovery, a list of discovered servers is displayed, as shown in Figure 18.4. Check the boxes next to the servers where the agents will be installed and click Next.
7. On the summary page, leave the defaults and click Finish.
8. Click Close when complete.
After completing the installation, you might need to wait a few minutes before the information from the agents is sent to the console.
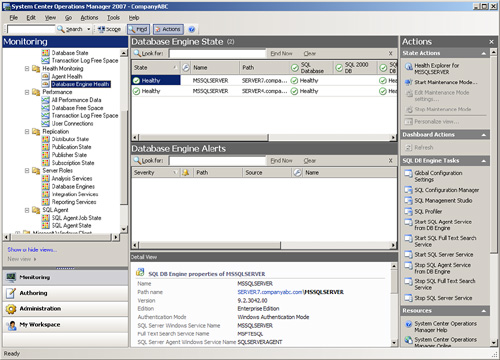
After the management pack is installed for SQL Server and the agent has been installed and is communicating, OpsMgr consolidates and reacts to every event and performance counter sent to it from the SQL Server. This information is reflected in the OpsMgr operations console, as shown in Figure 18.5.
For more information on OpsMgr 2007, see the Microsoft website at www.microsoft.com/opsmgr.
The built-in monitoring tools provide a limited amount of proactive monitoring by allowing you to configure events as necessary to alert operators. Built-in monitoring tools also provide a historical analysis through logs, greatly assisting the troubleshooting process.
System Center Operations Manager 2007 is an ideal monitoring and management platform for a SQL Server farm and has proven its value in proactively identifying potential server issues before they degrade into server downtime. OpsMgr for SQL Server provides the built-in reliability of the OS and allows for greater control over a large, distributed server environment. In addition, proper understanding of OpsMgr components, their logical design and configuration, and other OpsMgr placement issues can help an organization to fully realize the advantages that OpsMgr can bring to a SQL Server 2008 environment.
The following are best practices from this chapter:
![]() Examine the use of System Center Operations Manager 2007 for monitoring SQL Servers.
Examine the use of System Center Operations Manager 2007 for monitoring SQL Servers.
![]() Install the updated SQL 2008 Management Pack into the OpsMgr management group.
Install the updated SQL 2008 Management Pack into the OpsMgr management group.
![]() Take future expansion and relevance of hardware into account when sizing servers for OpsMgr deployment.
Take future expansion and relevance of hardware into account when sizing servers for OpsMgr deployment.
![]() Keep the installation of OpsMgr on a separate server or set of separate dedicated member servers that do not run any other separate applications.
Keep the installation of OpsMgr on a separate server or set of separate dedicated member servers that do not run any other separate applications.
![]() Use SQL Server Reporting Services to produce custom reports using OpsMgr’s reporting feature.
Use SQL Server Reporting Services to produce custom reports using OpsMgr’s reporting feature.
![]() Start with a single management group and add additional management groups only if they are absolutely necessary.
Start with a single management group and add additional management groups only if they are absolutely necessary.
![]() Use a dedicated service account for OpsMgr.
Use a dedicated service account for OpsMgr.
![]() Monitor the size of the OpsMgr database to ensure that it does not increase beyond the bounds of acceptable size.
Monitor the size of the OpsMgr database to ensure that it does not increase beyond the bounds of acceptable size.
![]() Archive collected data.
Archive collected data.
![]() Modify the grooming interval to aggressively address space limitations and keep the database consistent.
Modify the grooming interval to aggressively address space limitations and keep the database consistent.
![]() Configure OpsMgr to monitor itself.
Configure OpsMgr to monitor itself.
![]() Satisfy regulatory compliance by leveraging OpsMgr’s Audit Collection Services (ACS) for centralizing and auditing SQL Server events.
Satisfy regulatory compliance by leveraging OpsMgr’s Audit Collection Services (ACS) for centralizing and auditing SQL Server events.