
Chapter 17 Monitoring SQL Server 2008 with Native Tools
The detection and resolution of anomalies within SQL Server will always be part of a DBA’s duty. As such, DBAs should be aware that the effectiveness of the detection technique, and the first step to a resolution, lies in the department’s commitment to monitoring. A strong commitment to monitoring is key for ensuring that a SQL Server 2008 system stays operational with as few unplanned interruptions as possible. When anomalies do occur, monitoring ensures that the issues are quickly identified and corrected. Without a strong commitment to monitoring, issues left unattended can quickly grow into major issues if not dealt with, eventually leading to a production outage.
For monitoring enthusiasts, there are many monitoring tools, new and old, to pique your interest in this chapter. For starters, the tools and utilities identified in this chapter are similar to those found in previous versions of SQL Server. As with most features associated with Microsoft, however, the features and functionality of the tools have been vastly improved and expanded upon in the latest edition. In addition, SQL Server 2008 also introduces new tools for monitoring. Some of the new features receiving close attention in SQL Server 2008 include Extended Events, SQL Server Audit, and Performance Studio.
This chapter first covers the tools and utilities that allow a DBA to gain quick insight into a SQL Server system running on Windows Server 2008. It then discusses and illustrates how to monitor changes on a SQL Server system and/or database with SQL Server Audit. The latter part of the chapter covers data collection gathering with Performance Studio and explains how to conduct performance monitoring with the Windows Server 2008 Reliability and Performance Monitor tools. The chapter ends with coverage of configuring SQL Server alerts, operators, and emails.
![]() The introduction of the SQL Server Audit object and SQL Server Audit Specification object improves compliance and security by enabling organizations to audit every SQL Server Event within an instance.
The introduction of the SQL Server Audit object and SQL Server Audit Specification object improves compliance and security by enabling organizations to audit every SQL Server Event within an instance.
![]() DBAs can gain quick insight rather effortlessly with the new revamped Activity Monitor tool. With one click of a button, Activity Monitor provides graphical real-time performance data on a SQL Server system’s processes, resource waits, and data file I/O, and it also illustrates expensive queries.
DBAs can gain quick insight rather effortlessly with the new revamped Activity Monitor tool. With one click of a button, Activity Monitor provides graphical real-time performance data on a SQL Server system’s processes, resource waits, and data file I/O, and it also illustrates expensive queries.
![]() On systems that run Windows Server 2008, DBAs can leverage the new Task Manager, Resource Monitor, and Reliability and Performance Monitoring tools to monitor, diagnose, and troubleshoot a SQL Server system.
On systems that run Windows Server 2008, DBAs can leverage the new Task Manager, Resource Monitor, and Reliability and Performance Monitoring tools to monitor, diagnose, and troubleshoot a SQL Server system.
![]() Performance insights can be achieved by implementing Performance Studio. Performance Studio is a new data collection utility that captures performance data from one or more SQL Server 2008 instances and stores it in a centralized management data warehouse.
Performance insights can be achieved by implementing Performance Studio. Performance Studio is a new data collection utility that captures performance data from one or more SQL Server 2008 instances and stores it in a centralized management data warehouse.
![]() SQL Server 2008 also provides new Dynamic Management Views (DMVs) for mentoring and troubleshooting SQL Server instances.
SQL Server 2008 also provides new Dynamic Management Views (DMVs) for mentoring and troubleshooting SQL Server instances.
The preceding section is a testament to all the new monitoring tools introduced with SQL Server 2008. It is worth noting that even with these new tools, some DBAs will encounter situations when they need to gain insight into a SQL Server system quickly and effortlessly, but don’t have the cycles to implement features such as SQL Server Audit, Performance Studio, or Profiler. The following sections will illustrate SQL Server 2008 and Windows Server 2008 tools and utilities that will ensure that a DBA’s efforts are not impeded.
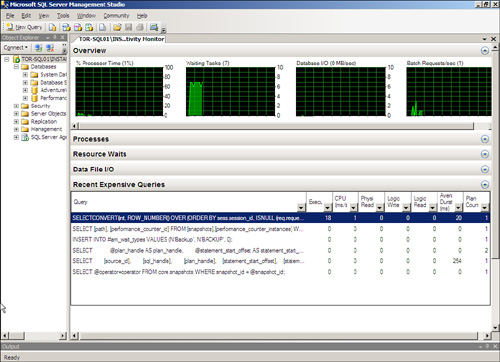
The SQL Server Activity Monitor, as displayed in Figure 17.1, is one of the first tools a DBA should leverage when a quick overview of a SQL Server system’s performance is needed. Activity Monitor has been completely rewritten in SQL Server 2008, and compared to its predecessors, it is no longer limited to displaying processes, locks by object, and locks by process. Activity Monitor introduced a newly redesigned performance dashboard with intuitive graphs and performance indicators with drill-down and filtering capabilities. The new tool’s look and feel is very similar to the Resource Monitoring tool found in Windows Server 2008; however, the information captured and presented is broken down into five major sections dedicated to SQL Server performance monitoring. The sections, as illustrated in Figure 17.1, are Overview, Processes, Resource Waits, Data File I/O, and Recent Expensive Queries. The tool can be invoked by right-clicking a SQL Server instance within Object Explorer and specifying Activity Monitor.
![]() Overview— The first section is called Overview. It provides a dashboard of intuitive graphs and charts that illustrate the SQL Server system’s Process Time, Waiting Tasks, Database I/O and Batch Requests/sec in real time.
Overview— The first section is called Overview. It provides a dashboard of intuitive graphs and charts that illustrate the SQL Server system’s Process Time, Waiting Tasks, Database I/O and Batch Requests/sec in real time.
![]() Processes— The next section in the dashboard is Processes. When this section is expanded, a DBA can quickly monitor and assess the status of a given SQL Server process currently running on the system. Activity Monitor displays a list of current processes on the server such as the session ID, the status of each process, who initiated it (by login ID), the database that the process is using, and the SQL command that the process is running. SQL Server assigns a unique number to each process; this unique number is called a server process ID (“SPID”). Moreover, metrics associated with each process ID are also presented. A tremendous amount of data is presented in this section, but it is possible to filter data by rows within a specific column. By right-clicking a process, a DBA can obtain more details, kill a process, or trace the process directly in SQL Server Profiler.
Processes— The next section in the dashboard is Processes. When this section is expanded, a DBA can quickly monitor and assess the status of a given SQL Server process currently running on the system. Activity Monitor displays a list of current processes on the server such as the session ID, the status of each process, who initiated it (by login ID), the database that the process is using, and the SQL command that the process is running. SQL Server assigns a unique number to each process; this unique number is called a server process ID (“SPID”). Moreover, metrics associated with each process ID are also presented. A tremendous amount of data is presented in this section, but it is possible to filter data by rows within a specific column. By right-clicking a process, a DBA can obtain more details, kill a process, or trace the process directly in SQL Server Profiler.
![]() Resource Waits— This section displays resource waits vertically that are based on the following wait categories: CPU, SQLCLR, Network I/O, Latch, Lock, Logging, Memory, Buffer I/O, Buffer Latch, and Compilation. From a horizontal perspective, the Wait Time, Recent Wait Time, Average Waiter Counter, and Cumulative Wait Time metrics are published for each Wait Category. As in the Processes section, data can be filtered based on items within a column.
Resource Waits— This section displays resource waits vertically that are based on the following wait categories: CPU, SQLCLR, Network I/O, Latch, Lock, Logging, Memory, Buffer I/O, Buffer Latch, and Compilation. From a horizontal perspective, the Wait Time, Recent Wait Time, Average Waiter Counter, and Cumulative Wait Time metrics are published for each Wait Category. As in the Processes section, data can be filtered based on items within a column.
![]() Data File I/O— The Data File I/O section displays I/O activity for relational database files within the Database Engine. It includes both the system and user databases. Information is broken down by database and database file name. In addition, MB/sec Read, MB/sec Written, and Response Time (ms) are presented.
Data File I/O— The Data File I/O section displays I/O activity for relational database files within the Database Engine. It includes both the system and user databases. Information is broken down by database and database file name. In addition, MB/sec Read, MB/sec Written, and Response Time (ms) are presented.
![]() Recent Expensive Queries— The final section in Activity Monitor is Recent Expensive Queries, which provides DBAs the opportunity to capture the queries that are performing the worst and negatively impacting a SQL Server instance. Approximately 10 to 15 of the worst and most expensive queries are displayed in the performance dashboard. The actual query is displayed with augmenting metrics such as Execution in Minutes, CPU ms/sec, Physical Reads/sec, Logical Write/sec, Logical Reads/sec, Average Duration in ms, and Plan Count. It is also possible to right-click the most expensive query and edit the query text or show the execution plan.
Recent Expensive Queries— The final section in Activity Monitor is Recent Expensive Queries, which provides DBAs the opportunity to capture the queries that are performing the worst and negatively impacting a SQL Server instance. Approximately 10 to 15 of the worst and most expensive queries are displayed in the performance dashboard. The actual query is displayed with augmenting metrics such as Execution in Minutes, CPU ms/sec, Physical Reads/sec, Logical Write/sec, Logical Reads/sec, Average Duration in ms, and Plan Count. It is also possible to right-click the most expensive query and edit the query text or show the execution plan.
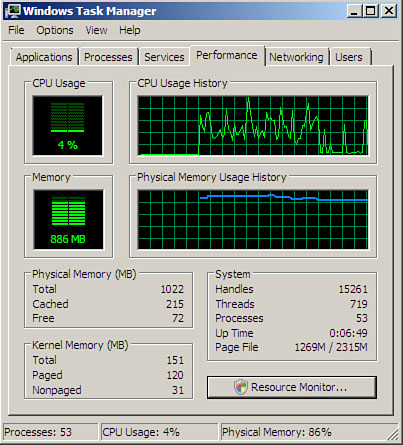
The Task Manager is a familiar monitoring tool found in Windows Server 2008. Ultimately, the tool is very similar to the Task Manager included with previous versions of Windows such as Windows Server 2003. It still provides an instant view of system resources such as processor activity, process activity, memory usage, networking activity, user information, and resource consumption. However, there are some noticeable changes DBAs should be aware of, including the addition of a Services tab and the ability to launch the Resource Monitor directly from within the Performance tab.
The Windows Server 2008 Task Manager is very useful for an immediate view of key system operations. It comes in handy when a user notes slow response time, system problems, or other nondescript problems with the network. With just a quick glance at the Task Manager, you can see whether a SQL Server system is using all available disk, processor, memory, or networking resources.
There are three methods to launch the Task Manager:
![]() Right-click the taskbar and select Task Manager.
Right-click the taskbar and select Task Manager.
![]() Press Ctrl+Shift+Esc.
Press Ctrl+Shift+Esc.
![]() Press Ctrl+Alt+Del, and select Start Task Manager.
Press Ctrl+Alt+Del, and select Start Task Manager.
When the Task Manager loads, you will notice six tabs, as shown in Figure 17.2: Applications, Processes, Services, Performance, Networking, and Users.
The following sections provide a closer look at how helpful the Task Manager components can be.
The first tab on the Task Manager is the Applications tab. The Applications view provides a list of tasks in the left column and the status of these applications in the right column. The status information enables you to determine whether an application like SQL Server Management Studio or SQL Server Configuration Manager is running and allows you to terminate an application that is not responding, in trouble, or causing problems for your server. To stop such an application, highlight the particular application and click End Task at the bottom of the Task Manager. You can also switch to another application if you have several applications running. To do so, highlight the program and click Switch To at the bottom of the Task Manager. Finally, you can create a dump file that can be used when a point-in-time snapshot of every process running is needed for advanced troubleshooting. To create a dump file, right-click on an application and select Create Dump File.
The second Task Manager tab is the Processes tab. It provides a list of running processes on the server. It also measures the performance in simple data format. This information includes CPU percent used, memory allocated to each process, and username used in initiating a process, which includes system, local, and network services.
If the initial analysis of the process on your server, such as SQL Server Integration Package or SQL Server instance, takes up too much CPU percentage or uses too many memory resources, thereby hindering server performance, you can sort the processes by clicking the CPU or Memory (Private Working Set) column header. The processes are then sorted in order of usage. This way, you can tell which one is slowing down performance on your server. You can terminate a process by selecting the process and clicking the End Process button.
Many other performance or process measures can be removed or added to the Processes view. They include, but are not limited to, process identifier (PID), CPU time, session ID, and page faults. To add these measures, select View, Select Columns to open the Select Column property page. Here, you can add process counters to the process list or remove them from the list.
The newest addition to the family of Task Manager tabs is the Services tab. When this tab is selected, you can quickly assess and troubleshoot a specific Windows or SQL Server service by viewing whether it has stopped or is still running. The Services tab also offers additional key details including the service name, service description, and service group. In addition, it is also possible to launch the Services snap-in if you need to make changes to a specific service. For example, if you know a given service should be running and you don’t see it running in the Process tab (common services include SQL Server Browser, SQL Server, or SQL Server Agent), you can just go to the Services tab and attempt to start the service from there. It’s very rudimentary, but in keeping with what Task Manager is typically used for, it does offer a quick overview of system status and preliminary problem resolution.
The Performance tab allows you to view the CPU and pagefile usage in graphical form. This information is especially useful when you need a quick view of a performance bottleneck. The Performance tab makes it possible to graph a percentage of processor time in Kernel mode. To show this, select View, Show Kernel Times. The kernel time is represented by the red line in the graph. The kernel time is the measure of time that applications are using operating system services. The other processor time is known as User mode. User mode processor time is spent in threads that are spawned by applications on the system. If your server has multiple CPU processors installed, you can view multiple CPU graphs at a time by selecting View, CPU History. Also on the Performance tab you will find a button labeled Resource Monitor. You can invoke Resource Monitor for additional analysis of the system. Resource Monitor is covered in the section “Using the Windows Server 2008 Performance and Reliability Monitoring Tools.”
The Networking tab provides a measurement of the network traffic for the connections on the local server in graphical form. This utility is a great way to monitor database mirroring traffic between two SQL Server systems. For multiple network connections—whether they are dial-up, LAN connections, a WAN connection, a VPN connection, or the like—the Networking tab displays a graphical comparison of the traffic for each connection. It provides a quick overview of the adapter, network utilization, link speed, and state of your connection.
To show a visible line on the graph for network traffic on any interface, the view automatically scales to magnify the view of traffic versus available bandwidth. The graph scales from 0% to 100% if the Auto Scale option is not enabled. The greater the percentage shown on the graph, the less is the magnified view of the current traffic. To auto-scale and capture network traffic, select Options, Auto Scale.
It is possible to break down traffic on the graph into Bytes Sent, Received, and Total Bytes by selecting View, Network Adapter History and checking the selections you’d like graphed. This can be useful if you determine the overall throughput is high and you need to quickly determine if inbound or outbound traffic is an issue. In this situation, the default setting is displayed in Total Bytes.
You can also add more column headings by selecting View, Select Columns. Various network measures can be added or removed; they include Bytes Throughput, Bytes Sent/Interval, Unicast Sent and Received, and so on.
Tip
If you suspect a possible network server problem, launch the Task Manager and quickly glance at the information on CPU utilization, memory available, process utilization, and network utilization. When the utilization of any or all of these items exceeds 80 to 90 percent, there may be a bottleneck or overutilization of the resource. However, if all the utilization information shows demand being less than 5 percent, the problem is probably not related to server operations.
The final tab on the Task Manager is the Users tab, which displays a list of the users who can access the server, session status, and names. The following five columns are available on the Users tab:
![]() User— Shows the users logged on the server. As long as the user is not connected by means of a console session, it is possible to control the session remotely or send a message. Remote Control can be initiated by right-clicking the user and selecting Remote Control. The level of control is dictated by the security settings associated with Remote Desktop.
User— Shows the users logged on the server. As long as the user is not connected by means of a console session, it is possible to control the session remotely or send a message. Remote Control can be initiated by right-clicking the user and selecting Remote Control. The level of control is dictated by the security settings associated with Remote Desktop.
![]() ID— Displays the numeric ID that identifies the session on the server.
ID— Displays the numeric ID that identifies the session on the server.
![]() Client Name— Specifies the name of the client computer using the session, if applicable.
Client Name— Specifies the name of the client computer using the session, if applicable.
![]() Status— Displays the current status of a session. Sessions can be either Active or Disconnected.
Status— Displays the current status of a session. Sessions can be either Active or Disconnected.
![]() Session— Displays the ID numbers of active sessions on the server.
Session— Displays the ID numbers of active sessions on the server.
Here is yet another feature that gives DBAs the potential to gain quick insight into a system. Dynamic Management Views (DMVs) were first introduced in SQL Server 2005 to monitor performance and obtain state information on servers and databases without placing a heavy burden on the system from a performance perspective. Because DMVs are lightweight and less intrusive than other monitoring mechanisms, such as SQL Server Profiler and Performance Studio, they can be used to monitor, diagnose, and identify performance issues quickly. There is an extensive number of existing and new DMVs within SQL Server 2008. Some of them are tailored toward monitoring; however, others even provide server state information. From the perspective of SQL Server 2008 internals, Dynamic Management Views and their associated functions are organized into the following categories.
![]() Change Data Capture—related DMVs
Change Data Capture—related DMVs
![]() Query Notifications—related DMVs
Query Notifications—related DMVs
![]() Common Language Runtime—related DMVs
Common Language Runtime—related DMVs
![]() Replication-related DMVs
Replication-related DMVs
![]() Database Mirroring—related DMVs
Database Mirroring—related DMVs
![]() Resource Governor related DMVs
Resource Governor related DMVs
![]() Database-related DMVs
Database-related DMVs
![]() Service Broker—related DMVs
Service Broker—related DMVs
![]() Execution-related DMVs and Functions
Execution-related DMVs and Functions
![]() SQL Server Extended Event related DMVs
SQL Server Extended Event related DMVs
![]() Full-Text Search—related DMVs
Full-Text Search—related DMVs
![]() SQL Server Operating System—related DMVs
SQL Server Operating System—related DMVs
![]() Index-related DMVs and Functions
Index-related DMVs and Functions
![]() Transaction-related DMVs and Functions
Transaction-related DMVs and Functions
![]() I/O-related DMVs and Functions
I/O-related DMVs and Functions
![]() Security-related DMVs
Security-related DMVs
![]() Object-related DMVs and Functions
Object-related DMVs and Functions
To view a DMV, in Object Explorer, expand the Views folder in a given database and then expand the Systems View folder. All DMVs reside in this folder and start with the prefix sys.dm_. The functions associated with a DMV can be found by expanding the master database, Programmability, Functions folder, System Functions, and Table Valued Functions. Unless you are a genius (and we aren’t saying that you are not), it is challenging trying to remember all of the DMVs included in SQL Server 2008. Therefore the following script can be executed to provide a listing of over 100 DMVs that are available.
SELECT * FROM sys.all_objects
WHERE [name] LIKE '%dm_%'
AND [type] IN ('V', 'TF', 'IF')
AND [schema_id] = 4
ORDER BY [name]
As mentioned earlier, not only can DMVs assist you with performance turning and monitoring, but they can also provided detailed information when you need to monitor a SQL Server system. For example, the sys.dm_os_sys_info view can be used to determine the number of logical CPUs in a system, hyperthread ratio between the logical and physical processors, and the amount of physical memory available in the system. Here is the Transact-SQL code that illustrates this example, including the results.
Select cpu_count,
hyperthread_ratio,
physical_memory_in_bytes
From sys.dm_os_sys_info
/*
Results
cpu_count¦hyperthread_ratio ¦physical_memory_in_bytes
1 ¦ 1 ¦ 072447488
Another useful DMV that is applicable at the database scope level is sys.dm_tran_locks. It allows a DBA to obtain information on currently active Lock Manager resources. Locks that have been granted or waiting are displayed.
Here are examples of index-related DMVs that gather information pertaining to index usage information within a database. The sys.dm_db_index_usage_stats view is a great DMV to validate which indexes are not being heavily utilized and which indexes are causing maintenance overhead. The sys.dm_db_missing_index_details DMV returns information about missing indexes. Additional parameters identify the database and the table where the missing index resides.
Reports were introduced in Chapter 2, “Administering the SQL Server 2008 Database Engine.” The predefined standard reports included in SQL Server 2008 are a great way for a DBA to monitor a SQL Server system. These reports provide performance monitoring statistics, resource usage, and consumption at both the server-scope level and the database-scope level.
The predefined standard reports can be displayed by right-clicking a SQL Server instance in Management Studio and selecting Reports and then Standard Reports. The standard reports include
![]() Server Dashboard
Server Dashboard
![]() Configuration Changes History
Configuration Changes History
![]() Schema Changes History
Schema Changes History
![]() Scheduler Health
Scheduler Health
![]() Memory Consumption
Memory Consumption
![]() Activity—All Blocking Transactions
Activity—All Blocking Transactions
![]() Activity—All Cursors
Activity—All Cursors
![]() Activity—Top Cursors
Activity—Top Cursors
![]() Activity—All Sessions
Activity—All Sessions
![]() Activity—Top Sessions
Activity—Top Sessions
![]() Activity—Dormant Sessions
Activity—Dormant Sessions
![]() Activity—Top Connections
Activity—Top Connections
![]() Top Transactions by Age
Top Transactions by Age
![]() Top Transactions by Blocked Transactions Count
Top Transactions by Blocked Transactions Count
![]() Top Transactions by Locks Count
Top Transactions by Locks Count
![]() Performance—Batch Execution Statistics
Performance—Batch Execution Statistics
![]() Performance—Object Execution Statistics
Performance—Object Execution Statistics
![]() Performance—Top Queries by Average CPU Time
Performance—Top Queries by Average CPU Time
![]() Performance—Top Queries by Average IO
Performance—Top Queries by Average IO
![]() Performance—Top Queries by Total CPU Time
Performance—Top Queries by Total CPU Time
![]() Performance—Top Queries by Total I/O
Performance—Top Queries by Total I/O
![]() Server Broker Statistics
Server Broker Statistics
![]() Transaction Log Shipping Status
Transaction Log Shipping Status
The standard report, titled Server Dashboard, is a great overall report that provides an overview of a SQL Server instance, including activity and configuration settings. Actually, all the reports provide strategic value for a DBA when monitoring a SQL Server system, specifically the ones associated with performance. From a monitoring perspective, give them a try and familiarize yourself with the content and output.
In addition, it is also possible to create reports associated to specific databases. This can be achieved by right-clicking a database, selecting Reports, Standard Reports and then the specific report that you want displayed.
The Job Activity Monitor allows the monitoring of all agent jobs for a specific SQL Server instance through the SQL Server Management Studio (SSMS). To view all jobs with the Job Activity Monitor:
1. In Object Explorer, expand SQL Server Agent and then select Job Activity Monitor.
2. Right-click the Job Activity Monitor.
3. Select View Job Activity.
Within the Job Activity Monitor, each job hosted by the SQL Server instance is listed. The columns above the display fields can be used to sort the different jobs. Both the Filter link located in the status pane and the Filter button located at the top of the window can be used to filter the list of agent jobs. If the SQL Server Agent is configured as a Master based on the Multi Server Administration, you will be able to see job activity for other SQL Server instances that are using this SQL Server Agent as a target.
Filter settings can be applied to each of the agent job columns. This capability is helpful when many jobs are listed. To apply a filter to the list of jobs, follow these steps:
1. From within the Job Activity Monitor, click the Filter button or the View Filter Settings link.
2. To configure the filter to show only failed jobs, select Failed from the Last Run Outcome drop-down.
3. When the filter is configured, enable the Apply Filter option near the bottom of the window.
4. Click OK to accept the settings.
Note
The filter icon changes from blue to green when a filter is applied to the list. To remove the filter, simply disable the Apply Filter option from within the Filter Settings dialog box.
The Details pane does not update automatically; however, you can configure it by selecting View Refresh Settings from the Status pane. Note that the refresh interval and the filter settings are not persistent. When the Job Activity Monitor is closed, the settings revert to the defaults.
The jobs shown in the Details pane can also be managed. The context menu allows you to start, stop, enable, disable, delete, and view the job history. You also can access the properties of the job by right-clicking the job and selecting Properties.
SQL Server 2008 keeps several different logs detailing the various processes that take place on the server. All the log files can be viewed through the Log File Viewer.
The SQL Server error logs are the primary logs kept for instances. By default, six archive logs and one active log are kept. A new log file is created each time an instance is started.
Follow these steps to access the SQL Server logs in SQL Server Management Studio:
1. In SQL Server Management Studio’s Object Explorer, expand a SQL Server instance.
2. From within the Object Explorer pane, expand Management, and then expand the SQL Server Logs folder.
3. Double-click a log in order to view it.
You can change the number of SQL error logs kept by right-clicking the SQL Server Logs container in the Object Explorer and selecting Configure. In the Configure SQL Server Error Logs window, enable the option to limit the number of error log files and specify the number of error log files.
The SQL Server 2008 Agent error logs keep track of agent processes that take place on the SQL Server. If a problem with a SQL Server Agent process occurs, these logs should be checked to help determine the cause of the issue.
Nine Agent archive logs and one current log are kept. To access the Agent error logs from within the SSMS, expand the SQL Server Agent container and then expand the Error Logs container. You can configure the Agent error-logging levels by right-clicking on the Error Logs container and selecting Configure. By default, only error and warning messages are enabled. To enable informational logging messages, simply select the check box and click OK. Enabling informational logging may significantly increase the size of the log files.
Note
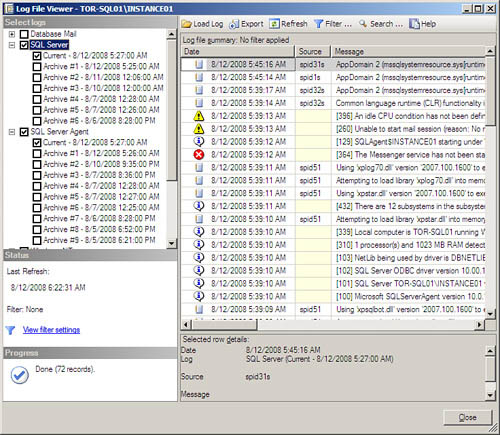
By right-clicking either an Agent or SQL Server error log and selecting View Log, you can open the Log File Viewer. The Log File Viewer allows you to view each log file individually. A powerful feature of the Log File Viewer is to combine the log files, including the Windows event log, into a single view. You can accomplish this by enabling and disabling the logs from the menu pane on the left side of the window. Figure 17.3 shows the current SQL Server logs combined with the current Windows logs.
This concludes the description of the tools and utilities that should be used to gain insight into a SQL Server system. The next portion of the chapter will focus on monitoring changes with SQL Server Audit and Performance Studio.
Auditing has long been a part of corporate America, not to mention the rest of the world. But lately, with investor confidence falling and the economy’s health deteriorating, discussions about auditing have taken center stage. One only has to think about the recent wave of corporate deception involving Fortune companies like Enron and WorldCom to understand why there was so much talk about the future of auditing. The actions of these corrupt corporate entities got the government to take notice and ultimately take back the integrity of the profession of auditing through the introduction of government requirements such as Sarbanes-Oxley (SOX), PCI Compliance, and FDA oversight of data.
With government regulations in place, organizations are now held more accountable for securing and auditing sensitive data. This has resulted in a strong marriage between databases and auditing in SQL Server 2008 as auditing logs are no longer an exception, but a norm today for most companies. Accordingly, SQL Server 2008 incorporates a new auditing solution referred to as SQL Server Audit.
Note
Even if your organization is not governed by some form of regulatory compliance, it is still a best practice to leverage the new Audit object to increase awareness concerning log changes and access to sensitive company data.
By introducing the Audit object and the Audit Specification object, SQL Server 2008 significantly enhances the auditing capabilities compared to previous versions of SQL. It is now possible for organizations to audit all database and server events associated with the Database Engine. This is possible as the new SQL Server Audit object leverages the new Extended Events framework coupled with DDL commands.
In addition, by leveraging the logging improvements in Windows Server 2008 and/or the Audit Collection Services component with System Center Operations Management 2007, organizations can easily centralize and consolidate server and database auditing events across the enterprise, which simplifies compliance, reduces total cost of ownership, and provides rich analysis based on auditing trends. This was inconceivable with the past versions of SQL Server.
With any new SQL Server 2008 feature, it is beneficial to first understand the terminology associated with the components before implementing it. The upcoming sections will further examine the SQL Server Audit components and their associated terminology.
To set up auditing, a DBA first creates a SQL Server Audit object and then specifies the location to which the audited events will be written. Audits can be saved to the Windows Security Log, the Windows Application Log, or to a file on the network infrastructure. The audit destination is also referred to as a target. Creating a SQL Server Audit object can be performed by using SSMS or Transact-SQL. Within a SQL Server instance, it is possible to generate more than one SQL Server Audit object; however, each Server Audit object would have its own audit destination.
In mission-critical environments where security and auditing are a major concern or requirement, it is a best practice to write auditing data to the Windows Security Log. The Windows Application Log is inferior compared to the Windows Security Log as it requests lower permissions and any authenticated user can read or write to and from the log. In addition, files on the network are vulnerable to anyone who has access to the file system. Therefore, the Windows Security Log is the best choice as it offers the highest level of security, making audit data less subject to tampering.
A Server Audit Specification object is associated with a SQL Server Audit object. It defines the server event that will be audited based on a predefined set of SQL Server Audit action types. Examples of Server Audit Action Groups include: Server Permission Change Group, Database Ownership Change Group, and Failed Login Group. There is a plethora of Server Audit action types that a DBA can choose from for auditing a SQL Server instance. Review the topic “Server-Level Audit Action Groups” in SQL Server 2008 Books Online for a full listing of Server-Level Audit Action Groups.
There is a one-to-one mapping between server audit specifications and server audits. Multiple server audit specifications can be created; however, they cannot be bound to the same server audit. Each specification requires its own server audit.
A Database Audit Specification object is also associated with a server audit. It is similar to the Server Audit Specification object. In this case, however, the Database Audit Specification object defines the database event that will be audited based on a predefined set of Database-Level Audit Action Groups. Examples of Database-Level Audit Action Groups include DATABASE_ROLE_MEMBER_CHANGE_GROUP, DATABASE_OPERATION_GROUP, and SCHEMA_OBJECT_CHANGE_GROUP. As with server audit specifications, there are many predefined Database-Level Audit Action Groups that are applicable to a database. In addition, database-level audits can be linked to a specific database action; for example, an event can be raised whenever a SELECT, UPDATE, INSERT, DELETE, EXECUTE, or RECEIVE statement is issued. Review the topic “Database-Level Audit Action Groups and Database-Level Audit Actions” in SQL Server 2008 Books Online for a full listing of Database-Level Audit Action Groups and respective actions.
It should be noted that there is a one-to-one mapping between database audit specifications and server audits. Multiple database audit specifications can be created; however, they cannot be bound to the same server audit. Each specification requires its own server audit.
The implementation of SQL Server Audit is relatively straightforward and involves four steps: The first step involves generating an audit and choosing a target. In the second step, the decision to create either a server audit specification or a database audit specification is required. The final two steps include enabling the audit and then reviewing the captured audit events on a periodic basis. The upcoming section will further examine the SQL Server Audit components and the terminology associated with this four-step installation process.
Before we dive into the step-by-step creation of an Audit object and audit specification with SQL Server Management Studio, let’s first examine an example that captures failed logon attempts on a server via Transact-SQL. The example demonstrates the creation of a SQL Server audit with the target being a file on the file system with Transact-SQL.
The first step in this four-phase process is to create the Audit object. This example creates an audit called TOR-SQL01-Audit, which stores the audit logs to a file residing in a SQLServerAudit folder located on the L: drive. In addition, a queue delay of 1000 is used and maximum and minimum rollover settings are set to unlimited.
/* Create the SQL Server Audit. */
USE [master]
GO
CREATE SERVER AUDIT [TOR-SQL01-Audit]
TO FILE
( FILEPATH = N'L:SQLServerAudit'
,MAXSIZE = 0 MB
,MAX_ROLLOVER_FILES = 2147483647
,RESERVE_DISK_SPACE = OFF
)
WITH
(
QUEUE_DELAY = 1000
,ON_FAILURE = SHUTDOWN
)
GO
Now that the audit has been created, the next step is to enable the audit. This can be done by executing the following Transact-SQL syntax.
The following Transact-SQL syntax illustrates how to create a server audit specification to capture failed logins based on our example.
/* Create the Audit Specification Object. */
USE [master]
GO
CREATE SERVER AUDIT SPECIFICATION
[ServerAuditSpecification-Failed-Login]
FOR SERVER AUDIT [TOR-SQL01-Audit]
ADD (FAILED_LOGIN_GROUP)
GO
The final phase in the process is to view the audit log for any irregularities or suspicious activity. Ironically, this is one of the most critical steps, which is too often overlooked. Before viewing the log, let’s first generate some failed logon attempts on the server. This can be done by selecting File, Connect Object Explorer in SQL Server Management Studio. In the Connect to Server dialog box, ensure that the Server Type is set to the Database Engine, and enter the name of the SQL Server instance that is hosting the audits. Change the authentication to SQL Server Authentication. Enter the SA as the Login, type the incorrect password, and then click Connect. You should receive an Error 18456 message indicating that you cannot connect to the SQL Server because the login failed for user SA. Repeat the login attempt two more times so that a few more audit events are generated.
Follow the steps to review the audit log we generated in Phase 1.
1. In Object Explorer, expand a SQL Server instance, the Security folder, and then the Audits folder.
2. Right-click the audit, TOR-SQL01-Audit, and specify View Audit Logs.
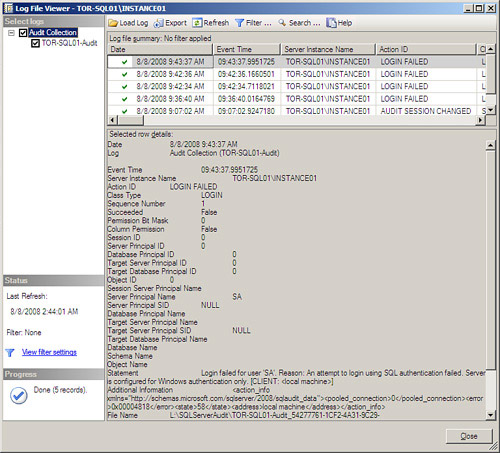
3. The SQL Server Log File Viewer will be invoked as shown in Figure 17.4. Take note of the failed login attempts that were captured based on our audit specification. If you click on an event where the Action ID states LOGIN FAILED, you will be able to review addition details such as time, audit collection name, user account, and so on.
4. Click Close when you have finished reviewing the log.
As mentioned earlier, the first step to monitoring changes on a SQL Server instance or database is to create the SQL Server Audit object. Follow these steps to create a SQL Server Audit object with SQL Server Management Studio:
1. In Object Explorer, expand a SQL Server instance, expand the Security folder, and then select the Audit folder.
2. Right-click the Audit folder and select New Audit, which will invoke the Create Audit dialog box, as illustrated in Figure 17.5.
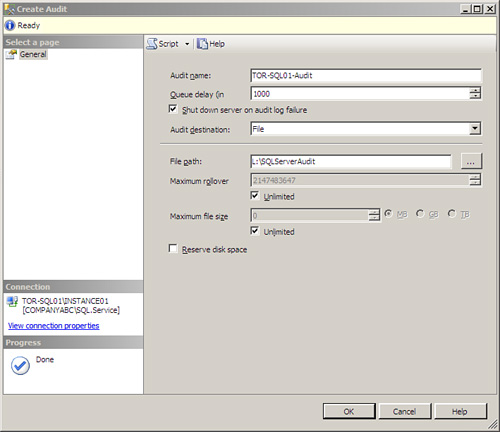
3. On the General tab in the Create Audit dialog box, first specify a name for the audit in the Audit Name field.
4. Either maintain the Queue Delay default setting or enter a value in milliseconds between 0 and 2,147,483,647. The queue delay indicates the quantity of time that can elapse before audits are forced to be committed. The value of 0 indicates synchronous delivery.
5. Next, enable or disable the Shut Down Server on Audit Log Failure option. When enabled, this setting forces the server to shut down if a SQL Server instance cannot successfully write audit events to a specified target. This setting is typically enabled for organizations dealing with strict auditing requirements.
Tip
Let’s take a moment to understand the ramifications of enabling the Shut Down Server on Audit Log Failure option. When an event captured by the audit cannot be successfully written, the server will shut down. If this SQL Server instance is a mission-critical production server, a major outage will result and will continue to negatively impact the organization and users until the auditing functionality is fixed. So tread carefully when making the decision to use this option, as your decision will impact either security or functionality.
6. The next step includes selecting a destination for the audit from the predefined options in the Audit Destination drop-down box. The options include File, Security Log, and Application Log. Choose the appropriate destination.
7. If a file destination is selected, specify the additional options for the file based on the settings in the following list. If either the Security Log or Application Log was selected, the additional File options are grayed out, so click OK to finalize the creation of the new audit. The additional File settings in the Create Audit dialog box consist of the following:
![]() File Path— Indicates the location of the file to which audit data will be written.
File Path— Indicates the location of the file to which audit data will be written.
![]() Maximum Rollover— Controls how many audit files should be maintained within the file system. The default option is set to Unlimited. This means that files will not be overwritten. A file restriction can be imposed by entering a number that represents the maximum number of files that can be maintained. The maximum number is 2,147,483,647.
Maximum Rollover— Controls how many audit files should be maintained within the file system. The default option is set to Unlimited. This means that files will not be overwritten. A file restriction can be imposed by entering a number that represents the maximum number of files that can be maintained. The maximum number is 2,147,483,647.
![]() Maximum File Size— The maximum size of an audit file can be 2,147,483,647 terabytes, which is the default setting. Alternatively, you can specify a size between 1024KB and 2,147,483,647TB.
Maximum File Size— The maximum size of an audit file can be 2,147,483,647 terabytes, which is the default setting. Alternatively, you can specify a size between 1024KB and 2,147,483,647TB.
![]() Reserve Disk Space— The final option, Reserve Disk Space, guarantees that the maximum size allocated to the file in the previous setting is preallocated to the file system.
Reserve Disk Space— The final option, Reserve Disk Space, guarantees that the maximum size allocated to the file in the previous setting is preallocated to the file system.
The next step in the process is to enable the newly created audit. This can be done by expanding the Audits folder in Object Explorer, right-clicking the new audit, and then selecting Enable Audit. A red down arrow on the audit represents Disabled.
As mentioned earlier in the four-step example, after the SQL Server audit has been created and enabled, the next phase is to create the actual server audit specification. The following steps illustrate the creation of the server audit specification, which will monitor failed logins using SQL Server Management Studio.
1. In SQL Server Management Studio, connect to the Database Engine.
2. In Object Explorer, expand a SQL Server instance, expand the Security folder, and then select the Server Audit Specifications folder.
3. Right-click the Server Audit Specifications folder and select New Server Audit Specification to invoke the Create Server Audit Specification dialog box, as illustrated in Figure 17.6.
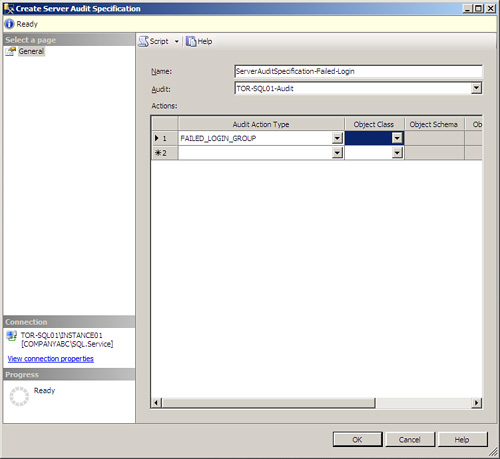
4. On the General page in the Create Audit dialog box, first specify a name for the audit in the Name text box.
5. Select an audit from the drop-down list. An audit must already exist prior to this step.
6. In the Actions section, specify the desired server-level Audit Action Type from the drop-down list, such as FAILED_LOGIN_GROUP.
7. Click OK to finalize the creation of the Server Audit Specification.
8. Similar to the Audit Specification, the Server Audit Specification needs to be enabled by right-clicking the new Server Audit Specification and then selecting Enable Server Audit Specification.
9. When the logon attempt fails, close the dialog box and proceed to the steps in the following section, “Viewing an Audit Log.”
After the audit and audit specification have been established, take the following steps to review an audit log within SQL Server Management Studio. This is the fourth and final step in the process:
1. In Object Explorer, expand a SQL Server instance, the Security folder, and then the Audits folder.
2. Right-click the audit for which you plan on reviewing the associated logs, and select View Audit Logs.
3. The SQL Server Log File Viewer will be invoked. Take note of the audit events of interest, then click Close.
Instead of creating a server database audit specification, a DBA may choose to create an audit specification that is applicable to a user or system database. If a database audit specification is created, the Database Action Group will collect data on all databases within the SQL Server instance. On the other hand, if you want to audit only one database, that is possible by generating a database audit specification and applying it to one specific database.
When working with database audit specifications, a DBA must still create the Server Audit object and enable it as a prerequisite task. The following steps demonstrate the creation of the database audit specification using TSQL, which will monitor SELECT and INSERT statements on the AdventureWorks database.
— STEP 1, Create the SQL Server audit
USE [master]
GO
CREATE SERVER AUDIT [AdventureWorks-Person-Password-Audit]
TO FILE
( FILEPATH = N'L:SQLServerAudit'
,MAXSIZE = 0 MB
,MAX_ROLLOVER_FILES = 2147483647
,RESERVE_DISK_SPACE = OFF
)
WITH
(
QUEUE_DELAY = 1000
,ON_FAILURE = SHUTDOWN
)
GO
— STEP 2, Enable the SQL Server audit
ALTER SERVER AUDIT [AdventureWorks-Person-Password-Audit]
WITH (STATE = ON) ;
GO
— STEP3 Create the Database Audit
Specification on the AdventureWorks2008
USE AdventureWorks2008
GO
CREATE DATABASE AUDIT SPECIFICATION [Audit-Person-Password-Table]
FOR SERVER AUDIT [AdventureWorks-Person-Password-Audit]
ADD (SELECT , INSERT
ON Person.Password BY dbo )
WITH (STATE = ON)
GO
Let’s generate a few audit events by running the following SELECT statements against the Person.Password table.
Use AdventureWorks2008
Select *
From Person.Password
Go
Now open the AdventureWorks-Person-Password-Audit log file by right-clicking the Audit folder in Object Explorer and choosing View Audit Logs. Notice how the SELECT statements against the Person.Password table have been captured in the log based on the ActiveID SELECT. The details of the log entry show the Session Server Principal Name and the Server Principal Name including the user SID who accessed the table based on the SELECT statement.
The next few sections include tasks associated with managing audits and audit specifications.
Compared to other locations, the Windows Server 2008 Security log is the best place to record audit object access, as it is the least likely to be tampered with. When using the Windows Server 2008 Security log as a Audit target, two tasks must be initiated as prerequisites. First the Audit Object Access setting must be configured on the Windows Server 2008 system in order to allow audit events to be recorded. Second, the account used to generate audit events to the Security log, which is the SQL Server Agent, must be granted the Generate Security Audits permissions.
The following example illustrates how to conduct the first step by enabling Audit Object Access on a SQL Server 2008 system running Windows Server 2008.
1. Log on to a Windows Server 2008 system with administrative permissions.
2. Launch a command prompt with administrative privileges. This is achieved by choosing Start, All Programs, Accessories, right-clicking the Command Prompt, and then selecting Run as Administrator.
3. Execute the following code from the command prompt.
auditpol /set /subcategory:"application generated"
/success:enable /failure:enable
4. Close down the command prompt. Note that the setting takes place immediately.
The next step is to open up the local security policy on the Windows Server 2008 system that will be hosting the SQL Server Audit object and grant the account associated with the SQL Server Agent permission to record data to the Security Log. This can be accomplished by conducting the following steps:
1. Log on to a Windows Server 2008 system with administrative permissions.
2. Click Start, Run, type secpol.msc, and then click OK to invoke the Windows Server 2008 Local Security Policy.
3. In the Local Security Policy screen, first expand the Local Policies folder and then the User Rights Assignment.
4. In the right-hand pane, double-click on Generate Security Audits.
5. In the Generate Security Audits Properties dialog box, click Add User or Group.
6. In the Select Users, Computers or Groups dialog box, enter the name of the security account of the SQL Server Agent, and then click OK.
7. Click Apply and then close the Local Security Policy tool.
8. Restart the SQL Server and SQL Server Agent Service.
Note
When more than one Windows Server 2008 Security Log is being used to capture audits, a Windows Server 2008 Active Directory Group Policy can be used to automatically grant and enforce the SQL Server Agent Account the appropriate permissions on the Security.. It is a best practice to first create an Organizational Unit in Active Directory, place the desired SQL Server computers within the Organizational Unit, create the Group Policy, and then link the Group Policy to the Organizational Unit where the SQL Server computers reside.
A new function can be leveraged to view security events associated with an audit file residing on a SQL Server system. Here is the default syntax:
fn_get_audit_file ( file_pattern,
{default ¦ initial_file_name ¦ NULL },
{default ¦ audit_file_offset ¦ NULL } )
The DBA will need to specify the directory and path to the actual filename that needs to be viewed. Here is an example based on the audit file Payrole_Security_Audit, which was created in the steps earlier in the chapter.
Select * From fn_get_audit_file
('L:SQLServerAudit*',null,null)
Using SQL Server Management Studio, right-click on an audit, click Server Audit Specification and/or Database Audit Specification, and select Delete. It would be best to first delete the audit specification and then the audit associated with the audit specification. The drop can also be achieved with Transact-SQL. Here are the three basic syntaxes.
Performance Studio is a new integrated framework introduced in SQL Server 2008 for performance monitoring and troubleshooting. Performance Studio is involved in the collection of performance and diagnostic data from one or more SQL Server systems. The captured data is stored in a centralized management data warehouse (MDW). With the information yielded, DBAs are able to proactively analyze, troubleshoot, and monitor SQL Server as a result of the trends and historical knowledge they gain from just firing intuitive reports against a SQL Server system in question.
The outlook on Performance Studio is very promising, and the tool would be faultless if it weren’t for one issue; Performance Studio only captures performance and diagnostic data for SQL Server 2008 systems, specifically the Database Engine. Not to worry, though, as future releases will focus on the other SQL Server components and features such as Reporting Services and Analysis Services.
Note
So as not to get confused when reviewing other books or online materials, readers should remember that Performance Studio is synonymous with Data Collector. They are the same tool.
The Performance Studio infrastructure is based on a simple framework involving a few new components:
![]() Data provider— Sources of performance or diagnostic information.
Data provider— Sources of performance or diagnostic information.
![]() Collector type— A logical wrapper that recognizes how to leverage, obtain, and expose data from a specific data provider. Examples include Generic T-SQL Query Collector Type, Query Activity Collector Type, and Performance Counters Collector Types.
Collector type— A logical wrapper that recognizes how to leverage, obtain, and expose data from a specific data provider. Examples include Generic T-SQL Query Collector Type, Query Activity Collector Type, and Performance Counters Collector Types.
![]() Collection item— A collection item is an example of a collector type that defines the items to be collected in a collection set. When defining collection items, a name, collector type, and collection frequency must be established as a collection item cannot exist on its own.
Collection item— A collection item is an example of a collector type that defines the items to be collected in a collection set. When defining collection items, a name, collector type, and collection frequency must be established as a collection item cannot exist on its own.
![]() Collection set— A logical unit of data collection items associated with a SQL Server instance.
Collection set— A logical unit of data collection items associated with a SQL Server instance.
![]() Collection mode— Indicates how data will be collected, stored, and uploaded to the management data warehouse. The options include Non-Cached and Cached modes.
Collection mode— Indicates how data will be collected, stored, and uploaded to the management data warehouse. The options include Non-Cached and Cached modes.
![]() Management data warehouse— A relational database that acts as a repository for maintaining all historical data captured via Performance Studio.
Management data warehouse— A relational database that acts as a repository for maintaining all historical data captured via Performance Studio.
A data collector is installed by default on each SQL Server instance. After a collection set is established on a target, performance data and diagnostic information will upload on demand or based on a specified time interval to the management data warehouse as a result of a series of jobs executed by the SQL Server Agent. Also, depending on the collection set, some data may be cached on the SQL Server instance before it’s uploaded. After the data is captured and consolidated within the management data warehouse, reports can be generated based on a specific collection set.
The first step in conducting a Performance Studio implementation is creating and establishing the management data warehouse. Even though performance monitoring and diagnostic data is captured with minimal overhead, it is a best practice to implement the management data warehouse on a dedicated SQL Server system especially if more than one SQL Server instance target is anticipated. In return, Performance Studio will not skew the performance numbers as a result of additional performance overhead from the data collector when data is being captured and analyzed from a SQL Server system.
By default, data from a target is uploaded to the MDW every 15 minutes. This event screams a potential performance bottleneck if there are hundreds of instances uploading data to the same MDW. To avoid this situation, it is a best practice to stagnate the start time of the upload process when working with multiple instances; therefore, an MDW bottleneck will be alleviated because data is being uploaded at a distributed rate.
The space requirement for a system collection set is approximately 200 to 500 megabytes per day. Consider these numbers seriously when creating and allocating space for the MDW. It also makes sense to ensure that the recovery model is set to Simple to minimize excessive log growth. However, maintain the Full recovery model if there is a need to restore the database to the point of failure.
Tip
When creating customized collection sets, it is a best practice to test the amount of data captured in a dedicated prototype lab before going live in production. By simulating a production workload in the lab, the DBA will be able to accurately size the MDW and interpret the stress on the system. Performance may degrade and storage costs may increase when implementing a number of collection sets with a large number of services and performance counters being captured.
Follow these steps to implement the management data warehouse with SQL Server Management Studio:
1. Launch SQL Server Management Studio and then connect to a SQL Server Database Engine instance that you plan on using as the management data warehouse.
2. In Object Explorer, expand a SQL Server instance, expand the Management Folder, and then select the Data Collection node.
3. Right-click the Data Collection node and then select Configure Management Data Warehouse.
4. Click Next in the Welcome to the Configure Management Data Warehouse Wizard.
5. On the Select Configuration Task page, select the option Create or Upgrade a Management Data Warehouse, and then click Next.
6. On the next page, select a server and database to host the management data warehouse. If the database does not already exist, click New to manually generate a new management data warehouse database. Click Next to continue.
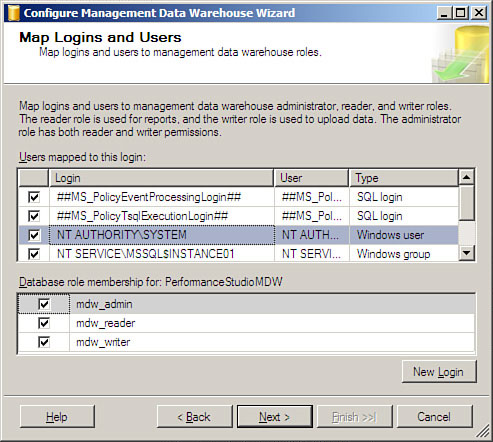
7. The next page, Map Logins and Users, is used for mapping logins and users to the predefined management data warehouse roles. If the desired login is not displayed, click New Login and add the account. The management data warehouse roles that need to be mapped to a login include mdw_admin, mdw_reader, and mdw_writer. After all logins are added and mapped to the management data warehouse roles, click Next, as displayed in Figure 17.7.
![]()
mdw_admin— Ultimately this role is the superuser role associated with management data warehouse as members of this role have read, write, and delete access to the MDW. Members can also modify the schema and run maintenance jobs.
![]()
mdw_reader— Similar to write permissions with a database, members of this role can upload and write data to the MDW; however, they cannot read the data.
![]()
mdw_writer— This group can strictly read data in the MDW and that’s it.
8. Review the management data warehouse configuration settings in the Complete the Wizard page, and then click Finish.
9. The final page will indicate the status of the installation. Verify that all actions were successful and then click Close.
10. When the wizard is complete, connect to the same SQL Server instance and ensure that the new management data warehouse database exists in Object Explorer. In addition, ensure that the database recovery model is set to Simple.
A simple review of the MDW database will show that the database objects are grouped together based on three schemas. The Core schema represents objects associated with collected data. The Snapshot schema is used for storing system collected data sets, which are included with SQL Server 2008 and the Custom Snapshot schema is used when adding new data types for out-of-the-box data collector types or for third-party collector types for user-defined collector sets.
Now that the management data warehouse is created and initialized, the next step is to set up a data collection on one or more SQL Server instances.
1. Launch SQL Server Management Studio and then connect to a SQL Server Database Engine instance that you plan on collecting data from.
2. In Object Explorer, expand a SQL Server instance, expand the Management Folder, and then select the Data Collection node.
3. Right-click the Data Collection node and then select Configure Management Data Warehouse.
4. Click Next in the Welcome to the Configure Management Data Warehouse Wizard.
5. On the Select Configuration Task page, select the option Set Up Data Collection to configure this SQL Server instance, which will start collecting data for an existing management data warehouse. Click Next to continue.
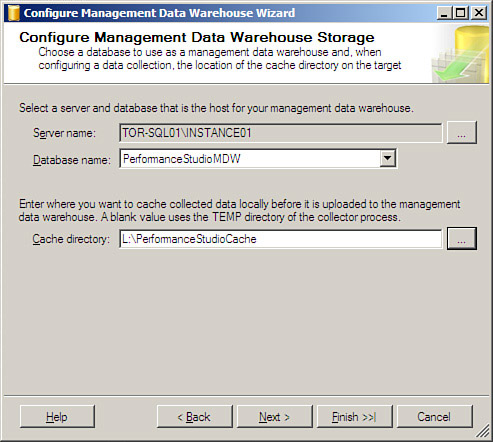
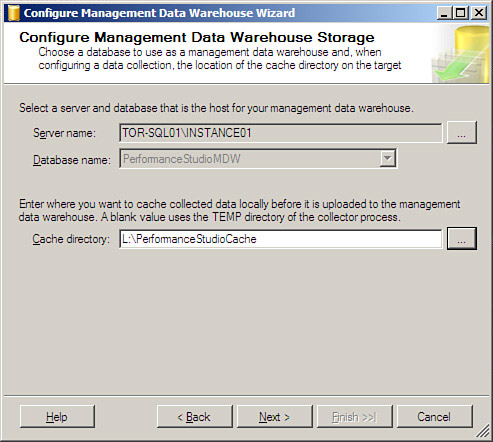
6. Ensure that the names of the SQL Server instance and management data warehouse hosting the management data warehouse are accurate. Then specify the cache directory that will store collected data before it is updated to the management data warehouse. The TEMP directory of the collector process will be used automatically if these settings are left blank. Click Next as displayed in Figure 17.8.
7. Review the management data warehouse configuration settings on the Complete the Wizard page, and then click Finish.
8. The final page should communicate the following: the appropriate management data warehouse is selected, the collection sets are started, and the data collection is enabled. Click Close when all actions are completed successfully.
9. Expand the System Data Collection Sets folder under the Data Collection node in Object Explorer to see the newly created system data collection sets.
Based on the SQL Server 2008 RTM release in August of 2008, Microsoft included three built-in system data collection sets, which are installed when a data collection is set up on a SQL Server instance. Each of these built-in collection sets also includes Collection Set Reports.
Microsoft plans on releasing many more predefined collection sets; however, this will most likely occur only with future releases or new service packs. The new data collection sets will also focus on gathering performance metrics on other components such as Analysis Services and Reporting Services.
Each data collection set included with SQL Server 2008 is explained in the following sections:
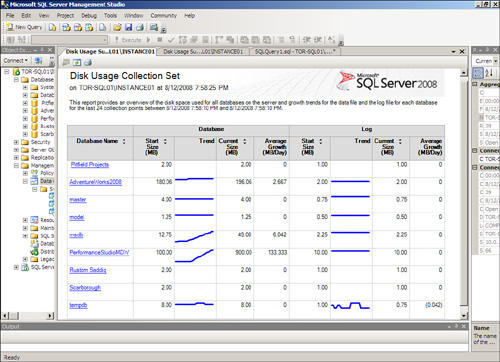
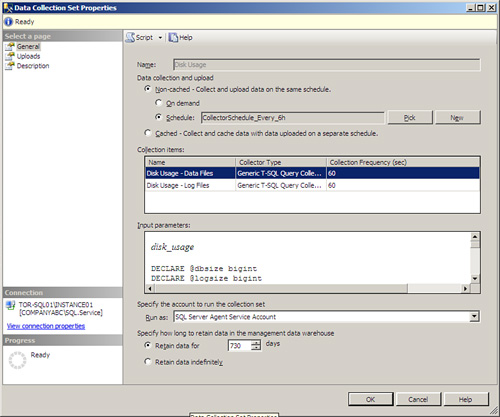
![]() Disk Usage System Data collection set— The Disk Usage System Data collection set, as illustrated in Figure 17.9, captures data files and log files of disk usage performance data associated with SQL Server 2008 relational databases via the Generic T-SQL Query Collection collector type. Also, the disk usage data uploads to the MDW every six hours where it is then retained for 90 days. After the data is collected it is stored in MDW tables under the snapshot schemas
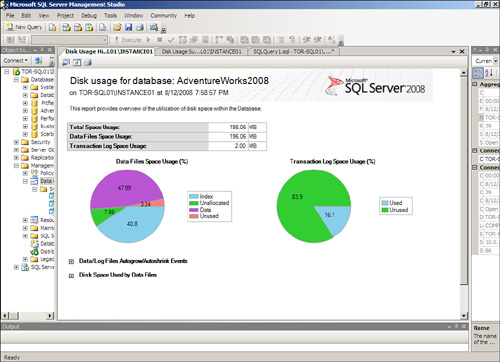
Disk Usage System Data collection set— The Disk Usage System Data collection set, as illustrated in Figure 17.9, captures data files and log files of disk usage performance data associated with SQL Server 2008 relational databases via the Generic T-SQL Query Collection collector type. Also, the disk usage data uploads to the MDW every six hours where it is then retained for 90 days. After the data is collected it is stored in MDW tables under the snapshot schemas Snapshots.disk_usage and Snapshots.log_usage. Performance counters for free drive space are also captured. Additional performance data associated with a database can be obtained if you double-click on a database. This is presented in Figure 17.10.
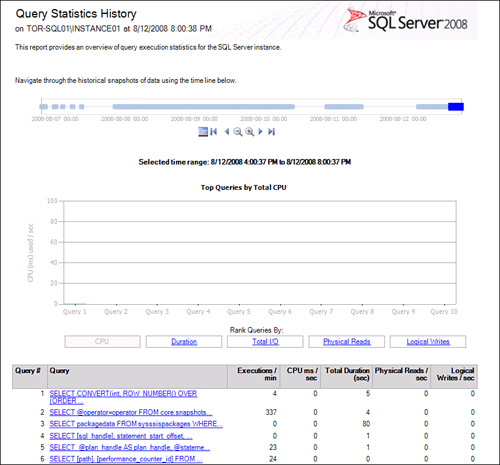
![]() Query Statistics System Data collection set— The Query Statistics Data collection set captures performance data that allows DBAs to analyze and identify “interesting” queries along with query plans that have been altered without conducting a full server-side profiler trace. Server-side traces are typically costly transactions that degrade system performance. The Properties page associated with the Query Statistics System Data collection set is illustrated in Figure 17.11. By leveraging the
Query Statistics System Data collection set— The Query Statistics Data collection set captures performance data that allows DBAs to analyze and identify “interesting” queries along with query plans that have been altered without conducting a full server-side profiler trace. Server-side traces are typically costly transactions that degrade system performance. The Properties page associated with the Query Statistics System Data collection set is illustrated in Figure 17.11. By leveraging the dm_exec_query_stats DMV, troublesome queries can be identified because snapshot plan caches are being captured on a periodic basis. By comparing query stats against previous snapshots, the top most interesting queries can be identified. When data is captured it is stored in the snapshots.query_stats, snapshots.notable_query_text, and snapshots.notable_query_plan tables.
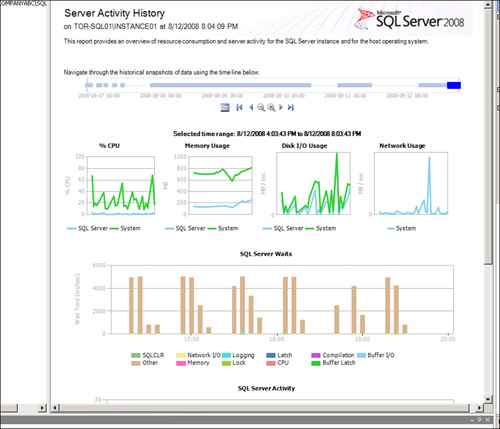
![]() Server Activity Data collection set— This is another data collection set included out of the box that collects performance data on active sessions and requests, memory, performance counters, schedules, and wait statistics. The data associated with this collection is captured every 10 to 60 seconds, cached on the local system, and uploaded every 15 minutes. The Server History Data Collection report can be seen in Figure 17.12.
Server Activity Data collection set— This is another data collection set included out of the box that collects performance data on active sessions and requests, memory, performance counters, schedules, and wait statistics. The data associated with this collection is captured every 10 to 60 seconds, cached on the local system, and uploaded every 15 minutes. The Server History Data Collection report can be seen in Figure 17.12.
It is possible to manage the properties associated with a data collection set by right-clicking a data collection set in Object Explorer and then selecting Properties. Examples of built-in system data collection sets in SQL Server 2008 include: Disk Usage Collection Set, Query Activity Collection Set, and Server Activity Collection Set. Each of these collection sets can be managed.
The Data Collection Set Properties dialog box has a total of three pages. The settings in many sections on these pages are customizable. Become familiar with these pages by reading the next section.
The General page is broken down into the following sections as depicted in Figure 17.13.
![]() Name— This text box is self-explanatory; it displays the name of the data collection set.
Name— This text box is self-explanatory; it displays the name of the data collection set.
![]() Data Collection and Upload— The two options available in this section include Non-Cached and Cached mode. These options dictate how data is collected and uploaded to the management data warehouse. The Non-Cached mode is the default option involved in collecting performance data based on a scheduled interval. Alternatively, non-cached data is collected and uploaded on demand. The second option, known as Cached mode, collects performance data at collection frequencies and then uploads the data based on a separate schedule.
Data Collection and Upload— The two options available in this section include Non-Cached and Cached mode. These options dictate how data is collected and uploaded to the management data warehouse. The Non-Cached mode is the default option involved in collecting performance data based on a scheduled interval. Alternatively, non-cached data is collected and uploaded on demand. The second option, known as Cached mode, collects performance data at collection frequencies and then uploads the data based on a separate schedule.
![]() Collection Items— The next section located on the general page is Collection Items. A DBA can review the collected items including names, category type, and collection frequency in seconds. For example, performance data associated with Disk Files or Log Files disk usage can be collected based on the Generic T-SQL Collector type every 60 seconds.
Collection Items— The next section located on the general page is Collection Items. A DBA can review the collected items including names, category type, and collection frequency in seconds. For example, performance data associated with Disk Files or Log Files disk usage can be collected based on the Generic T-SQL Collector type every 60 seconds.
Note
The Collection frequency time interval can be modified only if the Data Collection and Upload setting is configured as Cached.
![]() Input Parameters— This section presents the input parameters used for the collection set based on Transact-SQL.
Input Parameters— This section presents the input parameters used for the collection set based on Transact-SQL.
![]() Specify the Account to Run the Collection Set— This setting indicates the account used to run the collection set. The SQL Server Agent account is the default account; however, if proxy accounts are configured and available, there is the option to select an account from the drop-down list.
Specify the Account to Run the Collection Set— This setting indicates the account used to run the collection set. The SQL Server Agent account is the default account; however, if proxy accounts are configured and available, there is the option to select an account from the drop-down list.
![]() Specify How Long to Retain Data in the Management Warehouse— The final setting indicates how long performance data that is based on a collection should be retained in the management data warehouse. Of course, DBAs can change the frequency by specifying a new value or selecting the option to retain data indefinitely.
Specify How Long to Retain Data in the Management Warehouse— The final setting indicates how long performance data that is based on a collection should be retained in the management data warehouse. Of course, DBAs can change the frequency by specifying a new value or selecting the option to retain data indefinitely.
The Data Collection Set Uploads page is used for viewing or setting upload schedules for collected data. Settings are only displayed and cannot be changed unless the Cached option is configured on the General tab for Data Collection and Uploaded. The settings and information include the Server hosting the management data warehouse, the MDW name being written to, the time associated with the last upload, and the upload schedule.
The final page in the Data Collection Set Properties dialog box is the Description Page. Here you can view detailed description for the data collection set. For example, the detailed description for the Server Activity Data Collection Set gathers top-level performance indicators for the computer and the Database Engine. DBAs can benefit from this page by conducting an analysis on resource use, resource bottlenecks, and Database Engine activity.
When viewing collection set logs, a DBA has two choices: either review logs associated with all the collection sets, or drill down on a specific collection set and view just one log file. Follow these steps to review the logs associated with all of the collection sets.
1. Launch SQL Server Management Studio, and then connect to a SQL Server Database Engine instance for which you plan to view the collection set’s logs.
2. In Object Explorer, expand a SQL Server instance, expand the Management folder, and then select the Data Collection node.
3. Right-click the Data Collection node and then select View Logs.
If there is a need to capture performance data from one or more SQL Server instances, the best practice is to use one MDW within the SQL Server infrastructure. Again, ensure that the MDW can support the workload based on the number of instances recording performance data to the MDW.
Follow these steps to implement a data collection on a SQL Server instance that is not hosting the MDW. For this example, our MDW is residing on TOR-SQL01Instance01 and a data collection will be configured on TOR-SQL01Instance02 to record performance data to the MDW residing on TOR-SQL01Instance01.
1. Launch SQL Server Management Studio, and then connect to a SQL Server Database Engine instance for which you plan on setting up a data collection (TOR-SQL01Instance02).
2. In Object Explorer, expand a SQL Server instance (TOR-SQL01Instance02), expand the Management folder, and then select the Data Collection node. This SQL Server instance should not be hosting the MDW database.
3. Right-click the Data Collection node and then select Configure Management Data Warehouse.
4. Click Next in the Welcome to the Configure Management Data Warehouse Wizard.
5. On the Select Configuration Task page, select the option Set Up Data Collection, and then click Next.
6. On the subsequent page, specify a SQL Server instance that is already hosting the MDW, such as TOR-SQL01Instance01. Next, specify the database name of the MDW and the Cache directory and then click Next, as shown in Figure 17.14.
7. Verify the configuration on the Complete the Wizard page, and then click Finish.
8. The final page will indicate the status of the installation. Verify that all actions were successful, and then click Close.
9. Repeat steps 1 through 8 on all SQL Server instances for which you want to capture performance monitoring data.
Each built-in data collection set includes intuitive reports that should be leveraged for analyzing trends and diagnostics. To generate a report, conduct the following steps:
1. In Object Explorer, expand a SQL Server instance, expand the Management folder, and then select the Data Collection node.
2. Right-click the Data Collection node, select Reports, Management Data Warehouse, and then select a report to preview like Disk Usage Summary, which was displayed in Figure 17.9.
Being proactive by obtaining alerts via email is another form of monitoring within SQL Server 2008. To send and receive alerts, a DBA must first configure the Database Mail feature, define an operator, and then create an alert and bind it to an operator. The upcoming sections will depict this process.
The mail delivery architecture in SQL Server 2008 is very similar to Database Mail in SQL Server 2005; However, it is significantly different compared to SQL Server 2000 and previous versions. Although the legacy SQL Mail functionality is still available for backward compatibility, its use is not encouraged. In addition, it is not supported on 64-bit editions of SQL Server 2008.
Database Mail in SQL Server 2008 continues to offer mail functionality without the installation of a MAPI client such as Outlook on the server just to send email. Email continues to be sent using standard Simple Mail Transfer Protocol (SMTP). This also means that one or more available SMTP servers in the organization can be used to relay mail, which could include an existing Exchange Server 2007 running either the Hub Transport or Edge role.
To use the new Database Mail feature, the user must be part of the DatabaseMailUserRole role in the MSDB database. This role allows the execution of the sp_send_dbmail stored procedure.
After installing and configuring the SMTP server, follow these steps to configure Database Mail for a SQL Server instance:
1. In Object Explorer, expand a SQL Server instance and then the Management folder. Database Mail should be listed.
2. Right-click Database Mail and select Configure Database Mail.
3. On the Welcome page, click Next.
4. Select the Set Up Database Mail option and click Next.
5. If prompted, click Yes to enable Database Mail.
6. Type Email Notification in the Profile Name field.
Note
If the Database Mail feature is not available, a message will be displayed. Click Yes to enable the Database Mail feature.
The next step is to establish a Database Mail account, which is simply a list of SMTP servers used to send the email.
Multiple Database Mail accounts can be used. When email is sent, each mail account is tried in order until one of them is successful. When the email is successfully sent through an account, that account is used for subsequent email delivery until it becomes unavailable.
Each account can be configured with a different authentication, depending on the requirements of the environment. Follow these steps to add the Database Mail account:
1. Still on the New Profile page, click the Add button to open the New Database Mail Account page.
2. Type Local SMTP in the Account Name field.
3. Type an email address such as [email protected] for the Email Address field.
4. Type a display name such as Email Notification in the Display Name field.
5. The Server Name field must be populated with the name of your SMTP server. For this example, type TOR-HB01.companyabc.com in the Server Name field.
6. Select the type of SMTP authentication to use, such as Windows Authentication using Database Engine Service Credentials, Basic Authentication, or Anonymous Authentication. The setting selected will be based on the relay security associated with the SMTP server.
7. Click OK and then click Next.
Figure 17.15 shows how the New Database Mail Account page should look. You can add additional accounts using the same procedure.
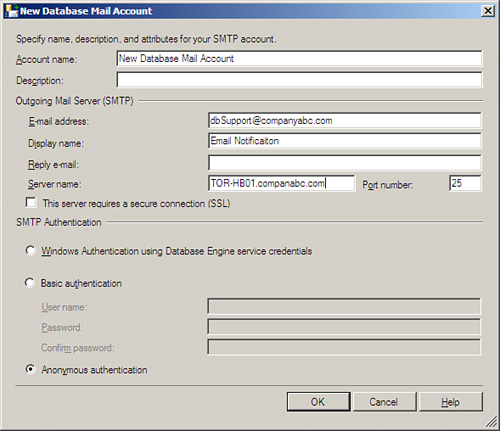
On the Manage Profile Security page, you can configure the profile as public or private. Public profiles can be used by any user in the DatabaseMailUserRole role, whereas private profiles can be used only by specific database users. The profile can also be configured as the default profile.
To continue using the wizard, enable the Email Notification Profile by checking the Public check box and then click Next.
On the Configure System Parameters page, you can configure the setting that controls how Database Mail operates. For example, to configure the system to retry delivery if an error is experienced, set the Account Retry Attempts and Account Retry Delay (Seconds) options.
To continue the wizard, accept the default values and click Next. Click Finish to complete the wizard and execute the defined configuration.
Tip
From a security perspective, it is a best practice to use a dedicated SMTP server within the infrastructure and not the SQL Server system. Adding the IIS and SMTP roles on a SQL Server system increases the surface area of attack. On systems that are running Exchange Server 2007, relaying can be achieved on an Exchange Server system running the Hub Transport or Edge Transport role.
To test the email delivery and validate that email is working correctly, follow these steps from within SSMS:
1. Right-click Database Mail.
2. Select Send Test E-Mail.
3. Select Email Notification as the profile.
4. Enter an email address in the To field.
5. Click Send Test E-mail and then click OK.
The Database Mail log can be used to validate that the email was sent from the SQL Server to the SMTP server. To view the log, right-click the Database Mail container and select View Database Mail Log from the menu.
The following stored procedures can be used to configure Database Mail using the data definition language (DDL):
![]()
sysmail_add_account_sp
![]()
sysmail_add_profile_sp
![]()
sysmail_add_profileaccount_sp
![]()
sysmail_add_principalprofile_sp
![]()
sp_send_dbmail
For example, you can now use the following code to send an email notification:
EXEC msdb.dbo.sp_send_dbmail @recipients='[email protected]',
@profile_name = 'Email Notification',
@subject = 'Test Email Notification',
@body = 'Email message from TOR-SQL01INSTANCE01',
@body_format = 'HTML';
An operator is a user or a group that receives notifications. Notifications can include email, pagers, and net send. The schedule of the operator can also be configured; for example, an operator can be defined to receive notification during business hours, and a different operator can be defined to use notifications during nonbusiness hours or on the weekend.
From within SSMS, you can define new operators. To add a new operator to the SQL Server instance, follow these steps:
1. From within SQL Server Management Studio, expand SQL Server Agent.
2. Right-click Operators and select New Operator.
3. Enter the name of the operator in the field provided.
4. Enter the email address in the Email Name field.
5. Enable a suitable schedule for the operator, for example, from 8 a.m. to 9 p.m. Monday through Friday.
6. Click OK.
You can use the Notification section of the New Operator page to enable notifications for existing alerts on the server.
Alerts can be defined for a wide range of SQL Server events. You can receive alerts on the following types of events:
![]() SQL Server events
SQL Server events
![]() SQL Server performance conditions
SQL Server performance conditions
![]() WMI events
WMI events
Follow these steps to generate an alert when the used log file space falls below 100MB in the AdventureWorks2008 database:
1. Expand the SQL Server Agent in Object Explorer.
2. Right-click Alerts and select New Alert.
3. In the Name field, type AW Log Files Used Size.
4. Select SQL Server Performance Condition Alert from the Type drop-down.
5. Select MSSQL$INSTANCE01:Databases for the object. The first part of the object corresponds to the instance name; if the SQL Server was installed as the default instance, the object name is SQLServer:Databases.
6. Select Log File(s) Used Size (KB) for the counter.
7. Select AdventureWorks for the instance.
8. Select Falls Below for the alert condition.
9. Enter 102400 for the value.
You can also define a response to an alert. Responses can include executing a job or notifying an operator. The following steps demonstrate how to add an operator to the previously created alert:
1. In the New Alert window, select the Response option page.
2. Enable the Notify Operators option.
3. Enable the Email column for the operator created earlier.
4. Click OK to finish creating the alert.
You can use the Options page of the new alert to specify whether the error text is included in the different types of alerts.
Performance is a basis for measuring how fast application and system tasks are completed on a computer, and reliability is a basis for measuring system operation. How reliable a system is will be based on whether or not it regularly operates at the level at which it was designed to perform. Based on these descriptions, it should be easy to recognize that performance and reliability monitoring are crucial aspects in the overall availability and health of a SQL Server system running on Windows Server 2008. To ensure maximum uptime, a well-thought-through process needs to be put in place to monitor, identify, diagnose, and analyze system performance. This process should invariably provide a means for quickly comparing system performances at varying instances in time and detecting and potentially preventing a catastrophic incident before it causes system downtime.
The Reliability and Performance Monitor, which is a Microsoft Management Console (MMC) snap-in on Windows Server 2008, provides a myriad of new tools for DBAs so they can conduct real-time SQL Server system monitoring, examine system resources, collect performance data, and create performance reports from a single console. This tool is literally a combination of three legacy Windows server monitoring tools: System Monitor, Performance Monitor, and Server Performance Advisor. However, new features and functionalities have been introduced to shake things up including data collector sets, Resource Overview, Reliability and Performance Monitor, scheduling, diagnosis reporting, and wizards and templates for creating logs. To launch the Reliability and Performance Monitor MMC snap-in tool, select Start, All Programs, Administrator Tools, Reliability and Performance Monitor, or type perfmon.msc at a command prompt.
The Reliability and Performance Monitor MMC snap-in is made up of the following elements:
![]() Resource Monitor
Resource Monitor
![]() Performance Monitor
Performance Monitor
![]() Reliability Monitor
Reliability Monitor
![]() Data Collector Sets
Data Collector Sets
![]() Report Generation
Report Generation
The upcoming sections further explore these major elements found in the Performance and Reliability Monitoring tool.
The first area of interest in the Reliability and Performance Monitor snap-in is the Resource Overview screen, also known as the Resource Monitor. It is displayed in the home page central details pane after the Performance and Reliability Monitoring tool is invoked and looks similar to the new Activity Monitor in SQL Server 2008. Alternatively, you can review the Resource Overview screen by selecting Reliability and Performance in the navigation tree. Resource Monitor can also be launched from within the Performance tab in the Windows Task Manager.
The Resource Monitor Overview screen presents a holistic real-time graphical illustration of a SQL Server system’s CPU usage, disk usage, network usage, and memory usage, as displayed in Figure 17.16.
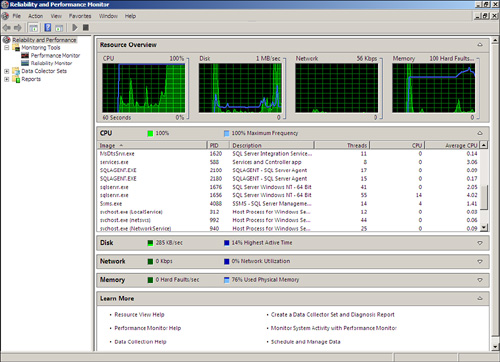
You can view additional process-level detail to better understand your system’s current resource usage by expanding subsections beneath the graphs. For example, when expanded, the CPU subsection includes CPU consumption by application such as SQL Server, and the Disk subsection displays disk activity based on read and write operations. For example, you can view disk activity associated with SQLServer.exe. In addition, the Network subsection exhibits bytes being sent and received based on an application. This comes in handy when measuring Network Utilization monitoring SQL Server database mirroring between two systems. Finally, the Memory subsection reveals information about the memory use of SQL Server.
The Resource Monitor Overview screen is the first level of defense when there is a need to get a quick overview of a SQL Server system’s resources. If quick diagnosis of an issue cannot be achieved, an administrator should leverage the additional tools within the Reliability and Performance Monitor. These are covered in the upcoming sections.
Windows Server 2008 comes with two tools for performance monitoring. The first tool is called Performance Monitor and the second tool is known as Reliability Monitor. These tools together provide performance analysis and information that can be used for bottleneck, performance, and troubleshooting analysis of a SQL Server system.
First, defining some terms used in performance monitoring will help clarify the function of Performance Monitor and how it ties in to software and system functionality. The three components noted in the Performance Monitor, Data Collector Sets, and Reports are as follows:
![]() Object— Components contained in a system are grouped into objects. Objects are grouped according to system functionality or by association within the system. Objects can represent logical entities such as memory or a physical mechanism such as a hard disk drive. The number of objects available in a system depends on the configuration. For example, if Microsoft SQL server is installed on a server, some objects pertaining to Microsoft SQL would be available.
Object— Components contained in a system are grouped into objects. Objects are grouped according to system functionality or by association within the system. Objects can represent logical entities such as memory or a physical mechanism such as a hard disk drive. The number of objects available in a system depends on the configuration. For example, if Microsoft SQL server is installed on a server, some objects pertaining to Microsoft SQL would be available.
![]() Counter— Counters are subsets of objects. Counters typically provide more detailed information for an object such as queue length or throughput for an object. The System Monitor can collect data through the counters and display it in either a graphical format or a text log format.
Counter— Counters are subsets of objects. Counters typically provide more detailed information for an object such as queue length or throughput for an object. The System Monitor can collect data through the counters and display it in either a graphical format or a text log format.
![]() Instances— If a server has more than one similar object, each one is considered an instance. For example, a server with multiple processors has individual counters for each instance of the processor. Counters with multiple instances also have an instance for the combined data collected for the instances.
Instances— If a server has more than one similar object, each one is considered an instance. For example, a server with multiple processors has individual counters for each instance of the processor. Counters with multiple instances also have an instance for the combined data collected for the instances.
The Performance Monitor provides an interface that allows for the analysis of system data, research performance, and bottlenecks. The System Monitor displays performance counter output in line graphs, histogram (bar chart), and report format.
The histogram and line graphs can be used to view multiple counters at the same time. However, each data point displays only a single value that is independent of its object. The report view is better for displaying multiple values.
Launching the Performance Monitor is accomplished by selecting Performance Monitor from the Monitoring Tools folder in the Reliability and Performance MMC snap-in. You can also open it from a command line by typing perfmon.msc. When a new Performance console is started, it loads a blank system monitor graph into the console with % Processor Time as the only counter defined.
Before counters can be displayed, they have to be added. The counters can be added simply by using the menu bar. The Counter button on the button bar includes Add, Delete, and Highlight. You can use the Add Counter button to display new counters. On the other hand, use the Delete Counter button to remove unwanted counters from the display. The Highlight button is helpful for highlighting a particular counter of interest; a counter can be highlighted with either a white or black color around the counter.
The following step-by-step procedures depict how to add counters to the Performance Monitor:
1. In the navigation tree of Event Viewer, first expand Reliability and Performance, Monitoring Tools, and then Performance Monitoring.
2. Either click the Add icon in the menu bar or right-click anywhere on the graph and select Add Counters.
Note
Typical baseline counters consist of Memory - Pages / Sec, Physical Disk - Avg. Disk Queue Length and Processor - % Processor time.
3. The Add Counters dialog box is invoked as shown in Figure 17.17. In the Available Counters section, select the desired counters and click Add.
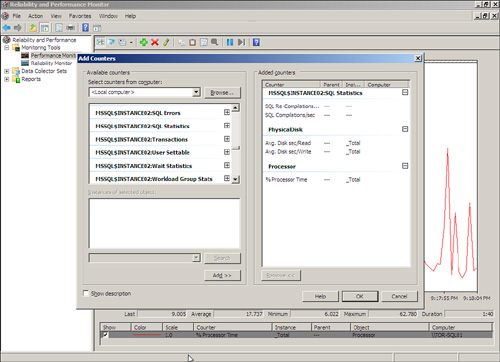
4. Review the selected counters in the Added Counters section and then click OK.
Note
This chapter focuses on monitoring. Chapter 19, “Performance Tuning and Troubleshooting SQL Server 2008,” illustrates the useful SQL Server counters that should be utilized when performance tuning and troubleshooting SQL Server 2008.
In the Performance Monitor display, update displays by clicking the Clear Display button. Clicking the Freeze Display button or pressing Ctrl+F freezes displays, which suspends data collection. Data collection can be resumed by pressing Ctrl+F or clicking the Freeze Display button again. Click the Update Data button to display an updated data analysis.
It is also possible to export and import a display by using the Cut and Paste buttons. For example, a display can be saved to the Clipboard and then imported into another instance of the Performance Monitor. This is commonly used to view or analyze system information on a different system such as information from a production server.
The Properties page of Performance Monitor has five additional tabs of configuration: General, Source, Data, Graph, and Appearance. Generally, the Properties page provides access to settings that control the graph grid, color, style of display data, and so on. Data can be saved from the monitor in different ways. The easiest way to retain the display features is to save the control as an HTML file.
The Performance Monitor enables you to also save log files in comma-separated (CSV) or tab-separated (TSV) format, which you can then analyze by using third-party tools such as Seagate Crystal Reports. Alternatively, a comma-separated or tab-separated file can be imported into a spreadsheet or database application such as Microsoft Excel or Access.
The Reliability Monitor is a brand new tool first introduced with the release of Windows Vista and now reintroduced with Windows Server 2008. This enhanced system management tool is the second monitoring tool available with Microsoft’s Reliability and Performance Monitor MMC snap-in. Use this tool when you need help troubleshooting the root cause associated with reduced reliability of a SQL Server system running on Windows Server 2008. Reliability Monitor provides event details through system stability charts and reports that help diagnose items that may be negatively impacting the reliability of a system.
The tool uses a System Stability Index to rate the stability of a system each day over its lifetime by means of an index scorecard that identifies any reduction in reliability. An index rating of 1 represents a system in its least stable stage, whereas an index rating of 10 indicates a system in its most stable stage. Each day’s index rating is displayed in a System Stability Chart graph, as illustrated in Figure 17.18. This graph typically helps administrators to identify dates when stability issues with the Windows Server 2008 system occurred. Additional itemized system stability information can be found in an accompanying System Stability Report section of the Reliability Monitor screen. The additional stability information further assists by identifying the root cause of the reliability issues. This information is grouped into the following categories: Software Installs and Uninstalls, Application Failures, Hardware Failures, Windows Failures, and Miscellaneous Failures.
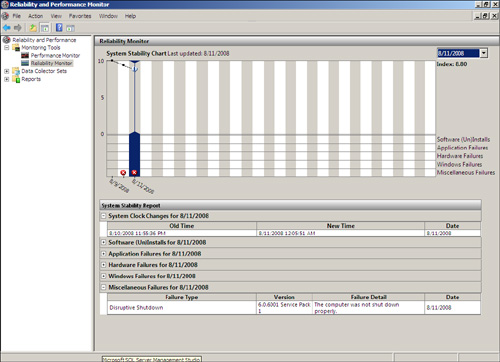
Reliability Monitor is an essential tool for identifying problems with Windows Server 2008. With Reliability Monitoring, an administrator can quickly identify changes in a system that caused a negative trend with system reliability. As such, this tool can also help administrators anticipate other problems, which all ultimately leads to solving issues efficiently and effectively.
The Data Collector Set is a vital new feature available as a subfolder within the Performance and Reliability snap-in. The purpose of a data collector set is to review or log system performance data. This is achievable through a single component that encompasses organized multiple data collection points. This information can then be analyzed to diagnose problems, correct system performance issues, or create baselines.
Performance counters, event trace data, and system configuration information are all data collector elements that can be captured and contained in a data collector set. Data collector sets can be based on a predefined template, created from a data collector set that already exists, created manually or with a wizard, or can be user defined. Data collector sets can be exported and used for multiple systems easing the administrative load involving the configuration of new systems producing more effective monitoring. Wizards facilitate the creation of data collector sets and enable an administrator to quickly create collections based on server roles or the type of information that is required.
The final folder in the Reliability and Performance console is Reports. The Reports folder provides diagnostic reports to support administrators in troubleshooting and diagnosing system performance problems including reliability. Reports are viewed in the central details pane of the Reliability and Performance Monitor snap-in.
The reports are based on data collector sets that were previously defined by users or preconfigured and included with Windows Server 2008 Reliability and Performance Monitoring. The report console’s features and functionality are very similar to those seen using the reports introduced with Server Performance Advisor in Windows Server 2003.
The Reporting folder is broken into two main subfolders: User Defined Reports and System Reports. The default System Reports subfolder typically includes reports relating to LAN diagnostics, system diagnostics, and system performance. Additional system reports are automatically generated depending on the server role installed on the Windows Server 2008 system. For example, an Active Directory diagnostics system report is automatically included in the console when the Active Directory Domain Services server role is installed on the Windows Server 2008 system.
SQL Server 2008 provides several additional built-in tools that assist in your ongoing monitoring efforts. Database administrators commonly use these tools to verify that the different SQL Server components are running correctly and to troubleshoot problems as they are encountered. These tools will be introduced here; however, they are covered in greater detail in the other chapters of the book.
The SQL Server Profiler tool captures SQL Server 2008 events as they are generated on a SQL Server. The captured information, referred to as a workload, can be reviewed in the UI or saved to a trace file. The workload can be used to analyze performance or can be replayed to conduct N+1 testing. The SQL Server Profiler tool is invaluable for getting detailed insight into the internal workings of applications and databases from a real-world and real-time perspective.
For additional information on using the SQL Server Profiler, see Chapter 19.
The Database Engine Tuning Advisor automates the process of selecting an optimized set of indexes, indexed views, statistics, and partitions and even provides the code to implement the recommendations it makes. The Database Engine Tuning Advisor can work with a specific query or can use a real-world workload as gathered by the SQL Server Profiler tool. The advantage of the latter approach is that the workload is generated based on actual usage, and the tuning recommendations reflect that.
The Database Engine Tuning Advisor is customizable and allows you to select the level of recommendation that the tool recommends. This feature allows you to maintain the existing database design and make appropriate fine-tuning recommendations for just indexes. Or you can make the existing design flexible and then have the tool recommend far-reaching changes to the structure such as partitioning.
For additional information on using the Database Engine Tuning Advisor, see Chapter 19.
The built-in monitoring tools in SQL Server 2008 provide a tremendous amount of proactive monitoring by allowing you to audit events, create alerts, collect performance data, send email notification, and review monitoring metrics via the newly established performance dashboards. In addition, when monitoring a SQL Server system, do not forget the new tools in Windows Server 2008 such as the new Task Manager. Performance Monitor and Reliability Monitor also bolsters a DBA’s monitoring experience.
![]() Leverage Activity Monitor as the first line of defense when there is a need to gain quick and effortless insight into a SQL Server system.
Leverage Activity Monitor as the first line of defense when there is a need to gain quick and effortless insight into a SQL Server system.
![]() Use the predefined standard reports included with SQL Server for monitoring performance and state information.
Use the predefined standard reports included with SQL Server for monitoring performance and state information.
![]() Leverage the existing and new DMVs when gathering performance, state, and monitoring metrics.
Leverage the existing and new DMVs when gathering performance, state, and monitoring metrics.
![]() Monitor server and database events by creating audits, database audit specifications, and server audit specifications.
Monitor server and database events by creating audits, database audit specifications, and server audit specifications.
![]() Don’t forget to view audit logs on a regular basis for trends, irregularities, and issues.
Don’t forget to view audit logs on a regular basis for trends, irregularities, and issues.
![]() Leverage Performance Studio to capture performance data from one or more SQL Server instances.
Leverage Performance Studio to capture performance data from one or more SQL Server instances.
![]() When using Performance Studio, take advantage of the Windows Server Log as a target as it is the least likely log to be tampered with.
When using Performance Studio, take advantage of the Windows Server Log as a target as it is the least likely log to be tampered with.
![]() Review the reports associated with the built-in collections for monitoring state and historical information.
Review the reports associated with the built-in collections for monitoring state and historical information.
![]() Use the SQL Server Profiler to generate workloads and test performance of databases.
Use the SQL Server Profiler to generate workloads and test performance of databases.
![]() Use the Database Engine Tuning Advisor to assist in the creation of indexes, indexed views, statistics, and partitions for the database and to test the results of the changes.
Use the Database Engine Tuning Advisor to assist in the creation of indexes, indexed views, statistics, and partitions for the database and to test the results of the changes.
![]() Examine the use of System Center Operations Manager 2007 for monitoring SQL Servers.
Examine the use of System Center Operations Manager 2007 for monitoring SQL Servers.