
In Chapter 1, you examined the initial makeup of the Andromeda Games platform offerings. Next, you will dig deeper into each of the respective architecture planes that make up the existing solution. But where to begin? You could start with the application architecture, in order to understand the components, frameworks, and patterns used. You could also start with infrastructure, identifying the physical and virtual equipment that makes up Andromeda’s core operating platforms. Or, you might want to start with data, as no system will function without the ability to consume and produce data of some sort.
The starting point can be a tough place to take off from, and this task is no exception. Sometimes you will find that you will gather information about more than one area of architecture when delving into a specific domain. For example, looking into application architecture can typically unearth a small to moderate amount of infrastructure knowledge. In the interest of moving forward, you decide that tackling the application architecture is your first stop.
Identifying Primary, Secondary, and Tertiary Components
A primary component is one that is critical to core functionality. A malfunction or removal of this component would critically impact SLAs and/or functionality.
A secondary component is a supporting component that enables the primary component to perform optimally. A malfunction or replacement of this component could adversely impact SLAs/functionality.
A tertiary component performs noncritical functionality and is generally isolated. A malfunction or replacement of this component should not involve any impact to SLAs, but may impact functionality.
Primary components have the highest risk to the health of the platform if they are not cared for appropriately. In some cases, backbone components like ASP.NET MVC are less likely to cause an issue, as they are tested out before being released into the wild for general consumption. Other components (more often internally developed) could provide core functionality but still pose a high risk through code instability, improper testing, or a lack of scalability. Secondary and tertiary components can still bring risk to platform health, though the level of risk can be easier to deal with depending on the depth of integration with the component.
Application Component Matrix
Component Category | Component Type | Component Name | Manufacturer |
|---|---|---|---|
Primary | External External External External External External Internal Internal Internal | ASP.NET MVC ASP.NET Web API ASP.NET Membership Internet Information Services SQL Server NGINX Andromeda Portal CardStock Inventory Management System | Microsoft Microsoft Microsoft Microsoft Microsoft NGINX Andromeda Games Andromeda Games Andromeda Games |
Secondary | External External External External External Internal Internal Internal | Angular Express NodeJS MongoDB Point of Service Software CardStock Forums Friends Platform In-Store Ordering | Node.js Foundation Node.js Foundation MongoDB, Inc. NEC Andromeda Games Andromeda Games Andromeda Games |
Tertiary | Internal Internal | Scheduling Trading Platform | Andromeda Games Andromeda Games |
Documenting Application Collaborations
Content Management
Forum Interaction
Forum Moderation
Inventory Management
Inventory Search
Online Ordering
Schedule Management
Trade Management
User Interaction
While there are likely many more collaborations among the different applications that Andromeda uses, these are centrally related to the Cardstock platform itself. You enter the collaborations into your model and start to draw out relationships between the collaborations, APIs, and application components. There are many dependencies on the Cardstock application component, based on the relationships you identify. What makes these collaborations important to the platform?
Each collaboration can ultimately lead to the discovery of application events and application interactions. We’ll cover interactions in a bit more detail later in this chapter, but we can start to glean some insight into the event structure of these application components. One area of focus is around events related to the inventory system.
Through conversations with the engineering team, you learn that these collaborations you’ve identified do not manifest in traditional event objects but do take into account that events are triggered—and handled—by the various components. To get a head start on event identification, and with the assistance of the engineers, you decide to employ a technique known as event storming. Event storming is similar in concept to brainstorming, wherein ideas about potential events are offered, recorded, and accepted (or rejected) to ultimately produce a collection of events.
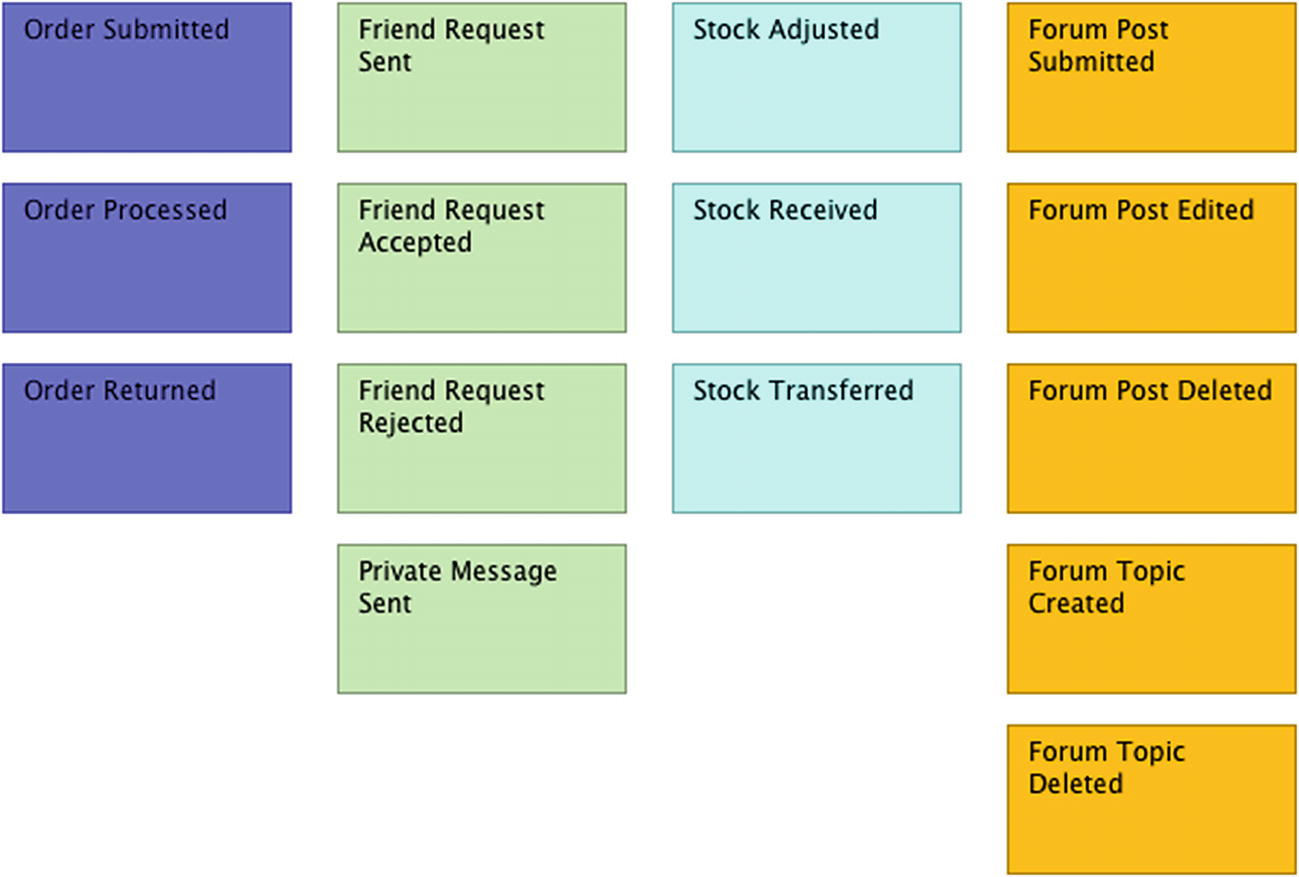
Sample of event storming
Locating the Components
You are aware of where the components reside within the application, but where does the application itself reside? Bridging the gap between the logical application architecture and the physical architecture starts by finding where the application is domiciled, whether it is a single instance or multiple instances, and what other requirements are impacted by that location (resiliency, recoverability, maintainability).
The portal and Cardstock applications, along with the accounting, purchasing, and other back-office programs, are hosted in the Andromeda main office’s server room. The inventory system is a bit different, however. There is a copy of the application that is run from the main office, but each store location has a server running a copy of the application as well. From your conversations with the developers, you’ve learned that there is a database on each store’s server that maintains the inventory information for that store. As long as a network connection can be found, the records from the store will synchronize with the records held at the main office. If that connection is lost, synchronization will occur as soon as the network link becomes available again. It’s very important to ensure the store’s inventory records are kept as up to date as possible, as this helps employees in locating additional merchandise in the stockroom if the floor location is empty. It’s also important to maintain the information from the main office, as that can allow employees to request an interstore transfer or even a warehouse-to-store transfer.
Each location has closed circuit cameras tied into an onsite recording device, which houses surveillance footage that is typically kept for a week. After each weekly cycle, the footage is offloaded to a file server at the main office. An IT operations team member goes to each site, transfers the footage to a hard drive, and returns to the main office where it is moved onto the file server. There is a job on the file server that automatically removes any footage older than 60 days.
Each retail location also has point of sale devices, which are used by the store team members to cash out customers, perform queries to the scheduling and ticketing interfaces, and print various reports to assist store managers in beginning of day/end of day operations. The registers are connected physically to electronic barcode scanners, credit card readers, and thermal printers that print out sales receipts. The registers are also connected to the store’s network through a hardwired network port. This allows the registers to connect to various printers on the network, as well as the inventory system and scheduling system.
Through another set of conversations with IT operations, you start to catch wind of some less than desirable application hosting practices. For example, you learn that one of the developers has been hosting the scheduling interface on his desktop computer. You also learn that there is a backdoor web application that allows store managers to peruse and update the inventory records of the main office directly via a password-protected area of the portal. This workaround was put into place due to connectivity issues that the stores faced with a legacy communications carrier that led to unreliable network connections between the stores and the main office. The carrier was replaced, but the web interface remained as a convenient way for managers to check inventory levels, especially from mobile devices.
You inquire about software that is installed on the machines, both at an application and operating system level. While the IT team doesn’t have a formal application maturity matrix, it does have a spreadsheet of all paid applications that Andromeda owns, including license numbers and vendor contacts.
Note
An application maturity matrix is a listing of software applications that describes the name, usage, criticality, maintainer(s), business relevance, and other details for each application.
Since most employees have restricted access to install programs, this list is a fairly accurate representation of what could be found on employees’ machines. Developers have full administrative privileges on their machines, however, and the IT team knows that the developers have installed a smattering of tools, libraries, and third-party components. What those items are, though, is not something that the IT team is fully aware of. This concerns you and you make a note to gather further information from the developers on what has been installed on their machines.
Constructing a Basic Infrastrucutre View
Taking the information you’ve gathered, you set out to get a very minimal view of what the infrastructure would look like, including the main office, retail stores, and warehouse. The intent of your first draft is to get a base sense of what’s in each location, according to the data you have. You end up putting together a sketch that captures very high-level details. While you know that you don’t have all of the actual servers captured, you want to at least get a sense of what the standout infrastructure components are.
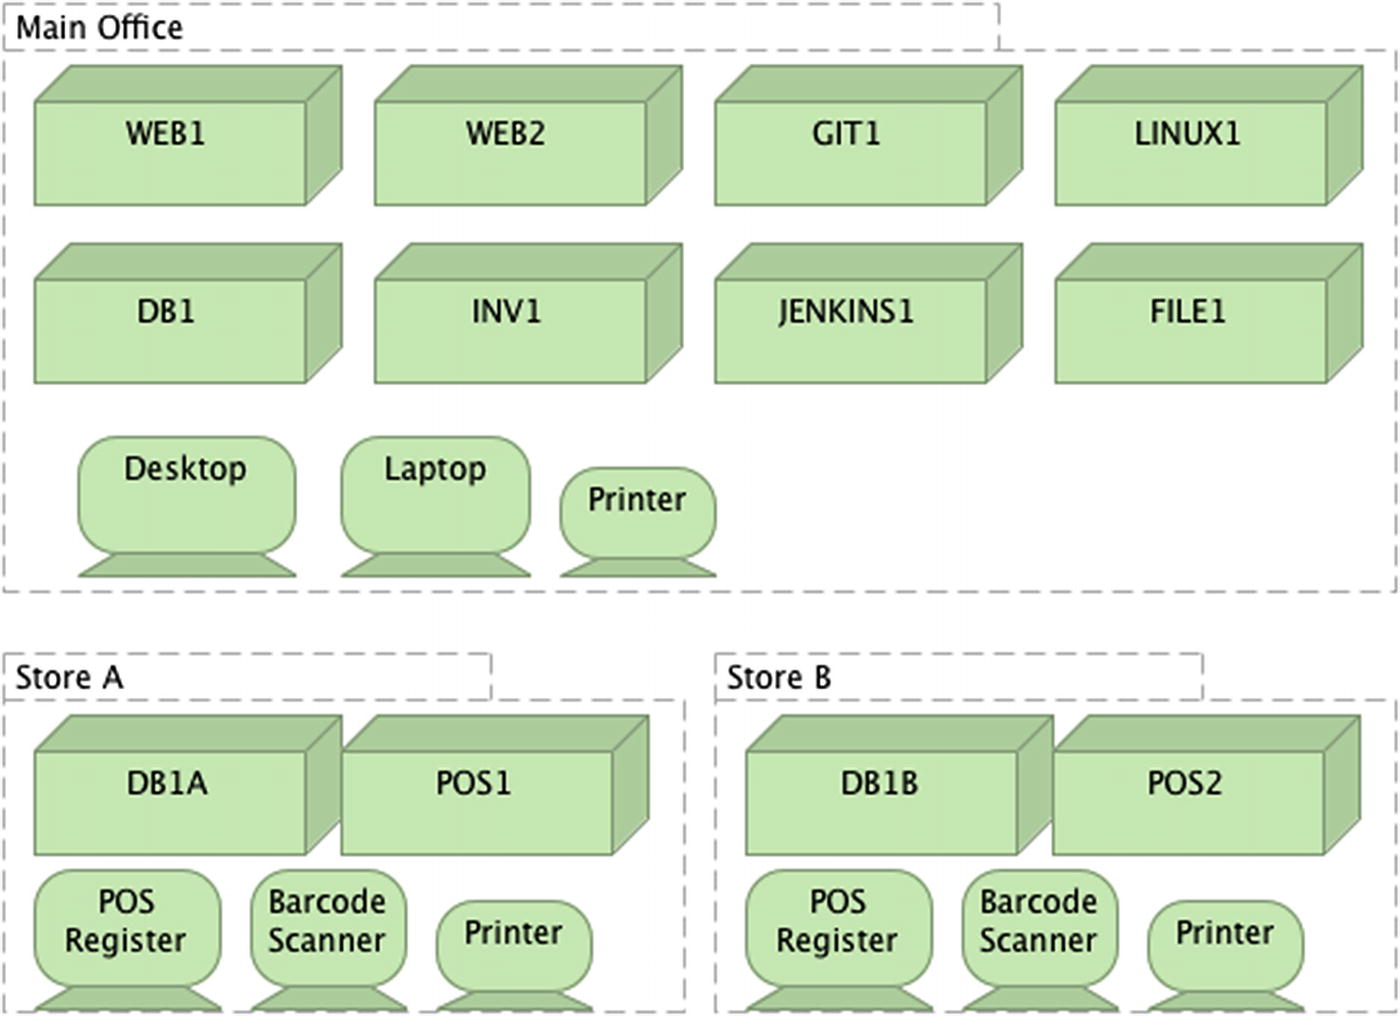
Rough sketch of baseline infrastructure
Each device shown could have 1 to n number of instances at each location. Each node has a 1:1 relationship, meaning each named device has only one instance.
Enhancing the Infrastructure View
The initial construction of your infrastructure view left you with more questions than answers. How should the catalog of devices at each location be captured? What are the technical specifications of each infrastructure component? How are the networking components of each location actually related? Are there details that, while relevant to the view, are irrelevant to the task at hand? Capturing and sorting through these bits of information can be overwhelming but will help establish a better baseline, as shown in the following sections.
Physical Devices
Typically, with physical devices, some system of cataloging is employed to make sure that assets are accounted for and can be studied for potential repair or replacement. Obviously if someone turns in a device saying that it no longer works, a member of the IT staff will be able to assist with fixing or replacing that device (budget permitting). Keeping track of the year an item was purchased can help IT staff be more proactive in capturing potential end-of-life sitauations with equipment. Tracking details such as CPU speed, Cores, and RAM and hard disk size can prove useful in helping to find comparable cloud-based infrastructure.
Server infrastructure : rack units, physical and virtual boxes
Point of sale devices: Registers, human interface devices (barcode scanners), integrations with inventory systems
Employee devices: tablets and phones for store employees, and PCs for the engineering staff
The first item is fairly straightforward. In order to host the various platform components, a solid server infrastructure is required. While there are no rack-mount units, the IT operations folks do have several physical machines that serve as the backbone for the back-office systems and the development ecosystem. Capturing the current state for that infrastructure is first on your list.
The second item is a bit more nebulous, as the POS devices are not directly in scope but do interact with the inventory management system, which is in scope. Focusing on the integration points as well as how information is captured at the point of sale does factor into things, especially since GameCorp has an existing POS platform that it prefers. That preferred platform is a bit outdated, though, and there has been talk of wanting to get a fresh take on the POS systems. Part of your hope is that with this project you can introduce a modern platform that makes store employees, systems admins, and developers all happy while still maintaining robust integrations with downstream systems. More on that later.
The last item deals with how employees access and interact with the components of the platform. Cardstock itself is maintained by developers via their laptops, which have certain applications installed and have a higher amount of CPU cores, RAM, and disk space than their nontechnical counterparts. There are a few store employees who have administrator rights within Cardstock to moderate forums, answer inquiries, and take action on users if required (banning for inappropriate actions or content, for example). The store managers have access to the hidden inventory update page from within the portal, and when needed will access that via their smartphones. Store employees also have the ability to search inventory at all locations from within a web browser, but only from machines connected to the store’s internal network.
Networking
When thinking of networking, two main ideas may come to mind. One is that of a location and its devices, all able to communicate with one another. Another is that of a set of locations, each able to identify and communicate with devices regardless of physical location. Andromeda has a fairly simple networking setup, wherein each location has its own local area network, and each store can communicate with the main office through the use of a virtual private network, established by the company’s Internet provider. Each location also has access to the Internet for critical business functions, but most other traffic is blocked to avoid any potential security issues.
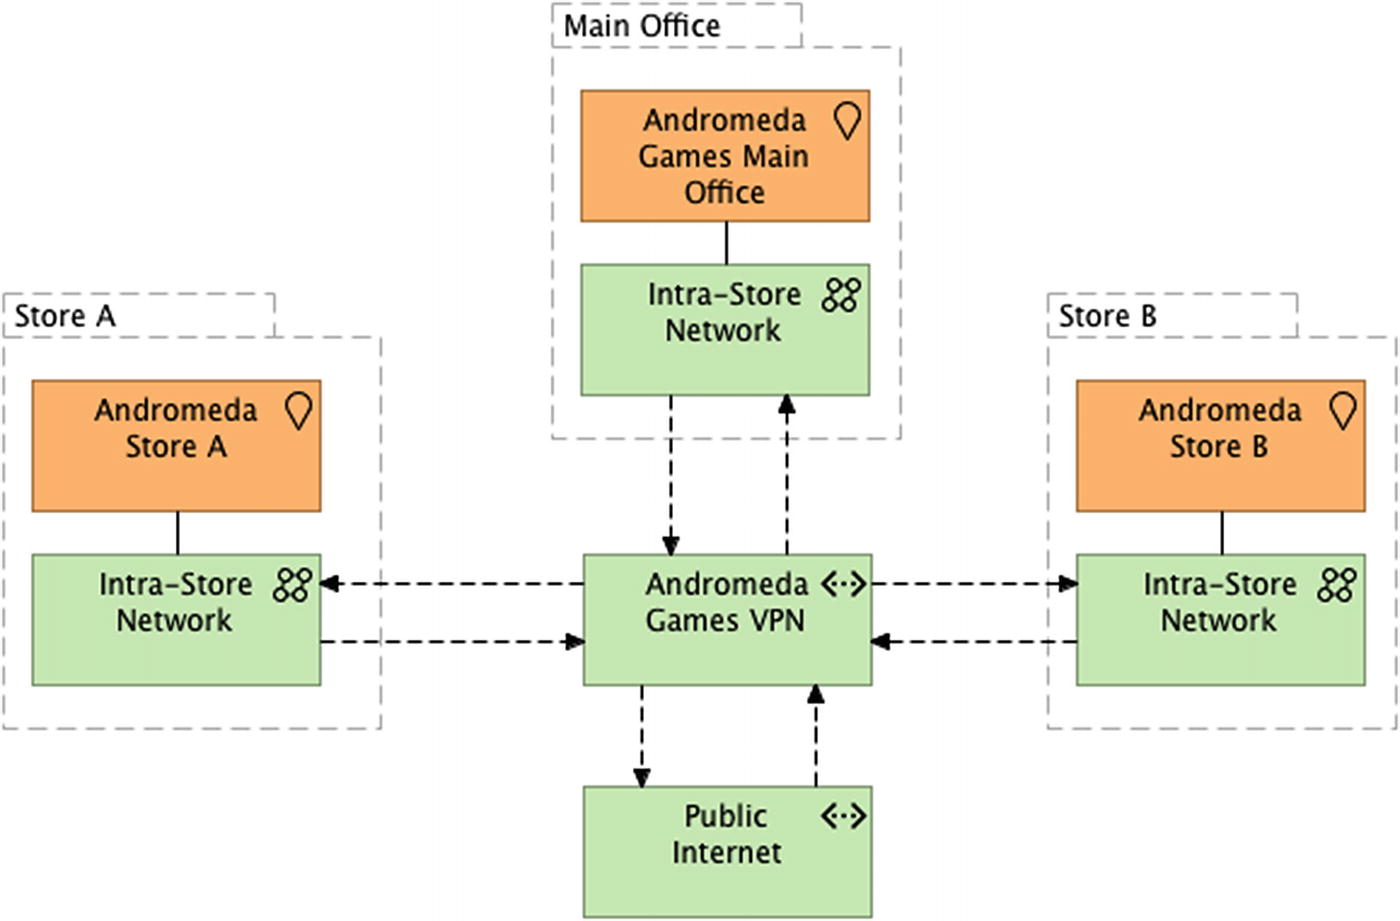
Basic network connectivity, including VPN and Internet
Your next step in understanding the networking connectivity is to get some baseline details on the type, speed, and quality of the circuits connecting all of these locations together. This information is good to have on hand in the event that you need to integrate services with other networks, such as GameCorp’s corporate network or Microsoft Azure. The two stores and main office location all interact over dedicated T1 lines, which offer transmission speeds up to 1.54 Mbps. Each of the T1 connections communicates over a multiprotocol label switching circuit, which in turn communicates with the Internet service provider. You notate this information with the intent of giving it to your infrastructure architect, who will be able to dig in further and give recommendations on target state integration of Andromeda’s networks and those of GameCorp.
Seeking Interactions with Applications, Technology and Data
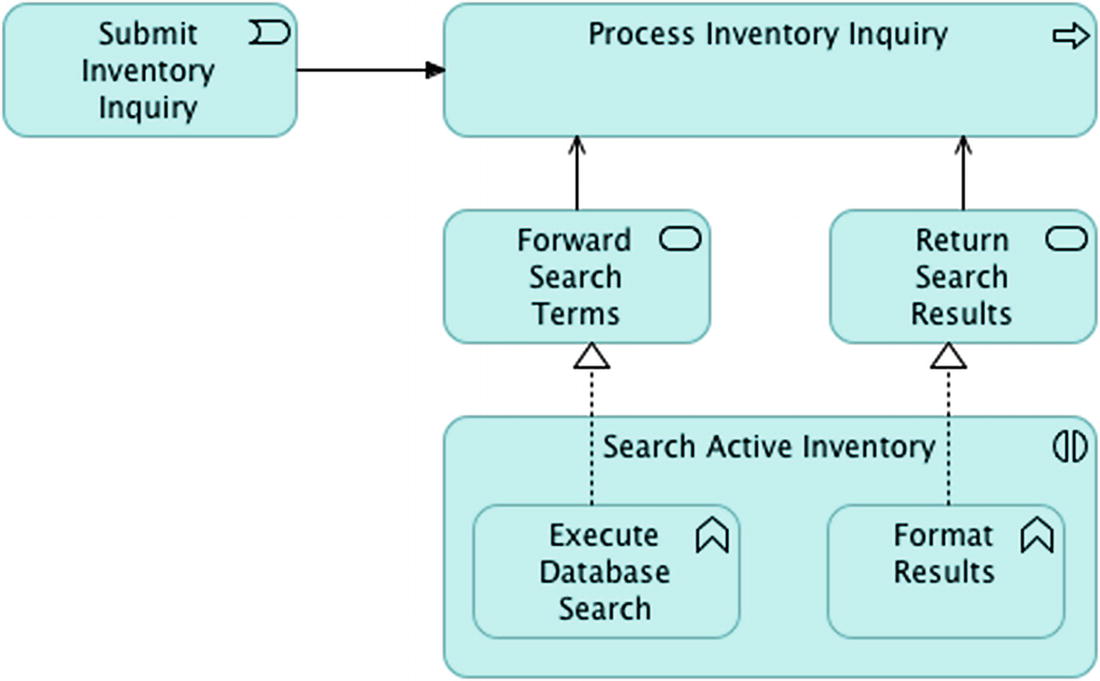
Section of application interaction diagram with event and process
Tip
Please refer to the Archi metamodel for a complete listing of the application and technology interactions captured.
Determining Information Consistency
Not all information is stored the same way. While this may seem like an obvious statement, the intent of the statement is really to drive understanding about what types of data are being stored for the platform, and what the needs are from a timing perspective. For example, consider the dichotomy of Eventual Consistency vs. Immediate Consistency.
In a platform or subsystem that requires its data to be eventually consistent, there is no rule in place specifying that any persistence of data needs to be done immediately. The target data store can be updated in an asynchronous manner, with varying degrees of speed, based on the functional requirements of that application. Some of those requirements may include a pop-up message being displayed to the end user once the action is completed, with no direct tie to the area of the application that the user may be in at the time.
With immediate consistency, the premise is that any action that means to persist data will do so with no delay and offer a confirmation back to the end user upon completion. Any subsequent queries for that data will result in a dataset that contains the newly created or updated data.
A common way to look at the difference between immediate and eventual consistency is that of real-time vs. batch transactions. In many industries, it is common to allow a set of actions or features to perform operations in “real-time,” meaning as quickly as possible. More often than not, this amounts to near-time and not real-time due to latency with the application, infrastructure, or other environmental factors. Any operations that are deemed to be too intensive for near-time processing can be relegated to batch operations, typically run in a scheduled fashion during nonbusiness hours.
That’s not to say that batch processing is the same as eventual consistency, however. At a deeper level, eventual consistency works on the premise that information will be updated eventually, but not take such a long time that it does not update until the next day. Normally, operations that fall into this level of asynchrony will take minutes to complete and report back, vs/ batch operations that may take hours and are generally not user initiated.
Most of the data moving between components is considered near-time. It’s important to the user experience to have the most accurate inventory listings at any given time, which means that item holds for people who may put an item into their cart via the website should decrement the total on-hand count of an item as soon as possible. There will be edge cases where an online customer may put an item in his or her cart—the last item in stock—and very close in time to that selection, a customer in a physical store location could buy the exact same item. This would lead to an invalidated shopping cart and could result in a somewhat unhappy online shopper. Utilizing the appropriate data consistency level will help to keep the user experience more desirable.
After analyzing the data flows and talking with operations, you arrive at the conclusion that a vast majority of the data being consumed, produced, or persisted is meant to be updated in near-time. A few exceptions would include the prestaging of incoming merchandise from the purchasing system to the inventory system, nightly processing of cash and credit transactions, payroll reports, and sales incentive accumulators.
Go with the Data Flow
Figuring out what data a platform works with is just as crucial as determining whether that data is produced, consumed, or both. While some aspects of inbound and outbound data will be covered in Chapter 3, it is important to at least capture the data flows that manifest between components, subsystems and the platform itself.
Using the application and technical interactions you exposed earlier, along with the general idea of what data transactions exist, you begin putting together a high-level picture of the key data sources, their ingress/egress points, and general timing considerations.
Immediate Consistency
Data objects and relations
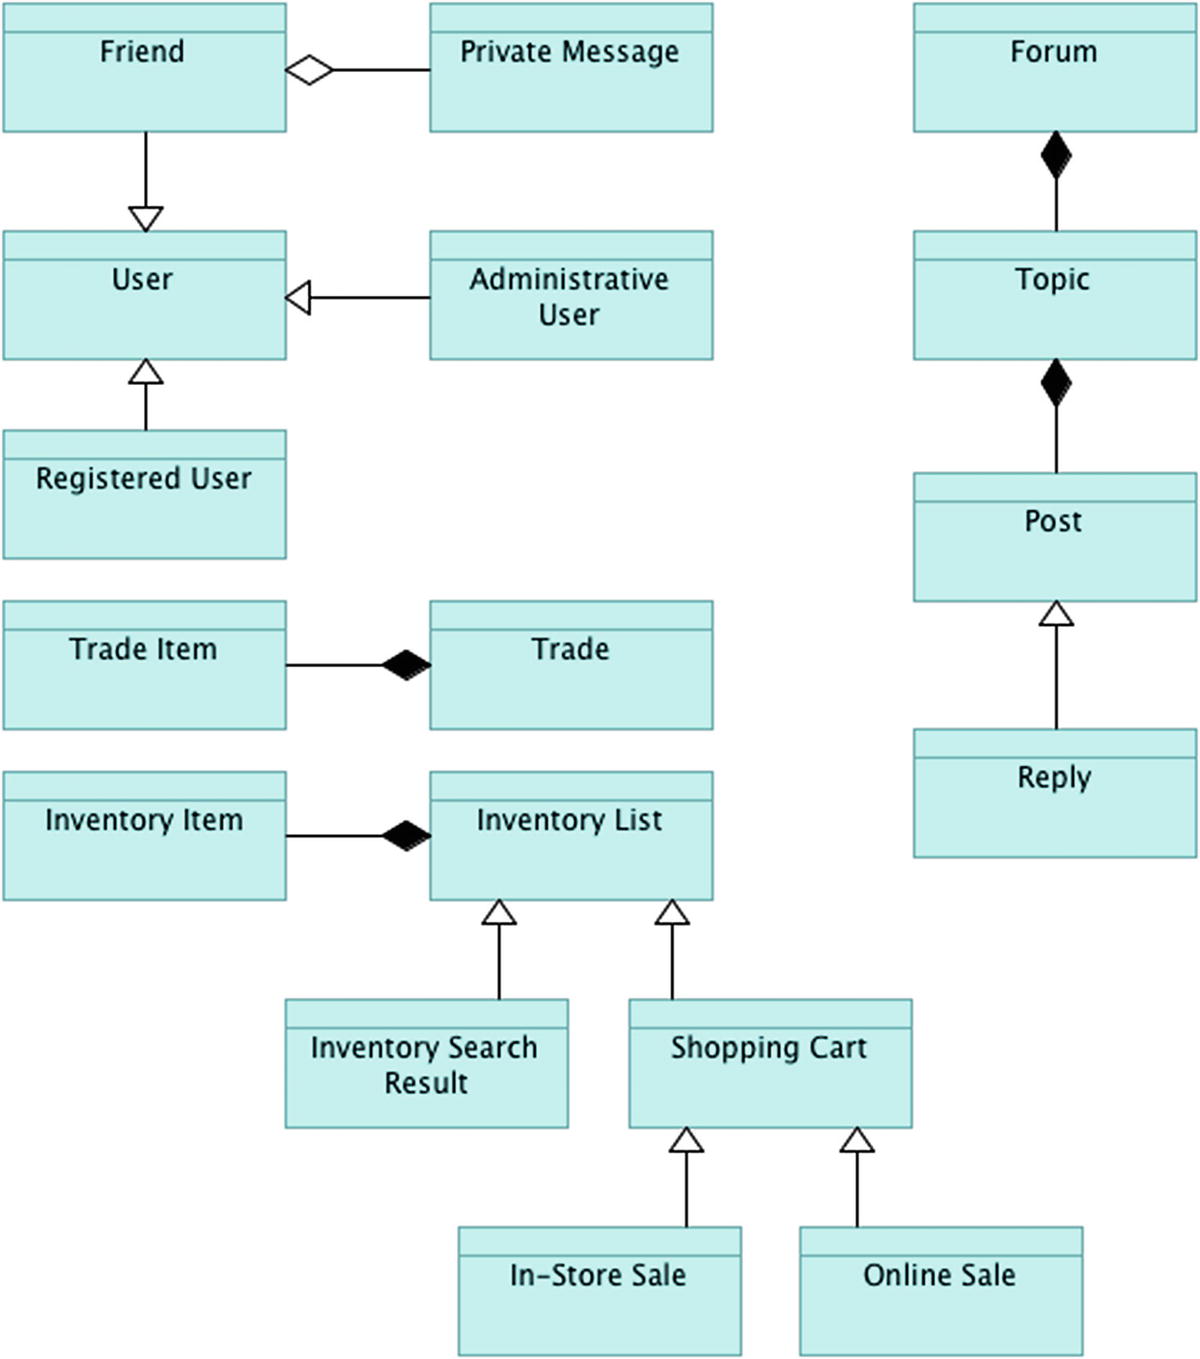
Registered User (accesses all areas of Cardstock as well as reads the public portal)
Administrative User (accesses all areas of the platform and can edit all areas)
Friend (accesses private messages, friend lists)
The trading platform uses the notion of a registered user and allows for a Trade object to be formed when a trade request is sent from one registered user to another. That Trade object can consist of one or more Trade Item objects. In a similar fashion, an Inventory List object is a base item that contains one or more Inventory Item objects. The Shopping Cart and Inventory Search Result object are two specializations of the Inventory List. The Shopping Cart object has two specialized forms as well, the In-Store Order and the Online Order. Forums can consist of one or more Topics, which can consist of one or more Posts. A Reply object is a specialization of a Post and is displayed in a slightly different way than an initial Post would be.
Eventual Consistency
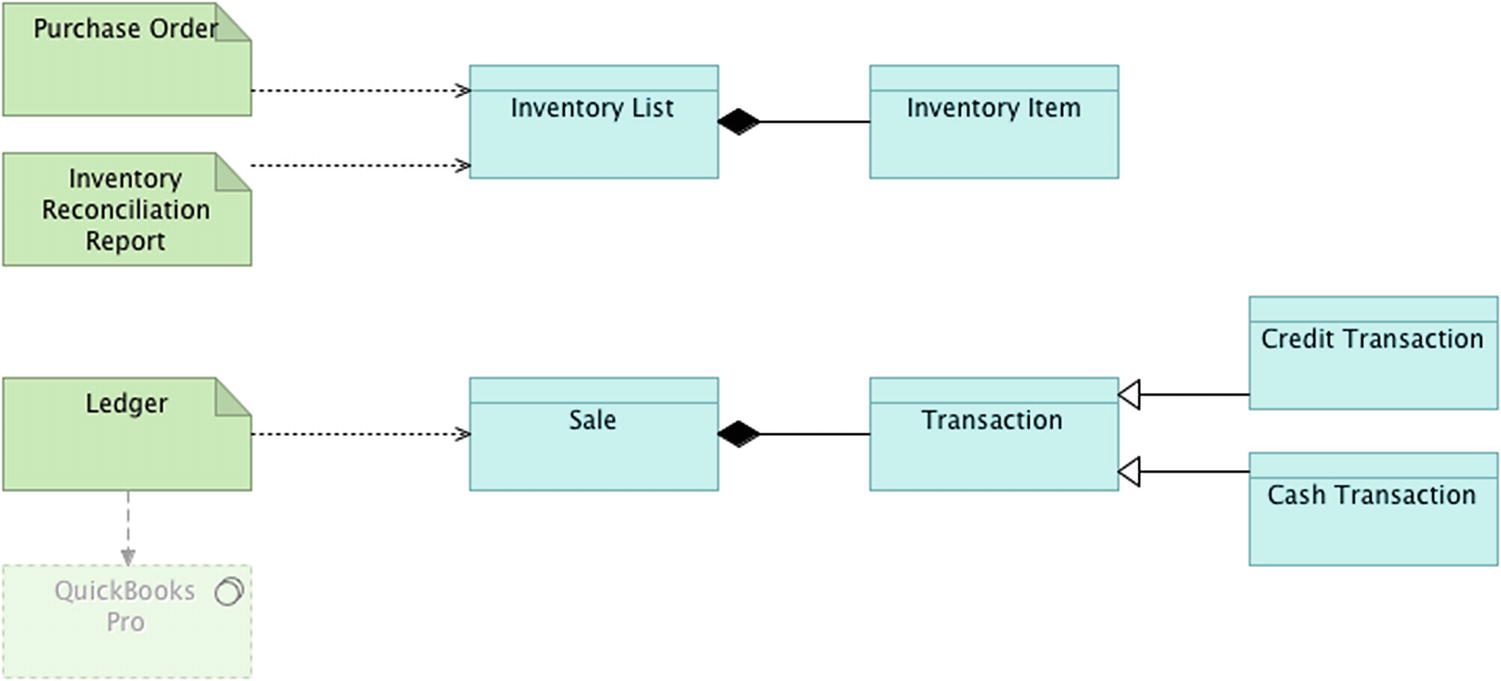
Section of eventually consistent data objects
Another type of data consistency is related to the system metadata for the platform, who has access to the operations that release the various platform components, and where the plaform is ultimately deployed to. You now turn your focus to peeling back the layer that keeps the lights on—the deployment architecture.
Fleshing out the Build Process (Further)
Initially while talking with the developers, you got a basic sense for how the team keeps its source code maintained as well as how they build and release their software. You decide to dig a bit deeper, though, as the details around the Jenkins jobs are not exactly clear at first glance. You’re also not clear about how the Git server is set up.
The Git server is set up on its own machine and is running a local copy of GitLab Community Edition. The developers did not want to use any hosted solutions for fear that they would have issues syncing their code during times of Internet outages. It was initially set up by a developer who is no longer employed with Andromeda, and since everything was working fine, no one saw any need to change that out. There are two engineers who currently have administrative rights on the server, and they manage the maintenance and upgrades for that box.
The Jenkins server is in a similar state, wherein it was set up by the same developer who is no longer with Andromeda. There are a few jobs set up that deal with compilation and packaging of artifacts, but other than that the installation is fairly plain vanilla. There are some plugins installed to accommodate .NET compilation and some minimalistic code metric collection.
You catalog the build jobs for the main portal, Cardstock, and the API layer that allows for integration with the inventory system. Next you move on to the deployment jobs, which outline the various environments used in the pipeline.
Lighting up the Runway
Through your research into the Jenkins instance, you find deployment jobs that are associated with every build artifact. The team uses a central file server to store the artifacts and the Jenkins jobs pull artifacts from that server and move them to the appropriate target environments. While a lot of work is done locally on the developers’ workstations, there are two preproduction environments that are used to validate releases prior to sending them to production.
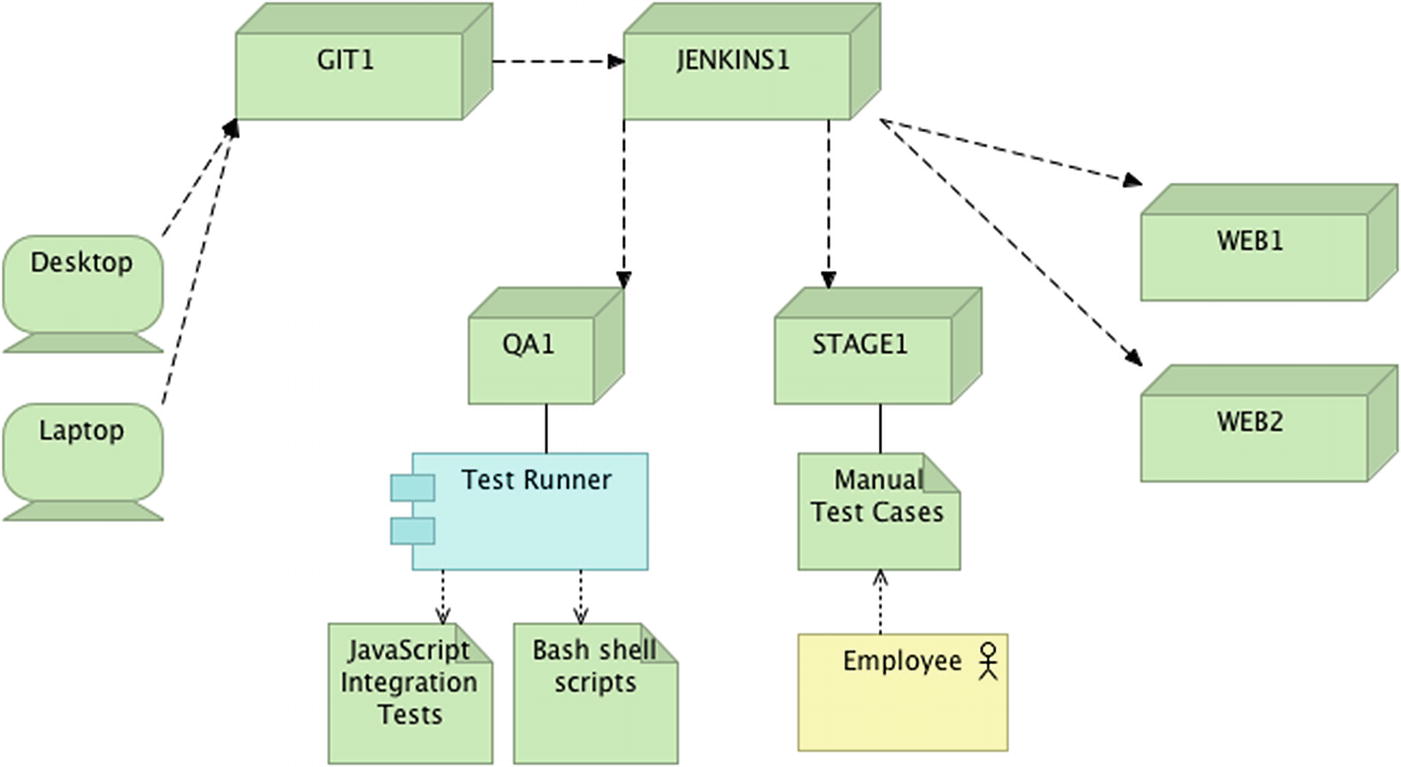
Baseline deployment runway, with orchestration
From a source control perspective, once code is pushed from a developer’s workstation to GitLab, it is deployed to the QA environment and the test runner is triggered automatically. The test runner is designed to execute any tests that are in JavaScript or Bash formats. Once the test runner has finished execution, it sends the results via email to the development team. When a change or set of changes have passed that test run, a release branch can be cut. Once the release branch is cut, the code is moved to staging. Upon successful validation, the release branch is closed out and is merged back into master and develop, following proper GitFlow protocol. Once the merge to master is complete, the code is moved to production and the ensuing commit is tagged with the latest release version.
You finish your notes around the deployment runway and general application lifecycle. Having covered off most of the domain architecture areas for the existing platform, you now turn your focus to the security architecture for Andromeda Games, which will prove to be a challenge unto itself.
Summary
In this chapter, you have examined the existing application, infrastructure, data, and deployment architectures related to Andromeda Games’ Cardstock platform. You have been able to identify, catalog, and display the components that make up the platform and its supporting cast. You have put together a series of views within the Andromeda model that capture the information you have uncovered about each of these architecture domains. Metadata about each item and each view have also been captured to facilitate the ingestion of this model by other architects. You have also been able to analyze the components in relation to reliability—or lack thereof. Next on your list of areas to look into is that of security and compliance, something that needs to be right the first time.
EXERCISE: FINDING SINGLE POINTS OF FAILURE
Using the categorized components in Table 2-1 in conjunction with the infrastructure views you’ve compiled, it’s time to work through what potential SPOFs might be present within the platform’s ecosystem.
A good place to start the identification process is to look at the components, inclusive of what tier they are in, and ask whether a complete outage of that component would cripple the application. Many of the components in your table wouldn’t completely bring down everything related to the platform, but would certainly lead to a highly degraded user experience.
What component(s) can you identify as SPOF candidates? What action(s) would you take to ensure the component(s) identified can be considered resilient and fault tolerant?