9. Using Horizon Preference No Matter Your Long-Term View
As I offered in my introduction, my goal in writing this book is to share the insights and conclusions I have come to through the framework of socionomics. My hope is to help investors see what I now see in the markets and the world around us so that they can prosper from it. I was not trying to write either a Dow 50,000 or Dow 5,000 book.
To be clear, I hope my mood-based assessment of the past 20 years is not just wrong, but that it’s very wrong. I don’t wish for single digit P/Es nor the societal behavior that would naturally accompany a market defined by severe self-assured uncertainty. But it makes sense to me that confidence would follow a cyclical pattern (such as suggested in the chart in Figure 9.1) in which positive trends in mood naturally lead to a peak and overconfidence, which in turn lead to negative trends in mood that ultimately result in “under” confidence and a natural bottom, which would in turn lead to a positive trend in mood....
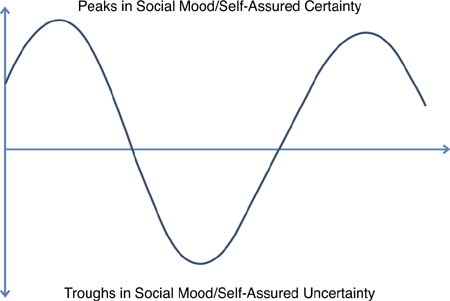
Figure 9.1. Social mood moves through a natural cycle
Given the significant peak in social mood we experienced between 2000 and 2007, I believe there is a significant trough in the future. Still, having looked at behaviors using the Horizon Preference framework and the principles of socionomics over long periods of time, I think it is important to appreciate that there are short-term cycles within long-term cycles, which are also significant and “tradable” for most investors, and which follow the same peak to trough to peak to trough patterns of confidence shown in Figure 9.1.
In Chapter 8, “Social Moods and the Markets Today: So Where Are We?,” Figure 8.3 suggested that the entire period from the bottom of the Great Depression to 2000/2007 could be considered a move across the entire Horizon Preference framework from severe self-assured uncertainty to severe self-assured certainty. You could argue the same holds true, however, for the period from 1937 to 1966 or from 1990 to 2000. Both of those shorter time periods show similar behavioral swings from a trough to a peak in confidence just to a lesser degree. Even Figure 9.2 of the markets from the bottom in 2002 to the peak in 2007 suggests the same positive migration in mood, albeit to an even lesser degree.
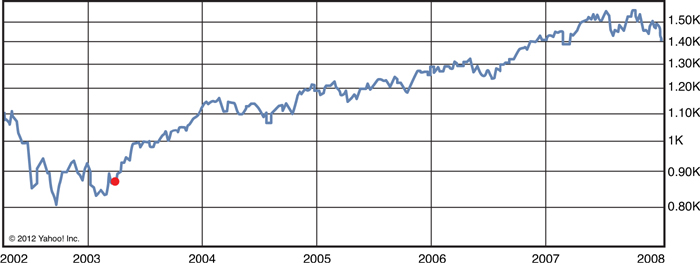
Source: Yahoo! (chart)/CSI (data). Reproduced with permission of Yahoo! Inc. © 2012 Yahoo! Inc. YAHOO! and the YAHOO! logo are registered trademarks of Yahoo! Inc.
Figure 9.2. S&P 500 from 2002 to 2007
Based on the work I have done looking at patterns of behavior, I believe that most investors should be able to routinely spot, using real-world events, significant market turning points using socionomics and the Horizon Preference framework presented in this book—turning points that suggest anywhere from a multi-month to multi-year change in market direction.
As I discussed earlier, in early October 2011 I saw what I believed were consistent behaviors associated with self-assured uncertainty. Those behaviors suggested that a significant market bottom was near. Four months later, in early February 2012, I put together this lengthy list of behaviors that I saw at the time, which seemed to be reflecting just the opposite mood—an extremely high level of confidence, if not self-assured certainty—and what I believed was a highly likely peak in the market:
• A $25 billion foreclosure settlement agreement among the major mortgage servicing banks, the state attorneys general, and HUD.
• The approval of a highly controversial “deal” on additional austerity in the Greek parliament.
• The announcement of a $90 billion merger deal by Glencore and Xstrata.
• The announcement by European Central Bank (ECB) President Mario Draghi that the ECB would expand the eligible collateral pool to loans and other financial assets, and Mr. Draghi’s public statement, “Sure, it’s going to be more risky. Does that mean that we take more risk? Yes, it means we take more risk. Does it mean this risk is being unmanaged? No, it is being managed. And it’s being—it’s going to be managed very well because really there will be a strong overcollateralization for the additional credit claims. The conditions will be very stringent.” And Mr. Draghi’s bullying comments to European bank CEOs, questioning the “virility” of those not participating in the long-term refinancing operation (LTRO).
• The thunderous initial public offering (IPO) announcement of Facebook and the IPO of Caesars Entertainment with the near-doubling of that company’s stock price on the first day of trading.
• The meeting between President Obama and Italian Prime Minister Monti, accompanied by headlines touting “spectacular progress.”
• News reports that the Council of Economic Advisers had “updated their forecasts in recent days and now project that the economy will create two million jobs this year if stimulus measures are extended, which could reduce the unemployment rate to about 8% by year’s end.”
• The parabolic move in Apple stock, with the world’s largest stock (by market cap) rising more than 10% in four days, with TV pundits suggesting that investors now use call options to gain exposure to the stock because “1,000 shares are the price of a house.”
• The lowest jobless claims since April 2008.
• The approval by the Nuclear Regulatory Commission of the first new nuclear reactor since 1978.
• Reductions in most commodity collateral margin requirements by the Chicago Mercantile Exchange.
• Passage of an insider trading law by and for Congress.
• German chancellor Angela Merkel’s highest approval ratings since 2009.
• The eviction of the last Occupy Washington participants.
• The most successful meth drug raid ever in Mexico, capturing “an amount equal to half of all the meth seized worldwide in 2009,” and the largest mass drug arrest in Colorado history involving 500 officers, 80 suspects, and 4 cocaine drug rings.
• Comments like this one from Neelie Kroes, a Dutch vice-president of the European Commission who told the Volkskrant newspaper, “It is absolutely not a case of man overboard if someone leaves the eurozone. It’s always said: if you let one nation go, or ask one to leave, the entire structure will collapse. But that is just not true....”
• The denouncement of bonds by several major money managers, with one even suggesting that investors should have “100% in equities.”
• An article from The Wall Street Journal entitled “Living Extra Large” about mega-mansions, with the accompanying sub-headline “When 50,000 Square Feet Isn’t Enough.”1
A pretty striking contrast in behaviors in just four months, if you ask me!
But the markets also reflected the change in mood as well with the S&P 500 rising more than 25% from early October 2011 to early February 2012.
Admittedly, I was early with my February observations. After pausing until early March, the markets continued higher over the next six weeks, gaining another 5%. (Although I want to note that many major European markets peaked in early February, as did the Dow Transports). As highlighted earlier in the book, confidence has a way of routinely morphing into over-confidence with “blow off” tops during which bad news is routinely ignored and self-assured certainty fills the airwaves. At the top, we don’t want certainty to end. During March, this became clear as market participants renamed CNBC and Bloomberg Television “Apple TV.” It was all the pundits wanted to talk about, and not surprisingly Apple stock, which had risen 22% in February, soared an additional 13% in March.
Still, in retrospect, the indicators of self-assured certainty that I saw and shared in early February were significant. While I didn’t know it at the time, the peak in Apple’s relative strength index (RSI) occurred that week and as Figure 9.3 shows, that week also marked a significant peak for the percentage of NYSE stocks trading above their 50-day moving average.
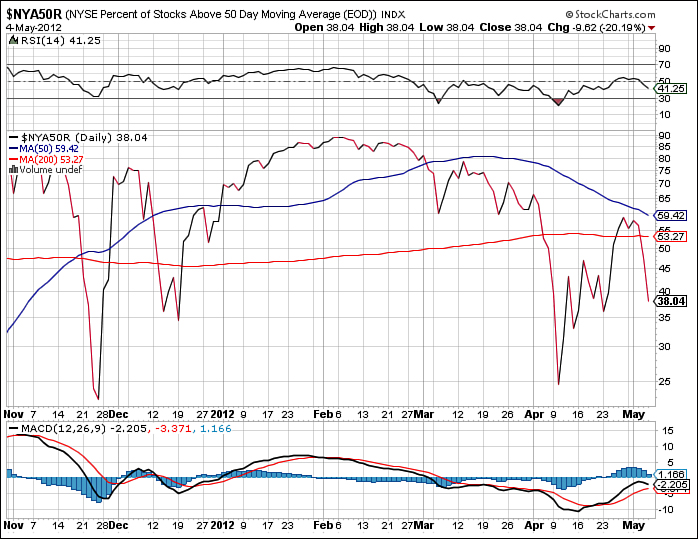
Source: StockCharts.com
Figure 9.3. Percentage of stocks trading above the NYSE 50 day moving average
What socionomics and the Horizon Preference framework gave me in February was the ability to use real world indicators to see—without even realizing it—what was happening technically in the market. Confidence was peaking. And knowing that peaks are a process, given our natural optimism and desire to hold on to certainty for as long as we can, I could then be watchful for an upcoming change in the market’s direction.
That is how I use social mood. When I see examples of greater “us, everywhere, forever” behaviors, they enable me to confirm the health of rising markets. When I see examples of greater “me, here, now” behaviors, they enable me to confirm the weakness of falling markets. And when I see extremes in either pattern of behavior—particularly clustered patterns of behavior—I am on the watch for a potential turn in the markets. These patterns of behavior are the best indicators I know; and they keep the emotion out.
Too many investors I know spend their time focused entirely on the financial markets and specific company earnings and analyst reports. From my perspective, they are missing the forest for the trees. Changes in social mood cut across all aspects of our lives—from economics, politics, culture, the media, even the foods we eat. I strongly recommend that as you invest, you look broadly at the world around you for clues. Many of the reasons I saw a bottom looming in October 2011 and a peak on the horizon in February 2012 had nothing to do with the financial markets.
Final Thoughts
Whether one is long-term bullish or long-term bearish, I think it is important to recognize that social mood and our level of confidence move in series of concurrent cycles of differing degrees. That is to say, it is possible for a very long-term cycle to be negative and a shorter-term trend to be positive—and vice versa. For example, although the entire move from the Great Depression to 2000/2007 shows increasing levels of confidence, the period of the late 1960s and early 1970s was clearly a period of deteriorating social mood. Someone in 1966, for example, who believed that social mood could still become even stronger would ultimately be proven correct, but that person first would have had to experience a very painful almost 10 years.
I learned that lesson the hard way in 2009, before I was aware of socionomics. At that time I believed strongly that the financial crisis had not played all the way through, but I failed to grasp the idea that confidence could first move through a strong positive cycle—albeit shorter term. (As I write, the S&P 500 is up more than 100% since its March 2009 lows.) Because of the Horizon Preference framework, I can now clearly see the behavioral signs of self-assured uncertainty that I missed in 2009.
Today, although I continue to see signs of broad scale deterioration in mood that support my long-term bearish view, socionomics and the Horizon Preference framework enable me to also see when real-time behaviors suggest meaningful market tops and bottoms along the way. Rather than getting caught up in the emotion of volatile markets—or my own long-term view—I now focus on the behaviors I see around me and how those behaviors reflect mood.
I believe that better than any broker or analyst out there, the real-world patterns of behavior around us offer the best investment advice there is.