Chapter 13. Replication Monitoring
Now that you know when your servers are performing well (and when they aren’t), how do you know how well your replication is performing? Things may be going smoothly, but how do you know that?
In this chapter, we discuss advanced monitoring, focusing on monitoring and improving replication performance.
Getting Started
There are two areas that can affect the performance of your replication topology. You must ensure both are optimized to avoid affecting replication.
First, ensure your network has the bandwidth to handle the replicated data. As we’ve discussed, the master makes a copy of the changes and sends it to the slaves via a network connection. If the network connection is slow or is suffering from contention, so too will your replicated data. We discuss some ways to tune your network and ways you can tune replication to make the best of certain networking environments.
Second, and most important, ensure the databases you are replicating are optimized. This is vital because any inefficiency in the database on the master will be compounded by the same poor database performance on the slaves. This is especially true concerning indexing and normalization. However, a well-tuned database is only half of the equation. You must also ensure your queries are optimized. For example, a poorly tuned query run on the master will run just as poorly on your slaves.
Once you have your network performing well and your databases and queries optimized, you can focus on configuring your servers for optimal performance.
Server Setup
Another very important thing you can do to create the best platform for your replication topology is make sure your servers are configured for optimal performance. A poorly performing replication topology can often be traced back to poorly performing servers. Ensure your servers are operating with enough memory and that the storage devices and storage engine choices are optimal for your databases.
Some recommend using lower-performing machines for slaves, noting
that the slave does not have as much running on it (typically, slaves only
process SELECT queries, while the
master handles updates to data). However, this is incorrect. In a typical
single master and single slave where all databases are being replicated,
both machines have about the same load, but because the slave is executing
the events in a single thread versus many threads on the master, even
though the workload is the same, the slave may take more time to process
and execute the events.
Perhaps the best way to view this issue is to consider that one of the best uses of replication is failover. If your slaves are slower than your master and if you must fail over in the event that your master suffers a failure, the expectation is that your promoted slave should have the same performance as your demoted master.
Inclusive and Exclusive Replication
You can configure your replication to replicate all data (the default); log only some data or exclude certain data on the master, thereby limiting what is written to the binary log and what is replicated; or you can configure your slave to act on only certain data. Using inclusive or exclusive replication (or both) can help resolve complex load balancing or scale-out issues, making replication more powerful and more flexible. Another name for this process is filtering data, where the combination of the inclusive and exclusive lists form the filter criteria.
On the master, use the --binlog-do-db startup option to specify that you want only events for a certain
database to be written to the binary log. You can specify one or more of
these options, specifying one database per option, on the command line or
in your configuration file.
You can also specify that you want to exclude (ignore) events for a
certain database using the --binlog-ignore-db startup option. You can specify one or more of these options,
specifying one database per option, on the command line or in your
configuration file. This option tells the master to not log any events
that act on the database(s) listed.
Note
You can use the --binlog-do-db
and --binlog-ignore-db options
together, provided the databases listed do not overlap. If a database
name appears on both lists, the database in the --binlog-ignore-db list is ignored. Be sure to
check the values of these variables when diagnosing data replication
issues (e.g., missing data on the slave).
Additionally, when you use the --binlog-do-db or --binlog-ignore-db options, you are filtering
what goes into the binary log. This severely limits the use of
PITR, because you can only recover what was written to the
binary log.
There are several options you can use to control which data is replicated on the slave. There are companion options for the binlog options on the master, options to restrict at the table level, and even a command to do a transformation (rename).
Performing inclusive or exclusive replication on the slave may not improve performance of replication across the topology. While the slaves may store less data, the same amount of data is transmitted by the master, and the overhead of doing the filter on the slave may not gain much if the inclusive and exclusive lists are complex. If you are worried about transmitting too much data over the network, it is best to perform the filtering on the master.
On the slave, you can specify that you want to include only those
events for a certain database to be read and executed from the relay log
with the --replicate-do-db
startup option. You can specify one or more of these options,
specifying one database per option, on the command line or in your
configuration file. This option tells the slave to execute only those
events that act on the database(s) listed.
You can also specify that you want to exclude (ignore) events for a
certain database using the --replicate-ignore-db startup option. You can specify one or more of these options,
specifying one database per option, on the command line or in your
configuration file. This option tells the slave to not execute any events
that act on the database(s) listed.
Warning
The replicate options on the slave behave differently depending on
which format you use. This is especially important for statement-based
replication and could lead to data loss. For example, if you are using
statement-based replication and you use the --replicate-do-db option, the slave restricts
events to only those statements following the USE <db> command. If you issue a statement for a
different database without a change of database, the statement is
ignored. See the online MySQL Reference Manual for
additional details about these limitations.
You can perform inclusive and exclusive replication on the slave at
the table level. Use the --replicate-do-table and --replicate-ignore-table options to execute or ignore only those events for a specific table.
These commands are very handy if you have a table with sensitive data that
isn’t used by your application but is critical to administration or other
special functions. For example, if you have an application that includes
pricing information from your vendors (what you pay for something), you
may want to hide that information if you employ or contract out sales
services. Rather than building a special application for your contractors,
you can deploy your existing application so that it uses a slave that
replicates everything, excluding the tables that contain the sensitive
information.
There are also forms of the last two options that permit the use of
wildcard patterns. These options, replicate-wild-do-table and replicate-wild-ignore-table, perform the same functionality as their namesakes, but support the
use of wildcards. For example, --replicate-wild-do-table=db1.tbl% executes
events for any tables that start with “tbl” in db1
(e.g., tbl, tbl1,
tbl_test). Similarly, you can use --replicate-wild-do-table=db1.% to execute
events for any object in the db1 database. These
wildcard versions of the slave-side filtering can be another asset when
solving complex replication scenarios.
There is also a transformation option you can use on the slave to
rename or change the name of a database for table operations on the slave.
It applies only to tables. You can do this using the --replicate-rewrite-db="<from>-><to>"
option (you must use the quotes). This option only changes the name of
the database for table events; it does not change the names for commands
like CREATE DATABASE, ALTER DATABASE, and so on. It only affects
events for which a database is specified (or to redirect the default
database for statement-based replication). You can use this option more
than once for multiple database name transformations.
Replication Threads
Before we explore monitoring of the master and slave, we should reexamine the threads involved in replication. We present these again here from the perspective of monitoring and diagnosing problems.
There are three threads that control replication. Each performs a
specific role. On the master, there is a single thread per connected slave
called the Binlog Dump thread.
It is responsible for sending the binlog events to the connected slaves.
On the slave, there are two threads, the Slave IO thread and
the Slave SQL thread. The I/O thread is
responsible for reading the incoming binlog events from the master and
writing them to the slave’s relay log. The SQL thread is responsible for
reading the events in the relay log and executing them.
You can monitor the current state of the Binlog Dump thread using the SHOW PROCESSLIST command:
mysql> SHOW PROCESSLIST G
*************************** 1. row ***************************
     Id: 1
   User: rpl
   Host: localhost:54197
     db: NULL
Command: Binlog Dump
   Time: 25
  State: Master has sent all binlog to slave; waiting for binlog to be updated
   Info: NULL
Notice the State column. The data presented here is a
description of what the master is doing with respect to the binary log and the slaves. This example is a typical result
for a well-running replication topology. The display shows the following
columns:
IdDisplays the connection ID.
UserDisplays the user who ran the statement.
HostThe host where the statement originated.
dbThe default database if specified; otherwise,
NULLis displayed, indicating no default database was specified.CommandThe type of command the thread is running. See the online MySQL Reference Manual for more information.
TimeThe time (in seconds) that the thread has been in the reported state.
StateThe description of the current action or state (e.g., waiting). This is normally a descriptive text message.
InfoThe statement the thread is executing.
NULLindicates no statement is in progress. This is the case for the replication threads when they are in waiting states.
You can also see the thread status on the slave. You can monitor the I/O and SQL threads
using the SHOW PROCESSLIST
command:
mysql> SHOW PROCESSLIST G
*************************** 1. row ***************************
     Id: 2
   User: system user
   Host:
     db: NULL
Command: Connect
   Time: 127
  State: Waiting for master to send event
   Info: NULL
*************************** 2. row ***************************
     Id: 3
   User: system user
   Host:
     db: NULL
Command: Connect
   Time: 10
  State: Slave has read all relay log; waiting for the slave I/O thread to
         update it
   Info: NULL
Again, the State column contains
the most important information. If you are having problems with
replication on your slave, be sure to issue the SHOW PROCESSLIST command on the slave and take
note of the I/O and SQL thread states. In this example, we see the normal
states of a slave waiting for information from the master (I/O thread) and
having executed all events in the relay log (SQL thread).
Note
It is always a good idea to use the SHOW
PROCESSLIST command to check the status of the replication
when troubleshooting.
Monitoring the Master
There are several ways to monitor your master. You can issue SHOW commands to see status information and
status variables or use MySQL Workbench. The primary SQL commands include
SHOW MASTER STATUS, SHOW BINARY LOGS, and SHOW BINLOG EVENTS.
In this section, we will examine the SQL commands available for
monitoring the master and provide a brief summary of the available status
variables you can monitor either by using the SHOW STATUS command or by creating custom
graphs.
Monitoring Commands for the Master
The SHOW MASTER STATUS command
displays information about the master’s binary log,
including the name and offset position of the current binlog file. This
information is vital in connecting slaves, as we have discussed in
previous chapters. It also provides information about logging
constraints. Example 13-1 shows the
result of a typical SHOW MASTER
STATUS command.
mysql> SHOW MASTER STATUS G
*************************** 1. row ***************************
File: mysql-bin.000002
Position: 156058362
Binlog_Do_DB: Inventory
Binlog_Ignore_DB: Vendor_sales
Executed_Gtid_Set: 87e02a46-5363-11e2-9d4a-ed25ee3d6542
1 row in set (0.00 sec)The data is displayed in the following columns:
FileThis column lists the name of the current binlog file.
PositionThis column lists the current position (next write) in the binary log.
Binlog_Do_DBThis column lists any databases specified by the
--binlog-do-dbstartup option discussed earlier.Binlog_Ignore_DBThis column lists any databases specified by the
--binlog-ignore-dbstartup option discussed earlier.Executed_Gtid_SetThis column lists the GTIDs that have been executed on the master. This column is valid on servers that have GTIDs enabled. It displays the same values as the
gtid_executedserver variable.
The SHOW BINARY LOGS command
(also known by its alias, SHOW MASTER
LOGS) displays the list of binlog files available on the master and
their sizes in bytes. This command is useful for comparing the
information on the slave concerning where the slave is with respect to
the master (i.e., which binary log the slave is currently reading from
on the master). Example 13-2 shows the results
of a typical SHOW MASTER LOGS
command.
Note
You can rotate the binary log on the master with the FLUSH LOGS command. This command closes and
reopens all logs and opens a new log with an incremented
file extension. You should periodically flush the log to help manage
the growth of logs over time. It also helps with diagnosing
replication problems.
mysql> SHOW MASTER LOGS; +-------------------+-----------+ | Log_name | File_size | +-------------------+-----------+ | master-bin.000001 | 103648205 | | master-bin.000002 | 2045693 | | master-bin.000003 | 1022910 | | master-bin.000004 | 3068436 | +-------------------+-----------+ 4 rows in set (0.00 sec)
You can also use the SHOW BINLOG
EVENTS command to show events in the binary log. The syntax of the
command is as follows:
SHOW BINLOG EVENTS [IN <log>] [FROM <pos>] [LIMIT [<offset>,] <rows>]
Take care when using this command, as it can produce a lot of data. It is best used to compare events on the master with events on the slave read from its relay log. Example 13-3 shows the binlog events from a typical replication configuration.
mysql> SHOW BINLOG EVENTS IN 'master-bin.000001' FROM 2571 LIMIT 4 G
*************************** 1. row ***************************
Log_name: master-bin.000001
Pos: 2571
Event_type: Query
Server_id: 1
End_log_pos: 2968
Info: use `employees`; CREATE TABLE salaries (
emp_no INT NOT NULL,
salary INT NOT NULL,
from_date DATE NOT NULL,
to_date DATE NOT NULL,
KEY (emp_no),
FOREIGN KEY (emp_no) REFERENCES employees (emp_no)
ON DELETE CASCADE,
PRIMARY KEY (emp_no, from_date)
)
*************************** 2. row ***************************
Log_name: master-bin.000001
Pos: 2968
Event_type: Query
Server_id: 1
End_log_pos: 3041
Info: BEGIN
*************************** 3. row ***************************
Log_name: master-bin.000001
Pos: 3041
Event_type: Query
Server_id: 1
End_log_pos: 3348
Info: use `employees`; INSERT INTO `departments` VALUES
('d001','Marketing'),('d002','Finance'),('d003','Human Resources'),
('d004','Production'),('d005','Development'),('d006','Quality
Management'),('d007','Sales'),('d008','Research'),('d009',
'Customer Service')
*************************** 4. row ***************************
Log_name: master-bin.000001
Pos: 3348
Event_type: Xid
Server_id: 1
End_log_pos: 3375
Info: COMMIT /* xid=17 */
4 rows in set (0.01 sec)In this example, we are using statement-based replication. Had we used row-based replication, the binlog events would have looked very different. You can see the difference in Example 13-4.
mysql> SHOW BINLOG EVENTS IN 'master-bin.000001' FROM 2571 LIMIT 4 G
*************************** 1. row ***************************
Log_name: master-bin.000001
Pos: 2571
Event_type: Query
Server_id: 1
End_log_pos: 2968
Info: use `employees`; CREATE TABLE salaries (
emp_no INT NOT NULL,
salary INT NOT NULL,
from_date DATE NOT NULL,
to_date DATE NOT NULL,
KEY (emp_no),
FOREIGN KEY (emp_no) REFERENCES employees (emp_no) ON DELETE CASCADE,
PRIMARY KEY (emp_no, from_date)
)
*************************** 2. row ***************************
Log_name: master-bin.000001
Pos: 2968
Event_type: Query
Server_id: 1
End_log_pos: 3041
Info: BEGIN
*************************** 3. row ***************************
Log_name: master-bin.000001
Pos: 3041
Event_type: Table_map
Server_id: 1
End_log_pos: 3101
Info: table_id: 15 (employees.departments)
*************************** 4. row ***************************
Log_name: master-bin.000001
Pos: 3101
Event_type: Write_rows
Server_id: 1
End_log_pos: 3292
Info: table_id: 15 flags: STMT_END_F
4 rows in set (0.01 sec)Notice there is far less information to see in the binary log of a row-based format. It can sometimes be beneficial to switch to a statement-based row format when diagnosing complex problems with data corruption or intermittent failures. For example, it may be helpful to see exactly what is written to the binary log on the master and compare that to what is read from the relay log on the slave. If there are differences, they could be easier to find in a statement-based format than in a row-based format where the data is in a machine-readable format. See Chapter 3 for more details about the formats of the binary log and the advantages and trade-offs of using one versus the other.
Tip
The mysqlbinlog tool includes the --verbose option, which constructs SQL
commands from row events. Use this option when exploring row-based log
events to discover more information about each event. Note that the
reconstructed SQL statements are not complete in the sense that they
are identical to the original query. Thus, the use of this option is
not a complete reconstruction of the events from row format to
SQL.
Master Status Variables
There are only a couple status variables for monitoring the master (these are limited to counters that indicate how many times a master-related command has been issued on the master):
Com_change_masterShows the number of times the
CHANGE MASTERcommand was issued. If this value changes frequently or is significantly higher than the number of your servers times the number of scheduled restarts on your slaves, you may have a situation where additional slaves are being restarted too frequently; this can be an indication of unstable connectivity.Com_show_master_statusShows the number of times the
SHOW MASTER STATUScommand was issued. As withCom_change_master, high values of this counter can indicate an unusual number of inquiries for reconnecting slaves.
Monitoring Slaves
There are several ways to monitor your slaves. You can issue SHOW commands to see status information and
status variables or use MySQL Workbench. The primary SQL commands include
SHOW SLAVE STATUS, SHOW BINARY LOGS, and SHOW BINLOG EVENTS.
In this section, we will examine the SQL commands available for
monitoring a slave and give a brief summary of the available status
variables that you can monitor with either the SHOW STATUS command
or by creating custom graphs with the MySQL Workbench. We will look at the MySQL Workbench in
Replication Monitoring with MySQL Workbench.
Monitoring Commands for the Slave
The SHOW SLAVE STATUS command
displays information about the slave’s binary log, its connection
to the server, and replication activity, including the name and offset
position of the current binlog file. This information is vital in
diagnosing slave performance, as we have seen in previous chapters.
Example 13-5 shows the result of a
typical SHOW SLAVE STATUS command
executed on a server running MySQL version 5.6.
mysql> SHOW SLAVE STATUS G
*************************** 1. row ***************************
Slave_IO_State: Waiting for master to send event
Master_Host: localhost
Master_User: rpl
Master_Port: 3306
Connect_Retry: 60
Master_Log_File: mysql-bin.000002
Read_Master_Log_Pos: 39016226
Relay_Log_File: relay-bin.000004
Relay_Log_Pos: 9353715
Relay_Master_Log_File: mysql-bin.000002
Slave_IO_Running: Yes
Slave_SQL_Running: Yes
Replicate_Do_DB:
Replicate_Ignore_DB:
Replicate_Do_Table:
Replicate_Ignore_Table:
Replicate_Wild_Do_Table:
Replicate_Wild_Ignore_Table:
Last_Errno: 0
Last_Error:
Skip_Counter: 0
Exec_Master_Log_Pos: 594
Relay_Log_Space: 1008
Until_Condition: None
Until_Log_File:
Until_Log_Pos: 0
Master_SSL_Allowed: No
Master_SSL_CA_File:
Master_SSL_CA_Path:
Master_SSL_Cert:
Master_SSL_Cipher:
Master_SSL_Key:
Seconds_Behind_Master: 0
Master_SSL_Verify_Server_Cert: No
Last_IO_Errno: 0
Last_IO_Error:
Last_SQL_Errno: 0
Last_SQL_Error:
Replicate_Ignore_Server_Ids:
Master_Server_Id: 2
Master_UUID: 87e02a46-5363-11e2-9d4a-ed25ee3d6542
Master_Info_File: /Users/cbell/source/temp_13002/master.info
SQL_Delay: 0
SQL_Remaining_Delay: NULL
Slave_SQL_Running_State: Slave has read all relay log; waiting for the slave
I/O thread to update it
Master_Retry_Count: 86400
Master_Bind:
Last_IO_Error_Timestamp:
Last_SQL_Error_Timestamp:
Master_SSL_Crl:
Master_SSL_Crlpath:
Retrieved_Gtid_Set: 87e02a46-5363-11e2-9d4a-ed25ee3d6542:1-2
Executed_Gtid_Set: 87e02a46-5363-11e2-9d4a-ed25ee3d6542:1-2,
d28c2ea6-5362-11e2-9d45-c78c6761ae47:1
Auto_Position: 1
1 row in set (0.00 sec)There is a lot of information here. This is the most important command for replication. It is a good idea to study the details of each item presented. Rather than listing the information item by item, we present the information from the perspective of an administrator (i.e., the information is normally inspected with a specific goal in mind). Thus, we group the information into categories for easier reference. These categories include master connection information, slave performance, log information, filtering, log performance, and error conditions.
The first row contains the most important information: the current status of the I/O thread. The status can be connecting to the master, waiting for events from the master, reconnecting to the master, and so on.
The information displayed about the master connection includes the current hostname of the master, the user account used to connect, and the port the slave is connected to on the master. Toward the bottom of the listing is the SSL connection information (if you are using an SSL connection).
The next category includes information about the binary log on the
master and the relay log on the slave. The filename and position of each
are displayed. It is important to note these values whenever you
diagnose replication problems. Of particular note is Relay_Master_Log_File, which shows the
filename of the master binary log where the most recent event from the
relay log has been executed.
Replication filtering configuration lists all of the slave-side replication filters. Check here if you are uncertain how your filters are set up.
Also included is the last error number and text for the slave and the I/O and SQL threads. Beyond the state values for the slave threads, this information is most often examined when there is an error. It can be helpful to check this information first when encountering errors on the slave, before examining the error log, as this information is the most current and normally gives you the reason for the failure.
There is also information about the configuration of the slave,
including the settings for the skip counter and the until conditions. See the MySQL Reference
Manual for more information about these fields.
Near the bottom of the list is the current error information. This includes errors for the slave’s I/O and SQL threads. These values should always be 0 for a properly functioning slave.
Some of the more important performance columns are discussed in more detail here:
Connect_RetryThe number of seconds that expire between retry connect attempts. This value should always be low, but you may want to set it higher if you have a case where the slave is having issues connecting to the master.
Exec_Master_Log_PosThis shows the position of the last event executed from the master’s binary log.
Relay_Log_SpaceThe total size of all of the relay logfiles. You can use this to determine if you need to purge the relay logs in the event you are running low on disk space.
Seconds_Behind_MasterThe number of seconds between the time an event was executed and the time the event was written in the master’s binary log. A high value here can indicate significant replication lag. We discuss replication lag in an upcoming section.
Note
The value for
Seconds_Behind_Mastercould become stale when replication stops due to network failures, loss of heartbeat from the master, and so on. It is most meaningful when replication is running.Retrieved_Gtid_SetThe list of GTIDs (transactions) received by this slave. If the list of GTIDs received does not match the executed GTIDs on the master, the slave may be lagging behind reading events from the master. This value is empty when GTIDs are turned off.
Executed_Gtid_SetThe list of GTIDs (transactions) executed on the slave. If the list does not match
Retrieved_Gtid_Set, it may indicate that the slave has not executed all of the transactions or there are transactions that originated on the slave. This value is empty when GTIDs are turned off.
If your replication topology is using GTIDs, Retrieved_Gtid and Executed_Gtid_Set can be very important when
determining missing transactions or significant slave lag. See the
online MySQL Reference Manual section titled “Replication with Global
Transaction Identifiers” for more information about GTIDs and how to
manage transactions among servers in the topology.
If your slave has binary logging enabled, the SHOW BINARY LOGS
command displays the list of binlog files available on the slave and
their sizes in bytes. Example 13-6 shows the results
of a typical SHOW BINARY LOGS
command.
Note
You can rotate the relay log on the slave by using the FLUSH LOGS command.
mysql> SHOW BINARY LOGS; +------------------+-----------+ | Log_name | File_size | +------------------+-----------+ | slave-bin.000001 | 5151604 | | slave-bin.000002 | 1030108 | | slave-bin.000003 | 1030044 | +------------------+-----------+ 3 rows in set (0.00 sec)
You can also use the SHOW BINLOG EVENTS
command to show events in the binary log on the slave, if the slave has
binary logging enabled and the log_slave_updates option is specified. Example 13-7 shows the binlog
events from a typical replication configuration.
In MySQL versions 5.5 and later, you can also inspect the
slave’s relay log with SHOW
RELAYLOG EVENTS.
mysql> SHOW BINLOG EVENTS IN 'slave-bin.000001' FROM 2701 LIMIT 2 G
*************************** 1. row ***************************
Log_name: slave-bin.000001
Pos: 2701
Event_type: Query
Server_id: 1
End_log_pos: 3098
Info: use `employees`; CREATE TABLE salaries (
emp_no INT NOT NULL,
salary INT NOT NULL,
from_date DATE NOT NULL,
to_date DATE NOT NULL,
KEY (emp_no),
FOREIGN KEY (emp_no) REFERENCES employees (emp_no) ON DELETE CASCADE,
PRIMARY KEY (emp_no, from_date)
)
*************************** 2. row ***************************
Log_name: slave-bin.000001
Pos: 3098
Event_type: Query
Server_id: 1
End_log_pos: 3405
Info: use `employees`; INSERT INTO `departments` VALUES
('d001','Marketing'),('d002','Finance'),
('d003','Human Resources'),('d004','Production'),
('d005','Development'),('d006','Quality Management'),
('d007','Sales'),('d008','Research'),
('d009','Customer Service')
2 rows in set (0.01 sec)Slave Status Variables
There are only a few status variables for monitoring the slave. These include counters that indicate how many times a slave-related command was issued on the master and statistics for key slave operations. The first four listed here are simply counters of the various slave-related commands. The values should correspond with the frequency of the maintenance of your slaves. If they do not, you may want to investigate the possibility that there are more slaves in your topology than you expected or that a particular slave is being restarted too frequently. The variables include the following:
Com_show_slave_hostsThe number of times the
SHOW SLAVE HOSTScommand was issued.Com_show_slave_statusThe number of times the
SHOW SLAVE STATUScommand was issued.Com_slave_startCom_slave_stopSlave_heartbeat_periodThe current configuration for the number of seconds that elapse between heartbeat checks of the master.
Slave_last_heartbeatThe most recent heartbeat event received. It is displayed as a timestamp value. If the current value is less than the current value plus
Slave_heartbeat_period, the heartbeat event may be delayed. Significant lag can indicate a possible connection problem with the master.Slave_open_temp_tablesThe number of temporary tables the slave’s SQL thread is using. A high value can indicate the slave is overburdened.
Slave_received_heartbeatsThe count of heartbeat replies from the master. This value should correspond roughly to the elapsed time since the slave was restarted divided by the heartbeat interval.
Slave_retried_transactionsThe number of times the SQL thread has retried transactions since the slave was started.
Slave_runningSimply displays
ONif the slave is connected to the master and the I/O and SQL threads are executing without error. Otherwise displaysOFF.
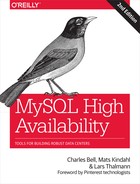
Replication Monitoring with MySQL Workbench
You have seen how you can use MySQL Workbench to monitor network traffic and storage engines. MySQL Workbench can display the status variables and system variables using an easy to navigate set of lists. Figure 13-1 shows the MySQL Workbench system administration status and system variables page highlighting the replication status variables. You can use this page to quickly see how your replication is reporting status.
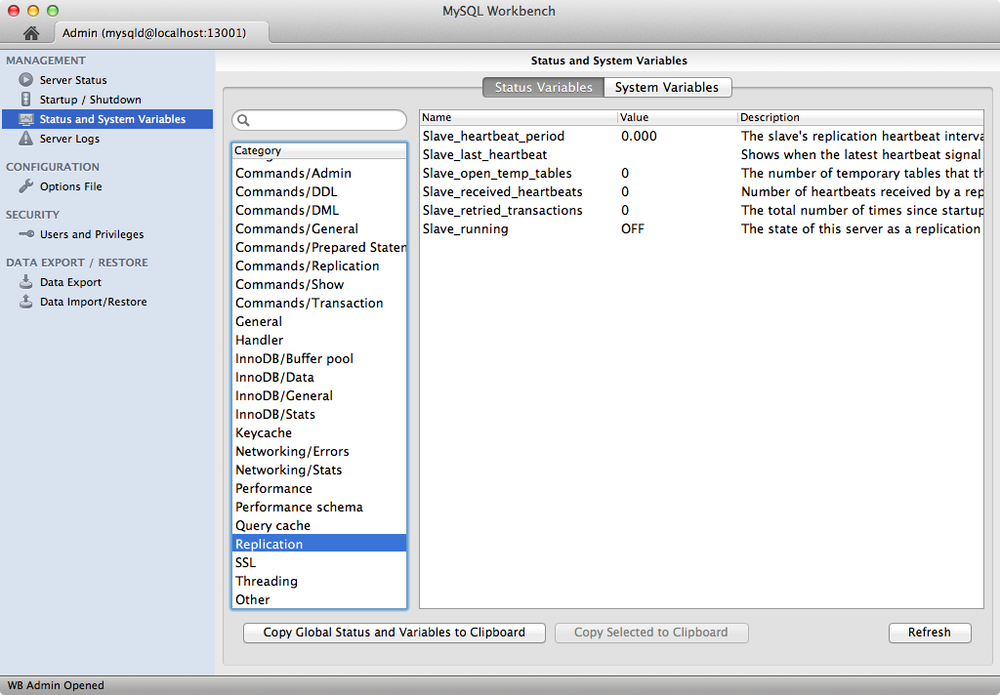
MySQL Workbench also permits you to see the replication system
variables and their values. If you click on the System Variables tab, you
will see a long list of categories on the left. Choosing any of the
replication categories will show the associated system variables. Figure 13-2 shows the replication slave system variables.
Notice the [rw] prefix on some of the
variables. This indicates the variables are read/write and therefore ones
you can change at runtime.
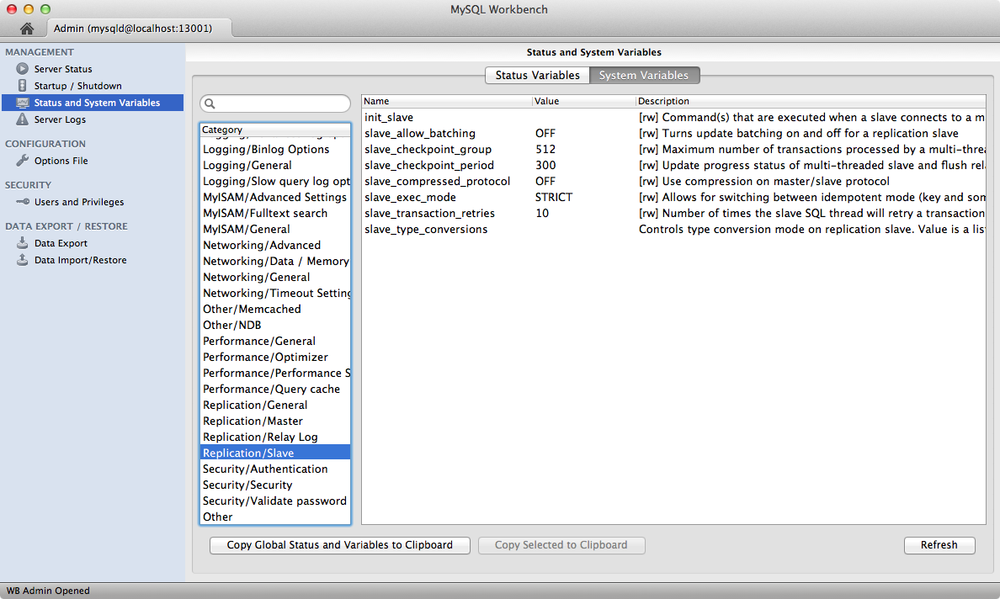
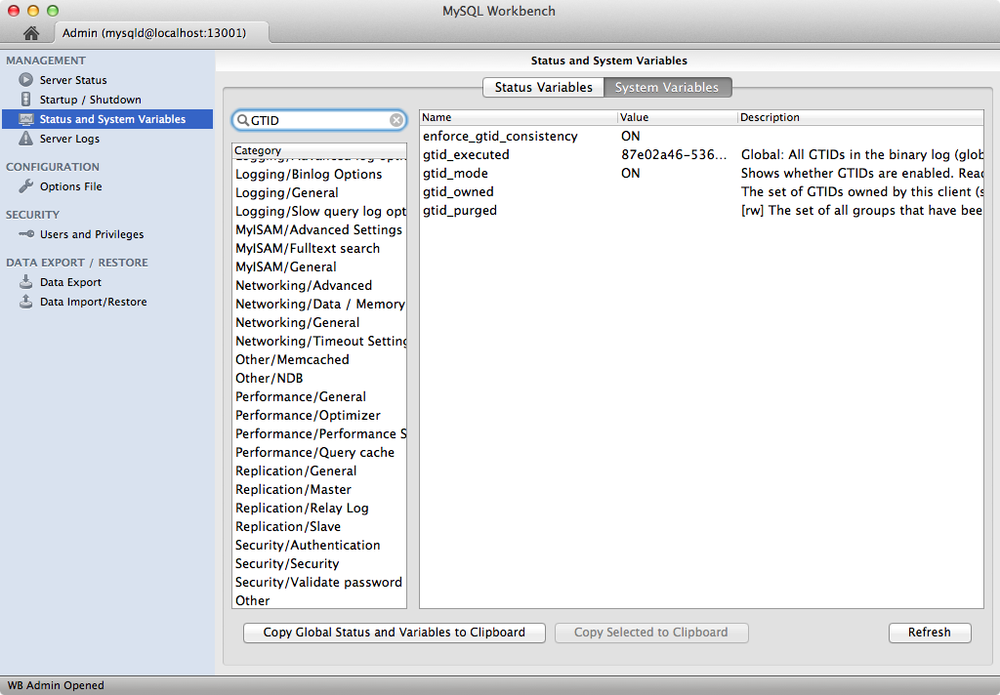
The system administration feature also allows you to search for status and variables. Currently, MySQL Workbench version 5.2.45 does not group the GTID variables under the replication categories. But you can search for the GTID variables as shown in Figure 13-3. In this way, regardless of which version of MySQL Workbench you are using, you can access any status or system variable that may have been added to the system or that Workbench does not group as you expect.
Chapter 11 has a brief tutorial on the use of MySQL Workbench. To learn more about how to use the system administration features of MySQL Workbench, see the online reference manual.
Other Items to Consider
This section discusses some additional considerations for monitoring replication. It includes special networking considerations and monitoring lag (delays in replication).
Networking
If you have limited networking bandwidth, high contention for the bandwidth, or simply a very slow connection, you can
improve replication performance by using compression. You can configure
compression using the slave_compressed_protocol variable.
In cases where network bandwidth is not a problem but you have
data that you want to protect while in transit from the master to the
slaves, you can use an SSL connection. You can configure the SSL
connection using the CHANGE MASTER
command. See the section titled “Setting Up Replication Using SSL” in
the online MySQL Reference
Manual for details on using SSL connections in
replication.
Another networking configuration you may want to consider is using
master heartbeats. You have seen where this information is shown on the
SHOW SLAVE STATUS command. A
heartbeat is a mechanism to automatically check connection
status between a master and a slave. It can detect levels of
connectivity in milliseconds. Master heartbeat is used in replication
scenarios where the slave must be kept in sync with the master with
little or no delay. Having the capability to detect when a threshold
expires ensures the delay is identified before replication is halted on
the slave.
You can configure master heartbeat using a parameter in the CHANGE MASTER
command with the master_heartbeat_period=<value> setting, where the value is the number of seconds at which you want the
heartbeat to occur. You can monitor the status of the heartbeat with the
following commands:
SHOW STATUS like 'slave_heartbeat period' SHOW STATUS like 'slave_received_heartbeats'
Monitor and Manage Slave Lag
Periods of massive updates, overburdened slaves, or other significant network performance events can cause your slaves to lag behind the master. When this happens, the slaves are not processing the events in their relay logs fast enough to keep up with the changes sent from the master.
As you saw with the SHOW SLAVE STATUS
command, Seconds_Behind_Master can
show indications that the slave is running behind the master. This field
tells you by how many seconds the slave’s SQL thread is behind the
slave’s I/O thread (i.e., how far behind the slave is in processing the
incoming events from the master). The slave uses the timestamps of the
events to calculate this value. When the SQL thread on the slave reads
an event from the master, it calculates the difference in the timestamp. The following excerpt shows a condition in
which the slave is 146 seconds behind the master (in this case, the
slave is more than two minutes behind, which can be a problem if your
application is relying on the slaves to provide timely
information):
mysql> SHOW SLAVE STATUS G
...
Seconds_Behind_Master: 146
...The SHOW PROCESSLIST command
(run on the slave) can also provide an indication of how
far behind the slave is. Here, we see the number of seconds that the SQL
thread is behind, measured using the difference between the timestamp of
the last replicated event and the real time of the slave. For example,
if your slaves have been offline for 30 minutes and have reconnected to
the master, you would expect to see a value of approximately 1,800
seconds in the Time field of the
SHOW PROCESSLIST results. The
following excerpt shows this condition (large values in this field are
indicative of significant delays that can result in stale data on the
slaves):
mysql> SHOW PROCESSLIST G
...
   Time: 1814
...
Depending on how your replication topology is designed, you may be
replicating data for load balancing. In this case, you typically use
multiple slaves, directing a portion of the application or users to the
slaves for SELECT queries, thereby
reducing the burden on the master.
Causes and Cures for Slave Lag
Slave lag can be a nuisance for some replication users. The main reason for lag is the single-threaded nature of the slave (actually, there are two threads, but only one executes events and this is the main culprit in slave lag). For example, a master with a multiple-core CPU can run multiple transactions in parallel and will be faster than a slave that is executing transactions (events from the binary log) in a single thread. We have already discussed some ways to detect slave lag. In this section, we discuss some common causes and solutions for reducing slave lag.
Tip
These issues can be mitigated by using the multithreaded slave feature.
There are several causes for slave lag (e.g., network latency). It is possible the slave I/O thread is delayed in reading events from the logs. The most common reason for slave lag is simply that the slave has a single thread to execute all events, whereas the master has potentially many threads executing in parallel. Some other causes include long-running queries with inefficient joins, I/O-bound reads from disk, lock contention, and InnoDB thread concurrency issues.
Now that you know more about what causes slave lag, let us examine some things you can do to minimize it:
- Organize your data
You can see performance improvements by normalizing your data and by using sharding to distribute your data. This helps eliminate duplication of data, but as you saw in Chapter 11, duplication of some data (such as lookup text) can actually improve performance. The idea here is to use just enough normalization and sharding to improve performance without going too far. This is something only you, the owner of the data, can determine either through experience or experimentation.
- Divide and conquer
We know that adding more slaves to handle the queries (scale-out) is a good way to improve performance, but not scaling out enough could still result in slave lag if the slaves are processing a much greater number of queries. In extreme cases, you can see slave lag on all of the slaves. To combat this, consider segregating your data using replication filtering to replicate different databases among your slaves. You can still use scale-out, but in this case you use an intermediary slave for each group of databases you filter, then scale from there.
- Identify long-running queries and refactor them
If long-running queries are the source of slave lag, consider refactoring the query or the operation or application to issue shorter queries or more compact transactions. However, if you use this technique combined with replication filtering, you must use care when issuing transactions that span the replication filter groups. Once you divide a long-running query that should be an atomic operation (a transaction) across slaves, you run the risk of causing data integrity problems.
- Load balancing
You can also use load balancing to redirect your queries to different slaves. This may reduce the amount of time each slave spends on answering queries, thereby leaving more computational time to process replication events.
- Ensure you are using the latest hardware
Clearly, having the best hardware for the job normally equates to better performance. At the very least, you should ensure your slave servers are configured to their optimal hardware capabilities and are at least as powerful as the master.
- Reduce lock contention
Table locks for MyISAM and row-level locks for InnoDB can cause slave lag. If you have queries that result in a lot of locks on MyISAM or InnoDB tables, consider refactoring the queries to avoid as many locks as possible.
Working with GTIDs
If you are using GTIDs, you can use the GTID system variables on the master and slave to verify that transactions have been executed on the master, received by the slave, and executed on the slave. Let us review the system variables associated with GTIDs. The following lists the system variables, their uses, and notes on how to use them in monitoring and troubleshooting GTID enabled servers:
enforce_gtid_consistencyWhen enabled, the server prohibits unsafe transactions from executing including using the
CREATE TABLE ...
            SELECT
statements andCREATE TEMPORARY TABLEinside transactions. This variable is not a dynamic variable. It is disabled by default, read only, and global in scope.gtid_executedThe variable can be read in either session or global scope. When used in session scope, it shows the set of transactions that are written to the cache in the current session. When used in global scope, it shows the set of all transactions that are logged in the binary log.
gtid_modeShows whether GTIDs are being used (value =
ON). Note that future releases of the server may have additional values for this variable as new GTID features are introduced.gtid_nextDetermines how GTIDs are created. A value of
AUTOMATICindicates GTIDs are created using the standard globally unique mechanism. A value ofANONYMOUSmeans the GTIDs are generated using file and position and therefore are not unique.gtid_ownedThis variable also depends on its scope. When used in session scope, the list holds all GTIDs that are owned by this server. When used in global scope, it displays a list of all GTIDS along with the owner of each GTID.
gtid_purgedThis shows those transactions that have been purged from the binary log. You can use this variable to keep the slave from executing transactions that were executed on the master. For example, if you were copying or restoring data from the master, you would not want any transactions that have already been applied to the data to be executed on the slave when the GTIDs are received then executed. Thus, you can set this variable to include those GTIDs that been applied to the data.
It is not possible to isolate specific GTIDs for specific
databases. Thus, when you do a backup on the master for restoring on the
slave and you read the GTID set on the master, you will get the entire
GTID set. When applied to the slave using this variable, you therefore
tell the slave that all transactions in the GTID
list have been executed. Thus, partial restore of data must be executed
with care. The best solution is always do a full backup on the master
and restore it on the slave, after populating gtid_purged with the GTID list from the
master.
Conclusion
This chapter concludes our discussion of the many ways you can monitor MySQL, and provides a foundation for you to implement your own schedules for monitoring virtually every aspect of the MySQL server.
Now that you know the basics of operating system monitoring, database performance, and MySQL monitoring and benchmarking, you have the tools and knowledge to successfully tune your server for optimal performance.