

CHAPTER 18
The AWR and the Alert System
Exam Objectives
• 062.10.1 Manage the Automatic Workload Repository (AWR)
• 062.10.2 Use the Automatic Database Diagnostic Monitor (ADDM)
• 062.10.3 Describe and Use the Advisory Framework
• 062.10.4 Set Alert Thresholds
• 062.10.5 Use Automated Tasks
A 12c database is largely self-managing. Maintenance tasks run automatically (unless disabled), and diagnostic information is gathered at regular intervals. With earlier releases, monitoring the database to pick up developing problems before they become critical took much time. Identifying and diagnosing performance issues was not only time consuming but also required much skill. Use of the Alert system and the diagnostic advisors, installed as standard in every 12c database, frees the database administrator (DBA) from the necessity of devoting a large amount of effort to this work.
Manage the Automatic Workload Repository
Oracle collects a vast amount of statistical information regarding performance and activity. This information is accumulated in memory and periodically written to disk, specifically, to the tables that make up the Automatic Workload Repository (AWR). The AWR exists as a set of tables and other objects in the SYSAUX tablespace. The AWR is related to the data dictionary, but unlike the data dictionary, the AWR is not essential for the database to function (although it may be necessary for it to function well). Data is written to the AWR, stored for a while, and eventually overwritten with more recent information.
Gathering AWR Statistics
The level of statistics gathered is controlled by the instance parameter STATISTICS_LEVEL. This can be set to BASIC, TYPICAL (which is the default), or ALL. The TYPICAL level will force the collection of all the statistics needed for normal tuning, without collecting any that would adversely impact performance. The BASIC level will disable virtually all statistics, all performance-tuning advisors, and the server-generated Alert system—with no appreciable run-time performance benefit. The ALL level will collect extremely detailed statistics on SQL statement execution; these may occasionally be necessary if you are doing advanced SQL statement tuning, but they may cause a slight performance drop while being collected.

EXAM TIP Setting STATISTICS_LEVEL=BASIC will disable all advisors and the server-generated Alert system.
Statistics are accumulated in memory in data structures within the System Global Area (SGA). This causes no performance impact because the statistics merely reflect what the instance is doing anyway. Periodically (by default, once an hour) they are flushed to disk, specifically, to the AWR. This is known as an AWR snapshot. The flushing to disk is done by the Manageability Monitor (MMON) background process. This use of a background process is the key to the efficiency of the statistics collection process. In earlier releases of the database, accessing performance-tuning statistics was possible only by running queries against various views—the dynamic performance V$ views. Populating these views is an expensive process. The DBA must launch a session against the database and then issue a query. Executing this query forces Oracle to extract data from the SGA and present it to the session in a view. This approach is still possible—all the old views, and many more, are still available—but the AWR approach is far more efficient.
TIP No third-party tool can ever have the direct memory access to the instance that MMON has. If your instance is highly stressed, you should think carefully before using any tuning products other than those provided by Oracle.
MMON has direct access to the memory structures that make up the SGA and therefore the statistics within them. It can extract data from the SGA without the need to go via a session or to execute SQL. The only overhead involved is writing the snapshot of the data to the AWR. By default, this occurs only once an hour and therefore should not have a noticeable effect on run-time performance.
EXAM TIP AWR statistics are saved as a snapshot to the AWR by the MMON process (by default, every 60 minutes). By default, the snapshots are stored for eight days before being overwritten.
The AWR is a set of tables, owned by SYS and located in the SYSAUX tablespace. These tables cannot be relocated. Oracle Corporation supports access to the AWR tables only through the various application programming interfaces (APIs) provided in the form of database management system (DBMS) packages or through various views.
You can think of an AWR snapshot as a copy of the contents of many V$ views at the time the snapshot was taken. However, never forget that the mechanism for copying the information is not to query the V$ views; the information is extracted directly from the data structures that make up the instance. The process that makes the copy is MMON. In addition to information from the dynamic performance (or V$) views, the AWR stores information from the DBA views, populated from the data dictionary. This category of information includes a history of object statistics. Without the AWR, the database would have no long-term record of how objects were changing. The statistics gathered with DBMS_STATS give current information, but it may also be necessary to have a historical picture of the state of the database objects. The AWR can provide this.
Managing the AWR
Snapshots of statistics data are kept in the AWR, by default, for eight days. This period is configurable, and it is also possible to mark a pair of snapshots as a baseline, to be kept indefinitely. Baseline snapshots are not automatically purged. As a rough guide for sizing, if the snapshot collection is left on every hour and the retention time is left on eight days, then the AWR may well require between 200MB and 300MB of space in the SYSAUX tablespace. But this figure is highly variable and will, to a large extent, depend on the number of sessions. Adjusting the AWR settings to save snapshots more frequently will make problem diagnosis more precise. If the snapshots are several hours apart, you may miss peaks of activity (and consequent dips in performance). But gathering snapshots too frequently will increase the size of the AWR and could possibly impact performance because of the increased workload of collecting and saving the information.

TIP It is important to monitor the size and growth of the SYSAUX tablespace and the AWR within it. The Alert system will assist with the first task, and the view V$SYSAUX_OCCUPANTS should be used for the second.
Adjusting the AWR snapshot frequency and retention is done with the PL/SQL API called DBMS_WORKLOAD_REPOSITORY. Figure 18-1 shows examples of using this package. First, a query against the DBA_HIST_WR_CONTROL view shows the current values for snapshot retention and frequency. The values (which are of data type INTERVAL) are the default values. Then a call to the MODIFY_SNAPSHOT_SETTINGS procedure changes them to 30 days and half an hour; the units are minutes. Finally, the CREATE_SNAPSHOT procedure forces the snapshot, which will be made in addition to the regularly scheduled collections. Forcing a snapshot would typically be done immediately before and after launching a job of some kind so that reports can be generated focusing on a particular time frame.
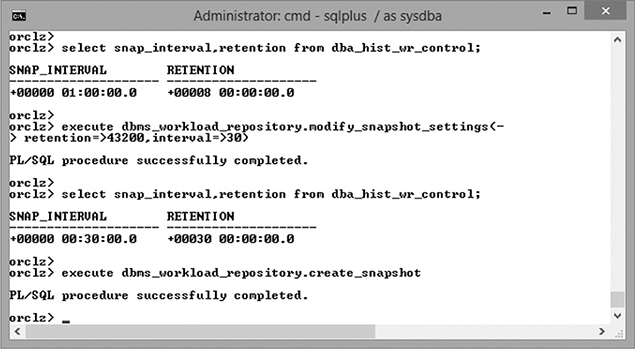
Figure 18-1 How to display and adjust the AWR snapshot settings
EXAM TIP By default, AWR snapshots are taken every hour and saved for eight days. The AWR is located in the SYSAUX tablespace and cannot be relocated to other tablespaces.
Exercise 18-1: Monitor the Automatic Workload Repository In this exercise, you will determine the size of the AWR and monitor its growth as it stores more snapshots. Follow these steps:
1. Connect to your database with SQL*Plus as user SYSTEM.
2. The view V$SYSAUX_OCCUPANTS shows all the components installed into the SYSAUX tablespace. Find out how much space the AWR is taking up.
![]()
Note the size returned.
3. Take an AWR snapshot.
![]()
4. Rerun the query from step 2 and then calculate the increase in size caused by taking the manual snapshot.
5. Find out how many snapshots there are as well as what date range they cover.
![]()
Use the Automatic Database Diagnostic Monitor
The database comes preconfigured with a set of advisors. First among these is the Automatic Database Diagnostic Monitor (ADDM). Studying ADDM reports, which are generated automatically whenever an AWR snapshot is taken, will usually be a regular part of the DBA’s routine. The ADDM reports are of great value in themselves and will highlight problems within the database and suggest solutions, but in many cases the recommendations will include suggesting that you run one or more other advisors. These advisors can give much more precise diagnostic information and advice than the ADDM.
The ADDM looks at data stored in two AWR snapshots. By comparing them, it can summarize the activity during the period between these snapshots and generate a report. The report attempts to detect any possible performance issues and make recommendations that will alleviate them. The issues that the ADDM can identify include the following:
• CPU bottlenecks
• Contention issues such as row locking
• Stress on the I/O system
• High-load SQL
The ADDM runs automatically whenever an AWR snapshot is generated, and it will analyze activity between that snapshot and the preceding snapshot. Therefore, by default, reports are available per hour. It is also possible to generate a report on demand covering the time between any two snapshots. ADDM reports can be retrieved or generated either by using Database Express (click the Performance Hub link on the Performance tab and then select the ADDM subtab) or by running the addmrpt.sql script. This script resides in the ORACLE_HOME/rdbms/admin directory. It presents all available snapshots and prompts for the two snapshot periods over which the report should be generated.
EXAM TIP ADDM reports are generated on demand as well as whenever a snapshot is gathered. A report requires two snapshots.
ADDM reports will sometimes give precise advice (such as to change a parameter) but will more often identify particular statements and advise running another advisor against them. ADDM may also suggest restructuring objects, for example, perhaps to implement partitioning. It will always give reasons for its recommendations, which can be instructive, even if you decide not to implement the advice.
CAUTION ADDM will often recommend using facilities for which you may not be licensed, such as the SQL Tuning Advisor or partitioning. This can be somewhat irritating and in breach of your software license contract.
Exercise 18-2: Generate an ADDM Report In this exercise, you will generate an ADDM report. Follow these steps:
1. Connect to the database as user SYSTEM.
2. Generate the report by running this command from a SQL prompt:
![]()
When prompted, select any two snapshots.
3. Study the report. Note that it is possible that the time frame does not include enough activity to perform any meaningful analysis—if so, try again with a different period.
Describe and Use the Advisory Framework
The advisors rely on activity statistics accumulated by the instance in memory and written to the AWR as snapshots. You can access ADDM and the SQL Tuning Advisor through Database Express (go to the Performance tab of the database home page). The other advisors have PL/SQL interfaces or are visible as data dictionary views. All the advisors are detailed in Chapter 19. For now, the following sections summarize them.
The Memory Advisors
The memory advisors predict the effect of varying the size of memory structures, reporting the estimates in terms of processing time saved (the Shared Pool, Java Pool, and Streams Pool Advisors), disk activity reductions (the Database Buffer Cache Advisor), or both (the PGA Advisor). There is no advisor for the Large Pool. There is, however, an SGA Advisor, which will report on the effect of varying the size of the entire SGA. If memory management has been automated via the parameter MEMORY_TARGET and all other memory parameters have been left at their defaults, an overall memory advisor gives a single point from which to gauge whether allocating more memory to the instance would improve performance.
The memory advisors are exposed through these views:
• V$DB_CACHE_ADVICE The DB Cache advisor
• V$JAVA_POOL_ADVICE The Java Pool advisor
• V$MEMORY_TARGET_ADVICE The Automatic Memory Management advisor
• V$PGA_TARGET_ADVICE The PGA advisor
• V$SGA_TARGET_ADVICE The Shared Memory Management advisor
• V$SHARED_POOL_ADVICE The Shared Pool advisor
• V$STREAMS_POOL_ADVICE The Streams Pool advisor
The SQL Advisors
There are two SQL advisors: the SQL Access Advisor and the SQL Tuning Advisor. The SQL Access Advisor will observe a workload of SQL statements and make recommendations regarding segments so that the workload will run more quickly. The workload can be a hypothetical workload, or it can be derived from the SQL actually executed during a certain time frame. The recommendations can be to create or drop indexes and materialized views and to make use of segment partitioning. The SQL Tuning Advisor can analyze individual statements, as well as recommend schema changes (like the SQL Access Advisor does). It can recommend generating additional statistics on the statement’s execution that will assist the optimizer in choosing the best execution plan and recommend rewriting the statement to eliminate some inefficiencies inherent in some SQL structures.
You can access the SQL advisors through the PL/SQL APIs called DBMS_ADVISOR and DBMS_SQLTUNE. The SQL Tuning Advisor is also accessible through Database Express.
The Automatic Undo Advisor
As discussed in Chapter 6, the Undo Advisor (exposed through the V$UNDOSTAT view) will observe the rate of undo data generation and the length of queries being run, and it will recommend a minimum size for the undo tablespace, which will ensure that queries do not fail with a “snapshot too old” error and that Data Manipulation Language (DML) statements do not fail because of insufficient undo space.
The Mean Time to Recover Advisor
The mechanism for instance recovery after a failure is detailed in Chapter 22. In summary, if the instance terminates in a disorderly fashion (such as a power cut or server reboot while the database is open or just a SHUTDOWN ABORT), then on the next startup it is necessary to reinstate all work in progress that had not been written to the datafiles at the time of the crash. This will happen automatically, but until it is done, users cannot log on. The Mean Time to Recover (MTTR) Advisor (exposed in the V$INSTANCE_RECOVERY view) estimates how long this period of downtime for crash recovery will be, given the current workload.
The Data Recovery Advisor
If the database has been damaged in some way (such as files deleted or data blocks corrupted), it may take some time to identify the problem. Then there will often be several ways of recovering from the situation. For example, if a number of datafiles have been damaged by corruptions appearing on a disk, it will be necessary to find out which files as well as which blocks require recovery. Then a decision must be made as to whether to restore entire files or only the damaged blocks. If the database is protected by a physical standby, switching over to that would also be a possibility.
Following a failure, any DBA (no matter how experienced) will need time to determine the nature and extent of the problem and then need more time to decide upon the course of action that will repair the damage with the minimum disruption to work. The Data Recovery Advisor follows an expert system to advise the DBA on this. The expert system is essentially what the DBA would follow anyway, but the advisor can do it much faster. It is accessed with the DBMS_SQLDIAG package, invoked either through SQL*Plus or from the RMAN Recovery Manager tool.
The Segment Advisor
Segments grow automatically. As rows are inserted into table segments and index keys are inserted into index segments, the segments fill—and then Oracle will allocate more extents as necessary. But segments do not shrink automatically as data is removed or modified with DELETE and UPDATE commands; this happens only when the segment is deliberately reorganized. The Segment Advisor observes tables and indexes—both their current state and their historical patterns of use—and recommends appropriate reorganization when necessary. Invoke the Segment Advisor with the DBMS_ADVISOR package.
The SQL Repair Advisor
Occasionally, a SQL statement can fail because of an internal Oracle error. This will be reported with the ORA-600 error message. If the error condition (which is a polite name for a bug) is encountered only for a particular execution plan, it follows that using a different execution plan could avoid the failure. The SQL Repair Advisor can investigate this and generate a patch to the statement that will force the optimizer to choose a safe plan, rather than a plan that hits the problem.
Set Alert Thresholds
The Alert system is why the Oracle database can now be described as self-managing. In earlier releases, the DBA had to spend a great deal of effort on humdrum work that was essential but not always that interesting. They also had to devise methods of picking up exceptional conditions as they occurred. The Alert system can automate a large amount of work that previously fell into the DBA domain.
Alert Condition Monitoring and Notifications
A typical example of the humdrum work is space management, which, at its most basic, involves monitoring tablespaces to see when they are about to fill up. This could be done with scripts, such as this one:
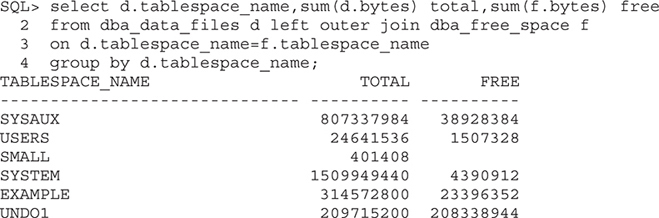
But these scripts are prone to error—or at least, misinterpretation. For example, the view DBA_FREE_SPACE has one row for every bit of free space in every tablespace. But if a tablespace were full, there would be no rows at all. That’s why you need OUTER JOIN, without which the SMALL tablespace would not be listed, even though it is in a critical state. Then consider the effect of enabling AUTOEXTEND on the datafiles. Also, an UNDO tablespace will usually be 100 percent full, but this is not a problem because a large part of the undo data will be inactive and can be overwritten. And what about temporary tablespaces? The query would have to be in a UNION with another query against DBA_TEMP_FILES. This second query would have to work out whether the space occupied by temporary segments is in use or merely waiting to be used.
Many DBAs have written suites of SQL code to report on space usage and raise warnings before error conditions occur. This is fine, but the scripts have to be written, they have to be run regularly, and they have to be updated to take account of changes in technology. Many companies have written and marketed tools to do the same thing. The Alert system replaces a vast amount of this humdrum work. It will monitor many conditions that can cause problems and will send notifications by a variety of methods. With regard to space management, it is by default configured to raise a warning alert when a tablespace reaches 85 percent full and a critical alert when a tablespace is 97 percent full, with account being taken of autoextension and the nature of the contents.
Alerts comes in two forms. Stateful alerts are based on conditions that persist and can be fixed. Examples include tablespace space usage, the number of sessions hanging, and the average time it takes to complete SQL statement execution. Stateless alerts are based on events; they happen and are gone. A query failing with “snapshot too old” and two transactions deadlocking are examples.
To configure the Alert system, you set thresholds. The thresholds are stored in the AWR. Then the MMON background process will monitor the database and the instance, in near real time, and compare the current state with the thresholds. If a threshold is crossed, it will raise the alert. The mechanism by which an alert is raised is simply to put an entry on the alert queue. A queue is a table of messages that other processes can read. What happens to the alert message next is a matter for further configuration. The default behavior is that Enterprise Manager Cloud Control will (if an agent has been installed) dequeue the message and display it on the database home page, but Enterprise Manager can be configured to send e-mails or SMS messages when it finds that an alert has been raised.
You can view the alerts by querying the view DBA_OUTSTANDING_ALERTS, and it is possible to write an alert handler in PL/SQL that will dequeue the messages and take any action desired.
EXAM TIP Alerts are raised by the MMON process, not by Enterprise Manager. Enterprise Manager reads alerts, as can other event handlers written by you or by third parties.
Setting Thresholds
You can set more than 200 metrics for thresholds. They are documented in the view V$METRICNAME, which gives the name of the metric, the units in which it is measured, and the ID number by which it is identified.
There is an API (the DBMS_SERVER_ALERT package) for setting thresholds. Here is an example:
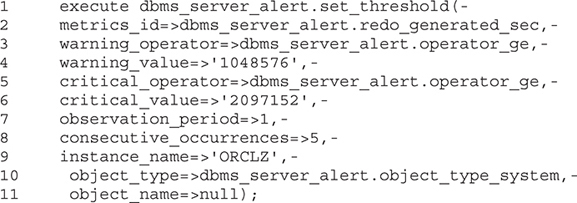
Taking this PL/SQL execution call line by line, here is what happens:
1. The procedure SET_THRESHOLD will create or update an alert threshold.
2. In PL/SQL you may pass either literals or a result returned by a function using the => operator to named parameters (arguments). Here, the metric being set is the rate of redo generation, measured in bytes per second. This is specified by passing the value returned by the dbms_server_alert.redo_generated_sec function to the metrics_id parameter using the => operator.
3. The comparison operator for the warning level, which is “greater than or equal to” is passed to the warning_operator parameter.
4. The value for a warning alert, which is 1MB per second, is passed to the warning_value parameter.
5. The comparison operator for the critical level, which is “greater than or equal to” is passed to the critical_operator parameter.
6. The value for a critical alert, which is 2MB per second, is passed to the critical_value parameter.
7. The observation period, in minutes, is passed to the observation_period parameter.
8. The number of consecutive occurrences before the alert is raised. The literal 5 is passed to the consecutive_occurrences parameter.
9. The instance for which the alert is being configured, ORCLZ, is passed to the instance_name parameter.
10. The type of object to which the alert refers. The result from the function dbms_server_alert.object_type_system is passed to the object_type parameter.
11. The name of the object to which the alert refers. In this case a NULL is provided since an object name is not meaningful to a metric that measures rate of redo generation.
Note that not all the arguments are relevant for all alerts.
The preceding example configures an alert for the rate of redo generation; a warning will be raised if this exceeds 1MB per second, and a critical warning will be raised if it goes over 2MB per second. The observation period is set to a minute and consecutive occurrences to five; this means that if the redo generation happens to hit a high level just a couple of times, it will not be reported—but if it stays at a high level consistently (for five consecutive minutes), it will be reported. Because this metric is one that could vary between instances in a Real Application Clusters (RAC) environment, the instance name must be specified, but the object name is not relevant. If the alert were for tablespace usage, the instance name would not be specified, the object type would be tablespace, and the object name would be set to the name of the tablespace.
When stateful alerts are raised, they are visible as rows in the DBA_OUTSTANDING_ALERTS view. They will remain visible until they are cleared. They may be cleared because the DBA has fixed the problem, or in some cases the problem will go away in the natural course of events. For instance, a tablespace-usage alert would usually require DBA action (such as adding another datafile), whereas an activity-related alert, such as the rate of redo generation, might clear automatically when the activity reduces. When an alert is cleared, it is removed from the DBA_OUTSTANDING_ALERTS view and written to the DBA_ALERT_HISTORY view. Stateless alerts go straight to the history view.
Thresholds are configured by default for tablespace usage and blocking sessions. A space usage warning will be raised when a tablespace is 85 percent full and a critical warning when it is 97 percent full. The warning and critical values for blocked sessions are 2 and 4.
Exercise 18-3: Configure Alerts In this exercise, you will enable an alert for the commit rate and demonstrate its use. Follow these steps:
1. Connect to your database with Database Control as user SYSTEM.
2. Create a rather small tablespace, as follows:
![]()
Given that the datafile will (by default) not autoextend and that each extent is a fixed size, it is impossible for this tablespace to contain more than eight extents.
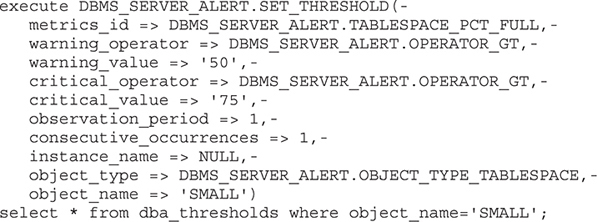
3. Set a space usage alert that will raise a warning when the tablespace is half-full and a critical warning when three-quarters full. Confirm that the threshold has been set.
4. Create a table and fill the tablespace.
![]()
5. Fill the tablespace by allocating extents repeatedly until you receive the error “ORA-01653: unable to extend table SYSTEM.BIG by 16 in tablespace SMALL.”
![]()
6. Query the DBA_OUTSTANDING_ALERTS view. Note that it may take up to 10 minutes for the alert to be raised. This is because the timing of the space management alert is programmed internally and cannot be changed.
![]()
7. Resolve the problem by adding more space to the tablespace.
![]()
8. Confirm that the alert is cleared by querying the DBA_OUTSTANDING_ALERTS and DBA_ALERT_HISTORY views. Again, it may take up to 10 minutes for this to happen.
Use Automated Tasks
The autotask system is a mechanism whereby certain maintenance jobs run automatically. These are jobs that Oracle recommends should be run regularly on all databases.
The Autotasks
There are three autotasks:
• Gathering optimizer statistics
• Running the SQL Tuning Advisor
• Running the Segment Advisor
Optimizer statistics are needed if the optimizer is to generate efficient plans for executing SQL statements. These statistics include information such as how big tables are and the number of distinct values in columns. If these statistics are missing or inaccurate, code will certainly run, but performance may degrade because the execution plans will not be appropriate to the state of the data. For example, using an index to retrieve rows rather than scanning an entire table may or may not be the best way to run a query, depending on the size of the table and the predicate; statistics will let the optimizer make the best decision. Statistics such as these are not static. As the application is used, they will become out of date and should be refreshed. The autotask that gathers statistics will do this. By default, any fresh statistics are made available for use immediately.
The SQL Tuning Advisor autotask identifies high-load SQLs that have been run, using information written to the AWR by snapshots, and attempts to tune them. The results of the tuning are stored in a profile, which is additional information on how best to run the statement that can be used by the optimizer the next time the statement is executed. By default, profiles are generated but are not actually brought into use. If this default is not changed, the DBA should check for any profiles that have been generated and decide whether to implement them. To see the profiles, query the DBA_SQL_PROFILES view.
The Segment Advisor identifies table and index segments that contain a large amount of unused space, which could be released from the segment and returned to the tablespace by reorganizing the segment. Its recommendations cannot be implemented automatically.
Interpreting and implementing the result of the advisors is covered in later chapters on tuning the database and SQL.
Controlling the Autotasks
A prerequisite for running the autotasks is that the STATISTICS_LEVEL parameter should be set to either TYPICAL or ALL. The autotasks are launched by a background process, namely, the ABP0 process. The tasks, if enabled, run within defined windows. The timing of the windows is to open at 22:00 on weekdays and remain open for four hours and to open at 06:00 on weekend days and remain open for 20 hours. These windows are managed by the Scheduler, as described in Chapter 21. The intention is that the autotasks should run at times when the database is less likely to be in use by users. To limit further the impact on users, the resources used by the autotasks are restricted by the Resource Manager (detailed in Chapter 20) such that if the system is stressed, they will take up no more than 25 percent of CPU capacity.
TIP The standard windows for the autotasks assume that your users are American and may not be appropriate in a multinational environment. Just because it is nighttime in the database time zone does not mean that it is nighttime elsewhere. Furthermore, Saturday and Sunday are working days in some parts of the world.
The DBA_AUTOTASK_CLIENT view will show whether the tasks are enabled, and the DBMS_AUTO_TASK_ADMIN package has procedures to enable and disable them, as shown in Figure 18-2.
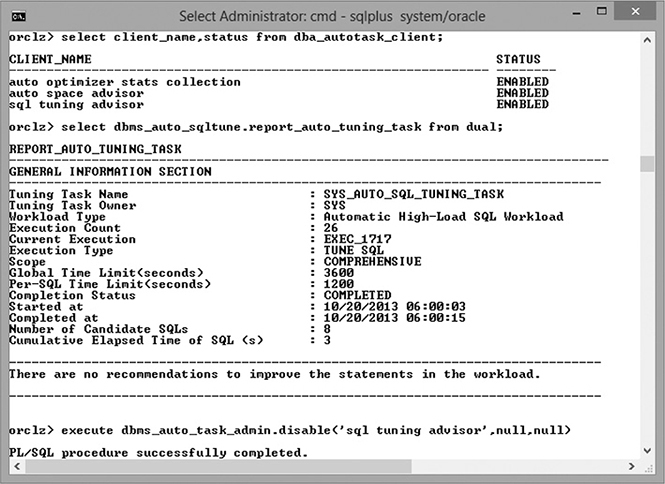
Figure 18-2 Controlling the autotasks
The first query in the figure shows that all three autotasks are enabled. Then the results of the last run of the SQL Tuning Advisor are shown. The advisor identified eight SQL statements as being worthy of attention but decided not to make any recommendations. Finally, the task is disabled.

CAUTION Many databases are running the SQL Tuning autotask every night for no purpose because no one ever looks at the results.
Two-Minute Drill
Manage the Automatic Workload Repository
• By default, snapshots are taken every hour and stored for eight days.
• Additional snapshots can be taken on demand.
• MMON is responsible for creating snapshots and launching the ADDM.
• The AWR consists of tables (and related objects) in the SYS schema, in the SYSAUX tablespace.
• The STATISTICS_LEVEL parameter must be set to TYPICAL or ALL; otherwise, the snapshots will not be made.
Use the Automatic Database Diagnostic Monitor
• The ADDM runs automatically whenever a snapshot is taken and manually on demand.
• ADDM reports will give advice directly and may also recommend running other advisors.
• The ADDM requires two snapshots, generating reports on activity between them.
Describe and Use the Advisory Framework
• A set of advisors is provided for tuning purposes.
• The advisors depend on statistics stored as snapshots in the AWR.
• Access to some advisors is through Enterprise Manager, and all are accessible through views and PL/SQL APIs. By default, the SQL Tuning Advisor and the Segment Advisor will run automatically in the maintenance windows.
Set Alert Thresholds
• Stateful alerts must be configured with thresholds.
• If a stateful alert is raised, it will remain until the situation is cleared; stateless alerts are reported and do not need to be cleared.
• Thresholds are stored in the AWR.
• It is the MMON background process that raises an alert.
• Setting STATISTICS_LEVEL to BASIC will disable server alerts.
Use Automated Tasks
• The autotask framework automates execution of critical maintenance jobs.
• The three autotasks are gathering optimizer statistics, running the SQL Tuning Advisor, and running the Segment Advisor.
• By default, new statistics are published, but the advisor tasks’ recommendations are not implemented.
• The running of the autotasks is controlled by the Scheduler and the Resource Manager.
Self Test
1. The AWR is located in the SYSAUX tablespace. If you suspect that it is growing to such a size that it will fill the SYSAUX tablespace, what actions could you take to reduce the likelihood of this happening? (Choose all correct answers.)
A. Relocate the AWR to a tablespace created specifically for storing it.
B. Reduce the time between snapshots so that less data will be generated by each one.
C. Increase the time between snapshots so that fewer snapshots will be generated.
D. Adjust the scheduling of the automatic maintenance tasks so that they will run less frequently.
2. By default, snapshots are removed from the AWR on a regular basis, making comparisons of activity over a long period of time (such as contrasting this year’s year-end processing with last year’s) impossible. What should you do to make this possible? (Choose the best answer.)
A. Save the year-end snapshots as a baseline.
B. Adjust the snapshot-retention period to the whole period: a little over a year.
C. Set the datafiles that make up the SYSAUX tablespace to AUTOEXTEND so that snapshots will not be purged.
D. Disable purging of snapshots by setting STATISTICS_LEVEL to ALL.
3. When will the ADDM run? (Choose the best answer.)
A. Whenever an alert is raised by the server alert system
B. During the maintenance windows that run the autotasks
C. Following the gathering of an AWR snapshot
D. Only when explicitly requested
4. With regard to the collection of monitoring information, put these steps in the correct order:
A. Data accumulates in the SGA.
B. MMON generates an ADDM report.
C. MMON writes data to the AWR.
D. Reports are purged.
E. Snapshots are purged.
5. Which advisors are run by the autotask system in the maintenance windows? (Choose all correct answers.)
A. The ADDM
B. The memory advisors
C. The Segment Advisor
D. The SQL Access Advisor
E. The SQL Tuning Advisor
F. The Undo Advisor
6. Under which circumstances would the advisors not be available? (Choose the best answer.)
A. If the optimizer statistics-gathering autotask has been disabled
B. If the STATISTICS_LEVEL parameter is set to BASIC
C. If the AWR snapshots have been purged
D. If Enterprise Manager has not been configured
7. Which process raises alerts? (Choose the best answer.)
A. MMON, the Manageability Monitor
B. Enterprise Manager (Database Express or Cloud Control)
C. The server process that detects the problem
D. SMON, the System Monitor
8. End users are complaining that they receive “snapshot too old” error messages when running long queries. You look at the DBA_OUTSTANDING_ALERTS view and don’t see any. Why might this be? (Choose the best answer.)
A. The STATISTICS_LEVEL parameter is set to BASIC.
B. The snapshots for the periods when the errors occurred have been purged.
C. No alert has been configured for “snapshot too old.”
D. “Snapshot too old” is reported in DBA_ALERT_HISTORY.
9. How can you best automate the collection of optimizer statistics? (Choose the best answer.)
A. The MMON process will collect them if STATISTICS_LEVEL is set to TYPICAL or to ALL.
B. An automatic maintenance job will collect them if STATISTICS_LEVEL is set to TYPICAL or to ALL.
C. Enterprise Manager Cloud Control will collect them if the agent is running.
D. Schedule a job to execute the DBMS_STATS.GATHER_DATABASE_STATISTICS procedure.
10. Where are the object statistics used by the query optimizer stored? (Choose the best answer.)
A. With the objects themselves.
B. In the data dictionary.
C. In the AWR.
D. They are accumulated in the shared pool of the SGA.
11. You notice that the autotasks do not appear to be running. Why might this be? (Choose all correct answers.)
A. The STATISTICS_LEVEL parameter is set to BASIC.
B. The tasks have been explicitly disabled.
C. The Enterprise Manager Agent is not running.
D. The tasks have not been scheduled with the DBMS_SCHEDULER package.
E. The tasks have not been scheduled with the DBMS_JOB package.
Self Test Answers
1. ![]() C. Increasing the time between snapshots will reduce the number stored and therefore the space needed.
C. Increasing the time between snapshots will reduce the number stored and therefore the space needed.![]() A, B, and D are incorrect. A is incorrect because it is not possible to relocate the AWR. B is incorrect because the space needed to store a snapshot is not related to the snapshot frequency; this would actually have the opposite effect to that desired. D is incorrect because the automatic maintenance tasks do not control snapshots, and it is snapshots that take up the bulk of the space in the AWR.
A, B, and D are incorrect. A is incorrect because it is not possible to relocate the AWR. B is incorrect because the space needed to store a snapshot is not related to the snapshot frequency; this would actually have the opposite effect to that desired. D is incorrect because the automatic maintenance tasks do not control snapshots, and it is snapshots that take up the bulk of the space in the AWR.
2. ![]() A. This is exactly the type of situation for which baselines are intended.
A. This is exactly the type of situation for which baselines are intended.![]() B, C, and D are incorrect. B would work, but you would need a SYSAUX tablespace the size of Jupiter; it is not a good solution. C is incorrect because the available space has no effect on the retention time. D is incorrect because STATISTICS_LEVEL controls how much information is gathered, not for how long it is kept.
B, C, and D are incorrect. B would work, but you would need a SYSAUX tablespace the size of Jupiter; it is not a good solution. C is incorrect because the available space has no effect on the retention time. D is incorrect because STATISTICS_LEVEL controls how much information is gathered, not for how long it is kept.
3. ![]() C. The ADDM runs automatically whenever a snapshot is generated, contrasting that snapshot with the previous snapshot.
C. The ADDM runs automatically whenever a snapshot is generated, contrasting that snapshot with the previous snapshot.![]() A, B, and D are incorrect. A is incorrect because there is no integration between the alert system and ADDM. B is incorrect because ADDM is not an autotask. D is incorrect because although you can request ADDM reports explicitly, they are also generated automatically.
A, B, and D are incorrect. A is incorrect because there is no integration between the alert system and ADDM. B is incorrect because ADDM is not an autotask. D is incorrect because although you can request ADDM reports explicitly, they are also generated automatically.
4. ![]() A, C, B, E, D is the correct sequence.
A, C, B, E, D is the correct sequence.![]() All other sequences are wrong.
All other sequences are wrong.
5. ![]() C and E. These run in every maintenance window, but implementing the recommendations is up to the DBA.
C and E. These run in every maintenance window, but implementing the recommendations is up to the DBA.![]() A, B, D, and F are incorrect. A is incorrect because MMON invokes the ADDM. B, D, and F are incorrect because they are advisors that must be invoked manually.
A, B, D, and F are incorrect. A is incorrect because MMON invokes the ADDM. B, D, and F are incorrect because they are advisors that must be invoked manually.
6. ![]() B. The advisors are dependent on the STATISTICS_LEVEL.
B. The advisors are dependent on the STATISTICS_LEVEL.![]() A, C, and D are incorrect. A is incorrect because optimizer statistics are not required by the advisors, although they may recommend collecting them. C is incorrect because the advisors can always be invoked using the information currently available in the instance. D is incorrect because although Enterprise Manager can invoke the advisors, there is no dependency between them.
A, C, and D are incorrect. A is incorrect because optimizer statistics are not required by the advisors, although they may recommend collecting them. C is incorrect because the advisors can always be invoked using the information currently available in the instance. D is incorrect because although Enterprise Manager can invoke the advisors, there is no dependency between them.
7. ![]() A. MMON raises alerts by writing a message to the alert queue.
A. MMON raises alerts by writing a message to the alert queue.![]() B, C, and D are incorrect. B is incorrect because Enterprise Manager does not raise alerts; it reports them. C and D are incorrect because neither server sessions nor the SMON are part of the Alert system.
B, C, and D are incorrect. B is incorrect because Enterprise Manager does not raise alerts; it reports them. C and D are incorrect because neither server sessions nor the SMON are part of the Alert system.
8. ![]() D. “Snapshot too old” is a stateless alert and therefore goes directly to the alert history.
D. “Snapshot too old” is a stateless alert and therefore goes directly to the alert history.![]() A, B, and C are incorrect. A is incorrect because the STATISTICS_LEVEL refers to statistics, not alerts. B is incorrect because outstanding alerts do not get purged on any schedule, only by being resolved. C is incorrect because “snapshot too old” is a stateless alert, and thresholds can apply only to stateful alerts.
A, B, and C are incorrect. A is incorrect because the STATISTICS_LEVEL refers to statistics, not alerts. B is incorrect because outstanding alerts do not get purged on any schedule, only by being resolved. C is incorrect because “snapshot too old” is a stateless alert, and thresholds can apply only to stateful alerts.
9. ![]() B. A job will run in the maintenance windows unless STATISICS_LEVEL is set to BASIC.
B. A job will run in the maintenance windows unless STATISICS_LEVEL is set to BASIC.![]() A, C, and D are incorrect. A and C are incorrect because they specify the wrong component to carry out the task. D is incorrect because although you could schedule a job yourself, letting the autotask facility do this is the best option.
A, C, and D are incorrect. A and C are incorrect because they specify the wrong component to carry out the task. D is incorrect because although you could schedule a job yourself, letting the autotask facility do this is the best option.
10. ![]() B. The optimizer uses the latest published statistics, which are stored in the data dictionary.
B. The optimizer uses the latest published statistics, which are stored in the data dictionary.![]() A, C, and D are incorrect. A is incorrect because the statistics are stored independently of the actual segments. C is incorrect because the AWR stores historical values, which are not used for real-time parsing. D is incorrect because the SGA stores the execution plan itself, not the information used to generate it.
A, C, and D are incorrect. A is incorrect because the statistics are stored independently of the actual segments. C is incorrect because the AWR stores historical values, which are not used for real-time parsing. D is incorrect because the SGA stores the execution plan itself, not the information used to generate it.
11. ![]() A and B. Setting STATISTICS_LEVEL=BASIC will disable the autotasks (and a few other things). The tasks can also be disabled with the DBMS_AUTO_TASK_ADMIN.DISABLE procedure.
A and B. Setting STATISTICS_LEVEL=BASIC will disable the autotasks (and a few other things). The tasks can also be disabled with the DBMS_AUTO_TASK_ADMIN.DISABLE procedure.![]() C, D, and E are incorrect. C is incorrect because Enterprise Manager is not required to run autotasks. D and E are incorrect because although the Scheduler and the Resource Manager control when and how autotasks will run, they do not enable or disable them.
C, D, and E are incorrect. C is incorrect because Enterprise Manager is not required to run autotasks. D and E are incorrect because although the Scheduler and the Resource Manager control when and how autotasks will run, they do not enable or disable them.