
The ability to align the people in your operation with the goals of the enterprise is a critical part of leadership. Alignment includes the behaviors of a leader who facilitates the development of a vision and principles with a balanced strategy and goals with the team, develops a balanced scorecard to track progress, and organizes staff and tasks to best accomplish goals. A critical element of innovation involves inclusion of customers and other stakeholders with your team members when developing your strategy. The purpose is to ensure team members are completely aligned with their customers and your organization’s plan. At the very least, stakeholders to invite to the planning session should include key customers and suppliers.
A paper manufacturing operation went through a two-day process to identify their vision and mission with supporting principles. Their work was posted just inside the main entrance of headquarters. The executives found that many potential clients converted to new clients after visiting and learning how this supplier aligned with their values. The process for creating a living strategy aligned with your workforce is shown in Figure 2.1.
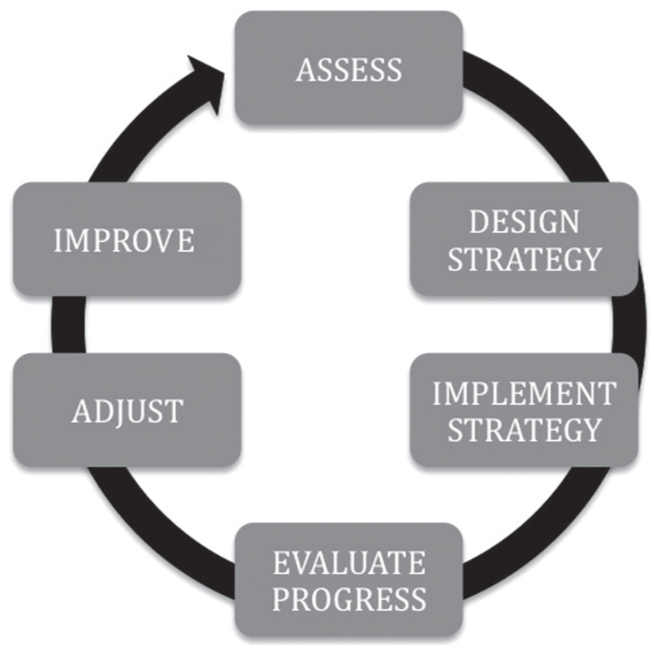
Figure 2.1 Strategy development process
A balanced strategy includes a vision for the future, a mission for accomplishing the vision, principles defining ethical behavior and goals, and tasks identified for accomplishing the vision and mission. For example:
Our vision is to lead our industry. Our mission is to continually innovate through a process of Discovery, Designing Solutions, Implementing Solutions, Evaluating Results, and Continually Improving.
Our Principles:
1. Tell the Truth First, Last, Always
2. Do Right
3. Collaborate and Innovate
4. Open Communication
5. Teamwork at Every Level
6. Continually and Relentlessly Improve
7. Feedback
8. Fact-based Decision Making
9. Transparency
10. Encourage Risk
11. Have Fun
The key elements of strategic goal development involve consideration of the four pillars of an organization including Financials, Operations, Customers, and Employees (Figure 2.2).

Figure 2.2 Balance illustration
Financials include both revenue and expense goals with tasks defined to accomplish those goals. Many organizations believe their task is complete with a set of financial goals and objectives for the year. Nothing could be further from the truth. Such an organization will have good profit margins while operations become obsolete, employees become less skilled, and customers change suppliers. Operational goals could include new or improved equipment, technology changes, and supplier relationships as examples. Customer goals have to do with increasing customer counts, analyzing customers’ purchasing habits and developing new clients while retaining desired existing customers. Employee goals are typically focused on enhancing employee performance, reducing turnover, enhancing skill sets, and recruitment of new talent.
Organizations focusing solely on their financials find the result to be discontented employees and inefficient operations. They may reduce costs but typically lose market share in the process.
Just as misdirected is the organization focusing solely on customers. It may experience market gains but be unable to remain competitive because of poorly maintained operations and low margins. It takes focus on core components of the organization (its four pillars) in order to increase innovation and competitiveness in today’s marketplace.
If your strategy does not consider operations with goals for change or improvement, customers with goals for retaining current customers, and attracting new customers and goals for retaining and improving performance of your human capital, then your organization will have little chance to innovate and sustain itself through the 21st Century.
The process for developing an innovative strategy includes assessing the present state of the organization through discovery. Learning the needs and perspective of an organization’s customers is critical before developing a strategy for serving them. Learning the needs and issues of staff is important in order to best serve the needs of customers in your market place. Considering associates to be part of your customer base and a key link in your customer chain helps when developing your plan of action.
An example of an assessment tool is shown in Figure 2.3. Using this tool, customers are interviewed to identify the products and services used by them. They are then asked to evaluate satisfaction with each item and to offer solutions for improvement. The recommendations are included when developing the strategic plan.
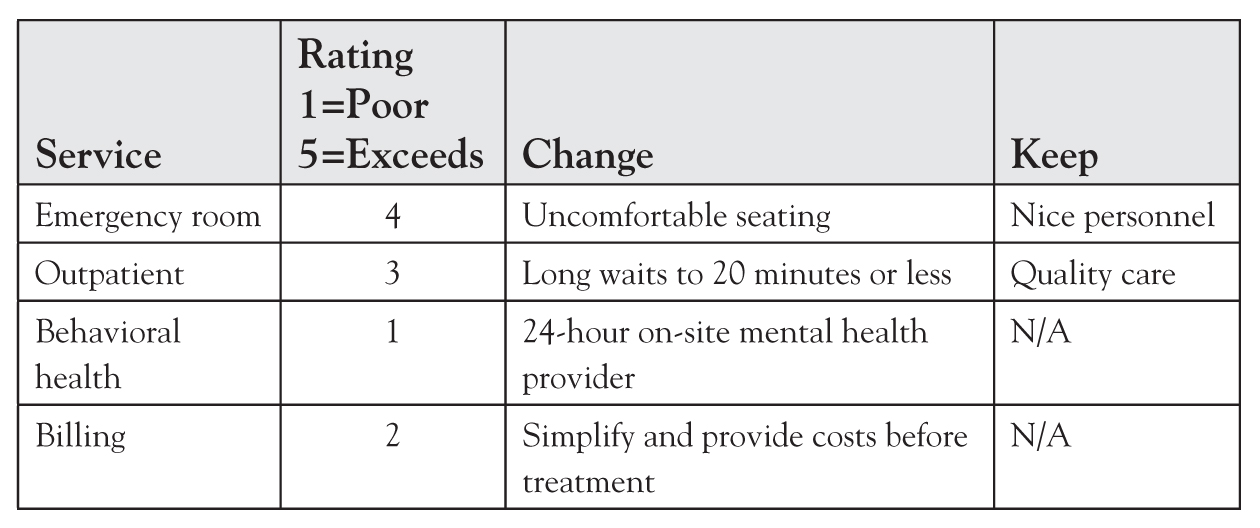
Figure 2.3 Product/service evaluation tool
Survey Guidelines
1. The unit’s employees and customers should be involved and together during the interview process. The process enhances the relationship and communication between suppliers and customers.
2. Unit employees should listen to customer comments and avoid explaining away concerns expressed by customers. If employees defend their actions, customers will become discouraged and simply tell the unit what they want to hear. The only time employees should speak is to ask questions and rephrase customer comments.
3. At the end of the interview, employees should thank customers for their honesty, feedback, and willingness to assist them perform better.
4. When developing a vision and strategy for the organization ratings and recommendations from the survey, results can be used to create goals and tactics for Customer Satisfaction, Financial Management, Employee Satisfaction, and Operational Performance.
After assessment data are collected and summarized, the strategy is developed with an action plan for implementation. During implementation, it is important to regularly and consistently evaluate progress toward goal attainment and make adjustments. The following year the process begins again.
Successful organizations have such a process. Before strategic planning, the leadership team will visit competitor’s operations to discover their strong points and potential weaknesses. They assess customer sentiment. They evaluate their own operations to discover gaps between their competitors, their customers, and themselves. When planning, marketing staff and customers are included to ensure their innovation strategy addresses current and future needs of their market. Members of staff and front line employees also participate during planning and goal development. An example of a balanced strategy is shown in Figure 2.4

Figure 2.4 Balanced strategy example
Balanced Scorecard for an Aligned Workplace
A balanced scorecard is typically a set of graphs and charts updating progress toward established goals. The purpose of a balanced scorecard is to align strategic goals with all employees in the organization. By visualizing progress toward goal achievement, all staff are clearly focused when solving problems, removing barriers, innovating work and product performance, creating new products and/or services, and celebrating successes. To maximize effectiveness, scorecards report baseline data and goals and are frequently updated (weekly and monthly). The examples are shown in Figures 2.5–2.8.
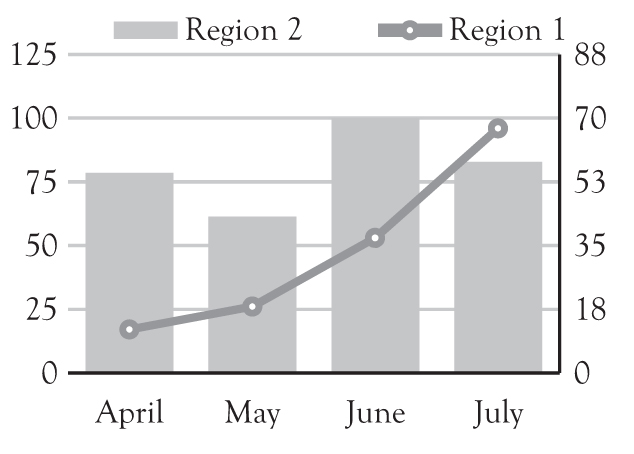
Figure 2.5 Finance (Sales/Revenue)
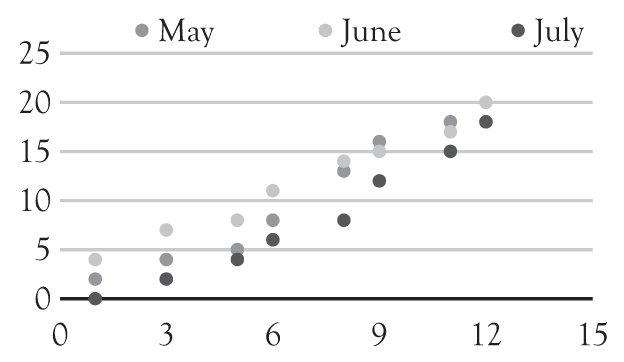
Figure 2.6 Operations (SixSig, Robot, HndHld)
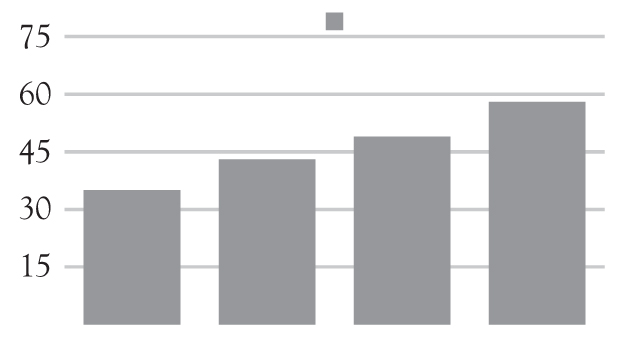
Figure 2.7 Employee satisfaction
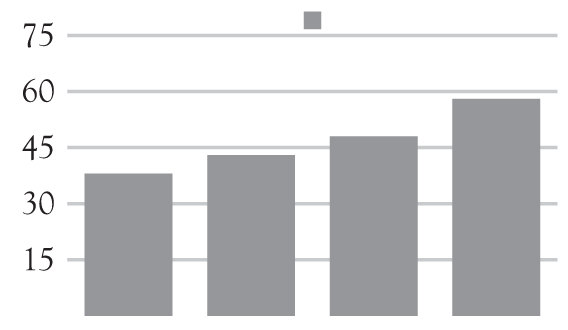
Figure 2.8 Customer satisfaction
The data for Employee Satisfaction track with data for Customer Satisfaction. Research repeatedly shows a direct correlation between Employee Satisfaction and Customer Satisfaction. When Employee Satisfaction improves, so does Customer Satisfaction. It is also true that if employees are in conflict or otherwise dissatisfied and lack the resources to perform their duties, Customer Satisfaction data will drop as well.
You may notice the data graphed in Finance, Employee Satisfaction, and Customer Satisfaction are outcome data resulting from implementing the tactics of your strategy. The Operations scorecard tracks process data including the number of Six Sigma projects, number of hand held devices, and number of robotic devices installed in operations. Outcome data reflect the results of our activities while process data count the tasks we perform to deliver the outcomes we have defined.
Any sports coach I have known, including my own experience as a coach, develops a strategy for the season based on available talent and nature of teams in the conference. Every coach has measures of team performance as well as how each player performs on shots taken, shot blocks, steals, turnovers, assists, and so on. Without good data, team members have little chance to improve. One team I coached could not rebound missed shots. I began counting every time someone blocked out an opponent and caught rebounds. At every break in the game, players would come over to see how many block outs and rebounds they achieved. Within weeks, rebounding improved and we became competitive in our league.
As with sports, the same applies in business. A corporation, small business, or nonprofit requires data to evaluate performance. Imagine attending a basketball game and never knowing the score or number of fouls made. How long would you stay at the game, how many games would you attend without a scoreboard or method to measure winners and losers? It is no different with your business. Knowing the score makes a major difference in a leader and her team’s ability to make decisions, keep the workforce aligned and focused, and remain dominant in her market.
Several factors are important to consider when developing a balanced scorecard or dashboard.
1. Charts should be regularly and consistently updated.
Many organizations want to measure monthly or quarterly. It is important to measure weekly instead. The reason is simple. By measuring the progress weekly, your team has a much better chance to make corrections in work in order to better meet monthly goals. Measuring monthly does not provide the information required for making mid-course corrections and is much less motivating to staff.
2. Charts should be prominently posted in a highly visible area of the workplace.
The reason for prominent display is to keep the focus of the operation “top of mind” with everyone. This is continuous alignment. Clear communication is important, and highly visible charts updated weekly is a proven way to provide relevant and helpful information to everyone in your operation.
3. Charts should be maintained and updated by staff.
If management maintains the graphs and charts, management will pay attention to them. If staff keeps the charts up to date, staff will pay attention to them.
4. Charts should be colorful and easily accessible.
Dull pictures tend to be ignored, and graphs can be ignored as well. Provide lots of color that tells the story. For example, a red line for your goal, green and blue lines for data, and black lines make graphs colorful and tell a story.
5. Charts should have goals.
Alignment of your workforce includes depicting the goals of the team or organization on the graphs. These goals align with company strategy goals. Each part of the organization can track progress, solve problems, and innovate when goals are not achieved.
6. Charts should be easily understood and easy to read.
A person new to your organization, including customers, should be able to glance at your graphs and know immediately how you are performing. Two companies I served worked diligently to have graphs posted that readily told the story of their focus and progress.
7. Charts should include baseline data to illustrate past performance.
Baseline data are collected and charted showing performance before you began implementing your strategy. Drawing a line at the point you begin making changes will help you evaluate progress versus past performance.
8. The organization’s vision, mission, and principles should be posted with scorecards.
Ensure that everyone can describe how they are living the values in their workplace. A General Manager of a prominent hotel chain presented to our group when we were benchmarking companies. He pulled from his pocket a list of values. Every day he picks one value and visits his departments asking staff to recite the value of the day. Everyone is aligned with the values of that organization. And customers are delighted. And business is very good!
9. Data should be charted going up.
There is just something about the way we are wired. We like to see data go up in sports such as basketball, soccer, football, and so on, with exceptions of golf and track. It is the same in business. We like to see sales, quality productivity go up. And we like to see our graphs go up. So, if you are measuring errors, graph accuracy instead. If you are trying to improve absenteeism, graph attendance. Remember positive thinking for leaders. Good time to use it!!
The value of not only having a balanced set of measures but also implementing the concept throughout your organization cannot be emphasized enough. A manufacturing operation would annually invite us back to facilitate the planning exercise and then work on each shift to facilitate shift teams in deciding on measures to align with their plant’s strategy. Each year the operation’s performance improved over the past year, in part, because every person in the company knew their score weekly and monthly.