China is the world’s largest logistics market, estimated at $1.76 trillion in 2018.1 For an economy based on supplying low-priced commodities for export, logistics in China is surprisingly expensive. For example, of the total amount spent on Chinese goods, approximately 20 percent goes into logistics. That’s over twice as much as what U.S. companies spend on logistics. Half of China’s logistics spend goes into transportation.
China has over 2.5 million miles of roads.2 Village roads (as shown in Figure 7.1) account for roughly half of all Chinese roads. However, when it comes to moving freight, village roads aren’t of much use. By weight, 80 percent of Chinese cargo is transported on highways.3 Reliance on highway transport is a recent development in China. The National Trunk Highway System was launched in 1990. At that time China had about 100 miles of highway. By 2011, over 53,000 miles of highway linked every provincial capital and all Chinese cities with populations of over 200,000.4

Figure 7.1 Typical village road
Source: Courtesy of Wu Xubiao.
China’s highways are laid out in a “7 by 9 by 18” grid. Seven national roads radiate from Beijing, nine cover the country north to south, and 18 run east and west. Operations managers seeking to minimize trucking costs locate their factories and vendors within easy access of this grid.

Figure 7.2 Map of China NTHS Expressway, 2011
Source: Adapted from “Map of China NTHS Expressway G6.png,” by N. Farid, 2014, https://commons.wikimedia.org/wiki/File:Map_of_China_NTHS_Expressway_G6.png.
China’s highway system is not only larger than the U.S. interstate highway system but was built in half the time. Interestingly, this wasn’t accomplished by following the U.S. model. The U.S. interstate highway system is funded in no small part by an 18.4¢/gallon gasoline tax and a 24.4¢/gallon diesel tax.5 In a rare departure from the state council, the National People’s Congress rejected the idea of using China’s already high 95¢/gallon gasoline tax and 76¢/gallon diesel tax to pay for highway construction.6 Unfortunately, vehicle purchase tax, road maintenance fees, and highway transport management fees weren’t enough to cover the $240-billion price tag.7 The Ministry of Transport (MOT) passed highway funding responsibility to the provinces. But provincial governments lacked the necessary tax revenue and borrowing power to finance construction. They entered into 25-year build–operate–transfer agreements with seven private expressway corporations. The Shenzhen Expressway, Hopewell Highway Infrastructure, and Yuexiu Transportation Infrastructure Corporation build and maintain highways in the south. Sichuan Expressway handles traffic in the west. Zhejiang Expressway, Anhui Expressway, and Jiangsu Expressway (as shown in Figure 7.3) operate highways in the east.

Figure 7.3 Typical Jiangsu highway scene
Source: Courtesy of Wu Xubiao.
The primary source of revenue for expressway corporations is tolls. As of 2016, nearly 70 percent of the world’s toll roads were in China.8 Figure 7.4 is an example of a typical toll gate in China.

Figure 7.4 Typical Chinese toll gate
Source: Courtesy of Wu Xubiao.
Expressways in the east and south account for most of China’s traffic flow. Roads are generally in good condition because toll receipts are sufficient to maintain operations. The same can’t be said for roads in the more sparsely populated central and western regions. As a whole, expressway corporations operate at a loss. In 2007 they lost $1 billion.9 From 2010 to 2017 the situation was worse. They lost approximately $7 billion per year.10
Overcoming transport delays owing to poor road conditions isn’t simply a matter of raising tolls. One the one hand, tolls are set by the government; on the other hand, they’re already very expensive. Tolls account for roughly 20 percent of trucking costs in China. At 13¢/mile, Chinese tolls are, on average, 20 percent more expensive than U.S. highway tolls.11 Tolls alone, however, can’t explain why China’s trucking costs, at $2.50 to $3 per mile, are 70 percent more expensive than those in the United States.12 Part of the reason is fuel cost. In February of 2020, a liter of diesel in China was 17 percent more expensive than in the United States.13
Another reason for the high cost of trucking in China is inefficiency. It’s estimated that 40 percent of the time Chinese trucks are running empty.14 On the surface, they’re empty because much of the local, less than full truckload (LTL) business is being transported by electric bike couriers.15 Figure 7.5 shows a typical courier delivery.
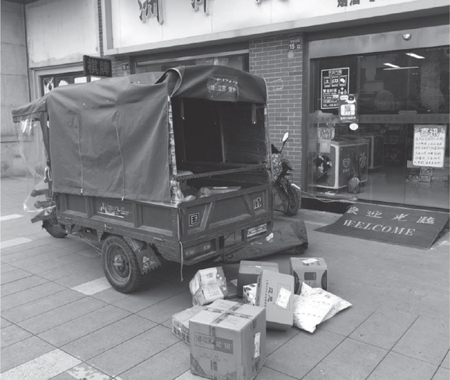
Figure 7.5 Typical electric bike courier service
Source: Courtesy of Wu Xubiao.
On a deeper level, China’s transportation sector has a number of systemic problems. In 2016 a symposium was held in Shenzhen, China, entitled “Improving Efficiency in Chinese Trucking and Logistics.” Key conclusions were as follows16:
• Low barriers to entry result in an oversupply of low-quality carriers.
• A proliferation of protectionist local regulations and tax codes discourage economies of scale.
• Multiple, poorly enforced regulations reduce operating efficiencies.
• Poor equipment standardization also reduces operating efficiencies.
• Modern logistics management techniques and IT systems aren’t widely used.
With limited ability to electronically coordinate pickups and drops, it stands to reason that most freight in China is moved as full truckloads (FTLs). The average delivery distance is 100 miles.17 It’s estimated that when trucks have loads, 80 percent of the time they’re overloaded. Figure 7.6 is a typical example of an overloaded vehicle.

Figure 7.6 Typical overloaded Chinese truck
Source: Courtesy of Wu Xubiao
Fines do little to deter overloading. For example, a truck caught exceeding height restrictions might face only a $30 to $150 fine. The standard highway toll could still apply for a truck 30 percent overloaded.18 It could be argued that highway rules designed to improve road safety contribute to the overloading problems. Chinese trucks operate under maximum height (e.g., 13 ft.), length (e.g., 59 ft.), width (e.g., 100.4 in.), and weight restrictions. All of these limits are less than U.S. interstate highway regulations. Why not improve compliance and cost by making rules more economical to follow? Part of the problem is truck quality.
The Chinese truck market is the world’s largest. In 2018, 1.15 million heavy trucks (representing 50 percent of the world market) were sold.19 Foreign builders offering the latest in safety and fuel efficiency would love to sell in this market. Unfortunately, foreign trucks are seldom, if ever, seen on Chinese roads. In 2019 two local builders (FAW Jiefang and Dongfeng Motor) split 40 percent of the market.20 Local truck builders control the market by offering vehicles 60 to 80 percent cheaper than foreign competitors.21
Inexpensive trucks are important to local buyers because half of Chinese trucking companies operate at zero to 5 percent profit margin.22 Profits are low because the transport market is fragmented. For example, of the nine million or so trucking firms, six million are single-truck operations.23 The top 20 carriers combined control less than 2 percent of the market.
Few companies have more to gain by improving China’s transportation sector than e-commerce giant Alibaba. In 2013, Alibaba accounted for roughly 70 percent of all deliveries in China.24 One way Alibaba is seeking to reduce delivery costs is by investing over $1 billion in a nationwide network of warehouses. Setting up warehouses to cut down on transportation cost makes sense considering the low cost of storage in China. In 2018, the average price of warehouse space in Shanghai was $0.75/ft2 per month.25 That’s almost ten times cheaper than the average warehousing price in the United States.26
Standing in the way of efficiently moving freight between locations is a proliferation of local regulations. For example, a trailer weight distribution in one city (as shown in Figure 7.7) may not be permitted in a neighboring city.

Figure 7.7 Example of Chinese truckload configuration
Source: Courtesy of Wu Xubiao.
Some cities, such as Shanghai, permit only local trucks to use high-traffic roads. Out-of-town trucks are easily identified by their license plate numbers, which, as Figure 7.8 shows, must be painted on tailgates.

Figure 7.8 Example of Chinese tailgate
Source: Courtesy of Wu Xubiao.
Traffic laws are enforced through a series of more than 170 million surveillance cameras.27 Per Figure 7.9, CCTV cameras are seemingly everywhere.

Figure 7.9 CCTV cameras at every intersection
Source: Courtesy of Wu Xubiao.
To control traffic congestion, local authorities might restrict times of day when trucks can use busy roads. It isn’t unusual to see queues of tractor trailers (as those shown in Figure 7.10) waiting their allotted time to pass through cities and towns. Cameras automatically detect violations, and points are assigned. Drivers are permitted up to 12 points per calendar year.
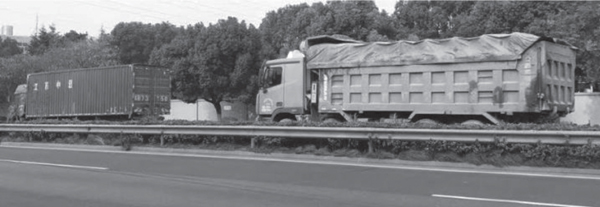
Figure 7.10 Trucks parked along the roadside
Source: Courtesy of Wu Xubiao.
Given the high cost and inefficiencies of trucking, companies often use rail for overland shipments exceeding 200 miles. China is home to the largest railway network in the world.28 The 50,000-plus miles of track is comparable in size to China’s National Trunk Highway System. The five rail hubs and 18 intermodal yards are shown in Figure 7.11.
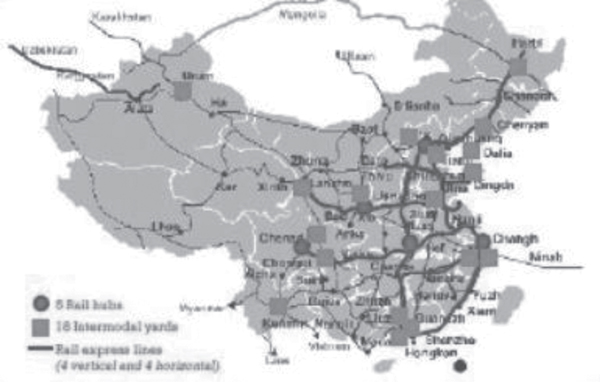
Figure 7.11 China’s rail network, 2014
Source: Reprinted from “China’s Transportation System and Plans for the Future,” US Dept. of Transportation, 2014. Retrieved from https://international.fhwa.dot.gov/pubs/pl08020/fmic_08_03.cfm.
Like the highway system, the rail network is expanding. It’s estimated that by 2030 China’s rail network will stretch 93,000 miles.29 Driving growth in the rail sector is the comparably low cost of laying tracks. The price per mile of track in China is roughly $15 million, which is at least half of the price in the United States.30 As with highway expansion, rail expansion is being financed with debt. However, unlike highways, which rely on corporate investment, the Ministry of Rail (MOR) provided the hundreds of billions of dollars needed.
By 2011, the MOR resembled a country more than a ministry. It had its own schools, police force, and system of courts. It had also amassed close to $320 billion in debt.31 It didn’t help that the railway minister and his deputy chief engineer were accused of embezzling over $100 million. Untenable debt, widespread mismanagement, and a poor safety record resulted in the MOR being disbanded in 2013.
In its place the central government created the state-run China Railway Corporation (CR). Unlike its predecessor, CR focuses solely on railway construction and operations. Of the two activities, CR is prioritizing improvements in efficiency over simply laying more track. In terms of freight operations, CR moved about two trillion ton-miles in 2018.32 That’s roughly the same amount of rail freight moved in the United States. And as is true of the United States, Chinese rail freight accounts for roughly two-thirds of inland transport in ton-miles.33
A heavily reliance on rail freight makes sense considering the low cost ($0.27 to $0.32 per lb.) of using it.34 For shipments over 435 miles, rail transport in China is 40 to 60 percent cheaper than trucking.35 The issue is time. What takes days to move by truck might take weeks by train. Part of the problem is that Chinese freight doesn’t run on dedicated lines. Military, passenger, coal, and food all have priority. Another source of delays is intermodal transfer. When freight cars arrive at ports, they must often be offloaded to trucks before loads are transferred to ships. The reason is that many Chinese ports were built when trucking, shipping, and rail fell under different ministries. Lack of coordination resulted in many ports (such as the one shown in Figure 7.12) being built without dockside rail access.
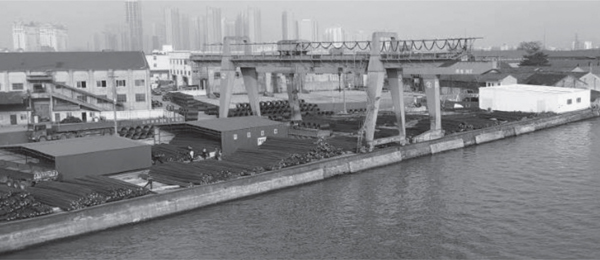
Figure 7.12 Example of dock with trucking but no rail access
Source: Courtesy of Wu Xubiao.
Interestingly, many of the problems companies face in moving products domestically by rail don’t apply when exporting. In 2013, China exported essentially nothing by rail. By 2017, as part of the “Belt and Road” initiative, 39 rail lines linked 12 European cities with 16 Chinese cities.36 That same year more than 3,000 freight cars made the 7,500-mile trip between China and Europe.
For operations seeking to take advantage of rail exports, it’s helpful to be located along the three main rail lines shown in Figure 7.13. The northern corridor follows the Trans-Siberian Railway; the middle corridor cuts through Kazakhstan; and the southern corridor crosses Central Asia. Almost half of what’s being transported along these routes is raw materials. 37 Raw materials pricing is a key problem for Chinese manufacturers. Even though China is the world’s largest consumer of raw materials, closed financial markets mean global commodities prices are set by futures contracts traded in Chicago and London.
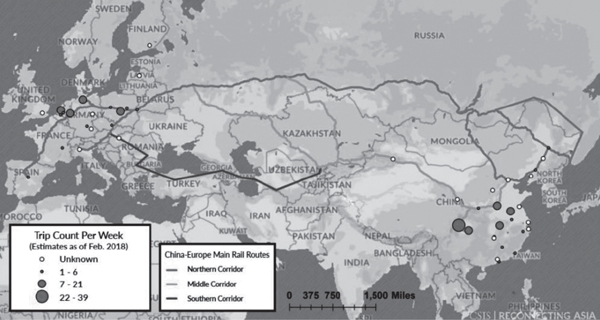
Figure 7.13 CR rail export routes
Source: Reprinted from “The Rise of China-Europe Railways,” by J. Hillman, 2018, Center for Strategic and International Studies. Retrieved from www.csis.org/analysis/rise-china-europe-railways.
Key advantages of exporting by rail are transit time and cost. Container cars can make the trip from China to Europe in about 10 days. That’s twice as fast as shipping. It’s also 30 percent cheaper than shipping. The issue is that prices are heavily dependent on government subsidies. For example, from 2011 to 2016 Chinese provincial governments spent over $300 million on European routes.38 It’s estimated that government subsidies offset 60 percent of the $9,200 cost to send a railcar from China to Europe.39
As impressive as the growth in rail transport has been, almost 70 percent of Chinese international trade is still done by sea. When it comes to sea trade with the United States, approximately half of all containers passing through the largest U.S. ports in Los Angeles and Long Beach originate from China.
China’s heavy reliance on sea trade has as much to do with what’s being made as where it’s being made. Traditionally, the Chinese economy has focused on the production of low-priced, high-volume commodities for exports. To cut down on transportation costs, approximately 40% of China’s GDP is produced along the eastern coast, as shown in Figure 7.14.40

Figure 7.14 China’s gross domestic product is primarily along the eastern coast, 2015
Source: Adapted by calling out east coast provinces on “Map of China en names.svg,” by P. Potrowl, 2010, https://commons.wikimedia.org/wiki/File:Map_of_China_en_names.svg.
Warehouses and factories along the coast have easy access to any one of China’s top 10 shipping ports located in the cities of Dalian, Tianjin, Qingdao, Shanghai, Ningbo, Shenzhen, Guangzhou, Hong Kong, and Xiamen. Figure 7.15 shows Ningbo-Zhoushan Port, which is the world’s busiest port in terms of cargo tonnage. In 2017, one billion metric tons of cargo passed through the port.41

Figure 7.15 Ningbo-Zhoushan Port
Source: Courtesy of Wu Xubiao.
With China exporting 50 percent more goods than the second largest exporting country, it stands to reason that seven Chinese shipping ports are among the 10 largest in the world.42 Located at the mouth of the Yangtze River, the Port of Shanghai is the world’s largest container port. In 2006, 20 million 20-foot container equivalents (TEUs) passed through Shanghai Port. Ten years later, container traffic through the port doubled.43 To put this volume of sea containers in perspective, it’s roughly three times the combined volume of the two largest U.S. container ports. Chinese exports so dominate maritime trade that two out of every three sea containers in transit globally have set sail from Chinese ports.44
The massive size of China’s shipping sector translates into low prices. For example, as of 2019, an exporter from China could expect to pay $0.85 to $1.15 per cubic foot for less than container load (LCL) shipment.45 Full container load (FCL) rates were anywhere from $500 to $1,000 per 20 ft. container. Which shipping method is most cost effective from China? It depends. If cargo can fill at least half of a sea container, it’s usually cheaper to ship FCL. If shipment weight is less than 200 kg, it’s generally advisable to ship LCL. Besides weight and measure, shipping decisions depend on time of year. December through April is traditionally the slow season exporting from China. Prices are low following Christmas. From mid-January through early February, prices increase as factories are busy processing orders prior to closing for Chinese Spring Festival. May through November is the peak season leading up to the Christmas rush. During this time shippers can expect to pay higher general rates as well as peak season surcharges.
Water transport in China isn’t just about ocean freight. Each year, over 100,000 river barges move more than 260 million tons of goods along Chinese waterways.46 Barges account for nearly 10 percent of China’s total inland freight by weight. Traffic is highly concentrated, with eight out of every ten barges moving goods along the Yangtze River. As the Yangtze River approaches China’s eastern coast, barges can pass through the Grand Canal system. These 1,100 miles of inland waterways (as shown in Figure 7.16) date back over 2,000 years.

Figure 7.16 Map of the Grand Canal
Source: Reprinted from “Urban Heritage Conservation of China’s Historic Water Towns and the Role of Professor Ruan Yisan: Nanxun, Tongli, and Wuzhen,” by H. Porfyriou, 2019. www.researchgate.net/publication/335163611_Urban_Heritage_Conservation_of_China’s_Historic_Water_Towns_and_the_Role_of_Professor_Ruan_Yisan_Nanxun_Tongli_and_Wuzhen.
Canals connect five major rivers (Hai, Huai, Qiantang, Yangtze, and Yellow) across six provinces (Hebei, Shandong, Henan, Jiangsu, Anhui, and Zhejiang) and two municipalities ( Beijing and Tianjin). Today, only 10 percent of these canals can be used for shipping. The northern half of the canal system is too dry for shipping. Barge transport is largely restricted to a 325-mile stretch of waterways in the south. (One such stretch is shown in Figure 7.17.)

Figure 7.17 Typical barge traffic in Wuxi, China
Source: Courtesy of Wu Xubiao.
With an abundance of heavy industry and inland rail, waterway, and highway transport, the Yangtze River Economic Belt has blossomed. Today, it accounts for roughly 40 percent of China’s population and 40 percent of its economic output, as shown in Figure 7.18.47

Figure 7.18 Yangtze River Economic Belt
Source: Reprinted from “Ecosystem services trade-offs and determinants in China’s Yangtze River Economic Belt from 2000 to 2015,” by X. Xu, X. Yang and G. Tan, 2018. Retrieved from www.researchgate.net/publication/324771205_Ecosystem_services_trade-offs_and_determinants_in_China’s_Yangtze_River_Economic_Belt_from_2000_to_2015.
Operations within the Yangtze Economic Belt typically consolidate their supply chains therein. The same can be said for operations located inside China’s three largest port clusters in the Bohai Rim, Yangtze River Delta, and Pearl River Delta, as shown in Figure 7.19.
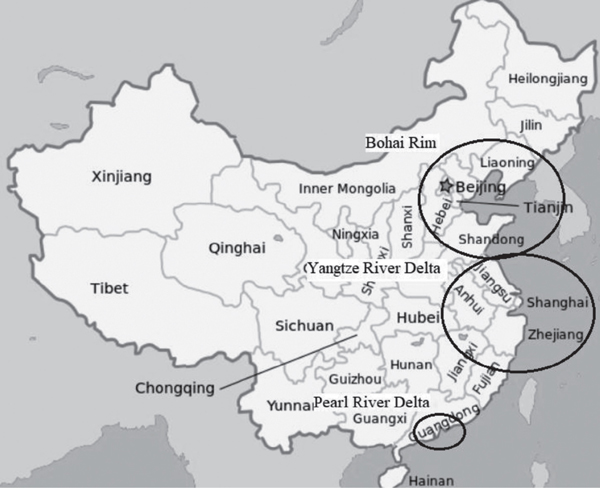
Figure 7.19 China’s port clusters
Source: Added port cluster circles to “Map of China en names.svg,” by P. Potrowl, 2010, https://commons.wikimedia.org/wiki/File:Map_of_China_en_names.svg.
Each of these regions is anchored by one of China’s largest cities. Shanghai is located inside the Yangtze River Delta. Beijing is inside the Bohai Rim. And Guangzhou is inside the Pearl River Delta.
The Yangtze River Delta is China’s richest region per capita, generating approximately 20 percent of the country’s GDP and one-third of its international trade in 2016.48 The Delta encompasses the logistics center of Shanghai, the manufacturing centers of Jiangsu and Zhejiang provinces, and the abundant natural resources of Anhui province. If anything has been holding back development in the region, it is a lack of integration. To improve cooperation, officials from Shanghai, Zhejiang, Jiangsu, and Anhui have put together a 3-year plan (2018–20). The plan calls for investing more than $1 billion in more than a dozen collaborative projects.
What the Yangtze River Delta hub is in the south the Bohai Rim hub is in the north. It generates approximately 25 percent of the country’s GDP. The Rim includes the rail and highway hubs of Beijing; the ports of Tianjin, Qingdao, and Dalian; and seven economic development zones (Shenyang Economic Development Zone, Liaoning Coastal Economic Development Zone, Zhongguancun (Beijing) Technology and Innovation Center, Caofeidian (Hebei) Circular Economy Demonstration Area, Binhai (Tianjin) New Area, Yellow River Delta Eco-Economic Zone, and Shandong Marine Economic Zone). Although provinces and municipalities in the region are highly industrialized, linkages, like those in the Yangtze River Delta, are weak. As a result, markets in the Rim are comparatively small and fragmented.
With only 5 percent of China’s population and generating 10 percent of the country’s GDP, the Pearl River Delta is the smallest of the country’s three hubs. But foreign direct investment in excess of $1 trillion means the region accounts for 25 percent of China’s exports.49 Additional sources of revenue include Hong Kong’s $4.5 trillion (HK$ 35 trillion) financial sector, Macao’s $16 billion (MOP$ 128 billion) entertainment sector, Shenzhen’s $100 billion (694 billion RMB) technology sector, Guangzhou’s $150 billion (1.1 trillion RMB) trading sector, and the $500 billion (3.5 trillion RMB) industrial output in the manufacturing centers of Foshan and Dongguan. Coordinating capital flow in the Guangdong–Hong Kong–Macao Greater Bay Area (GBA) has been a challenge given the three different currencies in circulation. In 2020, the Central Bank of the People’s Republic of China launched a series of reforms aimed at easing foreign exchange and remittance in the GBA. The goal, according to HSBC Bank, is to cluster talent, capital, and industry in order to drive higher value-added production and consumption.50
As the GBA, Pearl River Delta, Bohai Rim, and Yangtze River Delta indicate, business in China is centered in hubs. A key reason is transportation cost. With eight out of every 10 pounds of Chinese freight moving by truck, supply chains depend on road transport. Trucking being 70 percent more expensive in China than in the United States, managers set up operations within economic clusters to cut down on transportation. Each cluster is designed to have every supplier, distributor, and mode of transport necessary to support local operations. China’s export focus means hubs are located either along the coast or along inland rail and waterway links connecting to the coast.
1 PYMNTS.com. 2018. “China Claims Title of World’s Largest Logistics Market,” www.pymnts.com/news/international/2018/china-logistics-market-transportation-costs-robotics/, (accessed February 13, 2020).
2 International Road and Transport Union. 2009. “Road Transport in the Peoples Republic of China,” www.iru.org/sites/default/files/2016-01/en-rt-in-china.pdf, (accessed March 19, 2018).
3 H. Long, et al. 2005. “Investigating the Characteristics of Truck Crashes on Expressways to Develop Truck Safety Improvement Strategies in China,” The National Academies of Sciences Engineering Medicine. https://trid.trb.org/view.aspx?id=851593, (accessed February 2, 2018).
4 L. Guo and Z. Yang. 2017. “Evaluation of Foreign Trade Transport Accessibility for Mainland China,” Maritime Policy and Management. https://www.researchgate.net/publication/317252235_Evaluation_of_foreign_trade_transport_accessibility_for_Mainland_China, (accessed April 15, 2019).
5 US Energy Information Administration. 2019. “How Much Tax Do We Pay on a Gallon of Gasoline and on a Gallon of Diesel Fuel?” www.eia.gov/tools/faqs/faq.php?id=10&t=10, (accessed July 6, 2019).
6 L. Zongwei, et al. 2017. “Overview of China’s Automotive Tax Scheme: Current Situation, Potential Problems and Future Direction,” Journal of Southeast Asian Research. https://ibimapublishing.com/articles/JSAR/2017/790677/790677.pdf, (accessed June 7, 2019).
7 Road Traffic Technology. 2012. “National Truck Highway System (NTHS),” www.roadtraffic-technology.com/projects/national-trunk-highway-system/, (accessed August 8, 2018).
8 B. Reja, P. Amos, and F. Hongye. 2013. “China Road Tolls Policy: Past Achievements and Future Directions,” The World Bank. www.worldbank.org/en/news/opinion/2013/06/14/china-road-tolls-policy-past-achievements-and-future-directions, (accessed July 8, 2018).
9 The World Bank. 2007. “China’s Expressways: Connecting People and Markets for Equitable Development,” http://documents.worldbank.org/curated/en/761361468023701493/pdf/365500ESW0P09600BOX361530B00PUBLIC0.pdf, (accessed August 16, 2017).
10 C. Yang. 2018. “Transport Ministry Tightens Toll Road Rules as Losses Spiral,” Caixin. www.caixinglobal.com/2018-12-21/transport-ministry-tightens-toll-road-rules-as-losses-spiral-101362141.html (February 2, 2020).
11 J. Durkay. 2013. “Comparison of Toll Rates by State and Regional Tolling Authorities,” National Conference on State Legislatures. www.ncsl.org/documents/transportation/NCSL_Comparison_of_Tolling_Rates_Feb_2013.pdf, (accessed July 19, 2017).
12 T. Zongyang. 2011. “Driving Overloaded Trucks Off Highways Targeted,” China Daily. www.chinadaily.com.cn/china/2011-03/24/content_12218917.htm, (accessed August 26, 2018).
13 GlobalPetrolprices.com. 2020. “Diesel Prices Per Liter,” www.globalpetrolprices.com/diesel_prices/, (accessed February 14, 2020).
14 A. Minter. 2017. “China Transforms the Trucking Business,” Bloomberg. www.bloomberg.com/view/articles/2017-11-30/china-transforms-the-trucking-business, (accessed March 26, 2019).
15 I. Mir. 2013. “Logistics Revolution in China: Will Delivery Companies Deliver?” CKGSB Knowledge. http://knowledge.ckgsb.edu.cn/2013/06/24/china/logistics-revolution-in-china-will-delivery-companies-deliver/, (accessed September 22, 2018).
16 J. Agenbroad, J. Creyts, D. Mullaney, J. Song, and Z. Wang. 2016. “Improving Efficiency in Chinese Trucking and Logistics,” Rocky Mountain Institute. https://rmi.org/wp-content/uploads/2017/03/China_Trucking_Charrette_Report_2016.pdf, (accessed September 3, 2020)
17 Road Traffic Technology. 2012. “National Truck Highway System (NTHS),” www.roadtraffic-technology.com/projects/national-trunk-highway-system/, (accessed August 8, 2018).
18 The World Bank. 2007. “China’s Expressways: Connecting People and Markets for Equitable Development,” http://documents.worldbank.org/curated/en/761361468023701493/pdf/365500ESW0P09600BOX361530B00PUBLIC0.pdf, (accessed August 16, 2017).
19 360 Feed wire. 2019. “Outlook on the Chinese Heavy Truck Industry 2019–2025 – FAW Jiefang Leads with a Market Share of 20%, Closely Followed by Dongfeng Motor with 19%,” www.oilandgas360.com/outlook-on-the-chinese-heavy-truck-industry-2019-2025-faw-jiefang-leads-with-a-market-share-of-20-closely-followed-by-dongfeng-motor-with-19/, (accessed February 2, 2020).
20 Ibid.
21 This price gap only widens after taking into account China’s 10 percent vehicle sales tax.
22 IBIS World. 2019. “Freight Trucking Industry in China—Market Research Report. www.ibisworld.com/industry-trends/international/china-market-research-reports/transport-storage-post/freight-trucking.html, (accessed January 22, 2020).
23 A. Minter. 2017. “China Transforms the Trucking Business,” Bloomberg. www.bloomberg.com/view/articles/2017-11-30/china-transforms-the-trucking-business, (accessed March 26, 2019).
24 I. Mir. 2013. “Logistics Revolution in China: Will Delivery Companies Deliver?” CKGSB Knowledge. http://knowledge.ckgsb.edu.cn/2013/06/24/china/logistics-revolution-in-china-will-delivery-companies-deliver/, (accessed September 22, 2018).
25 M. Zito. 2014. “Logistics, Warehousing and Transportation in China (Part 1),” Dezan, Shira and Associates. www.china-briefing.com/news/logistics-warehousing-transportation-china-part-1/, (accessed August 23, 2018).
26 SCDigest Editorial Staff. 2018. “Supply Chain News: US Market for Warehouse Space Remains Red Hot, with Availability at Near Record Lows,” Supply Chain Digest. www.scdigest.com/ontarget/18-07-24-1.php?cid=14473&ctype=content, (accessed June 22, 2019).
27 J. Russell. 2017. “China CCTV Surveillance Network Took Just 7 Minutes to Find BBC Reporter,” Tech Crunch. https://techcrunch.com/2017/12/13/china-cctv-bbc-reporter/, (accessed June 23, 2018).
28 F. Gronkvist. 2018. “Train Railway Freight from China: A Complete Guide,” China Importal. www.chinaimportal.com/blog/railway-freight-china/, (accessed July 27, 2019).
29 L. Guo and Z. Yang. 2017. “Evaluation of Foreign Trade Transport Accessibility for Mainland China,” Maritime Policy and Management. www.researchgate.net/publication/317252235_Evaluation_of_foreign_trade_transport_accessibility_for_Mainland_China, (accessed April 15, 2019).
30 M. Wines. 2011. “China Rail Chief’s Firing Hints at Trouble,” New York Times. www.nytimes.com/2011/02/18/world/asia/18rail.html, (accessed August 19, 2018).
31 K. Smith. 2013. “China to Abolish Ministry of Railways?” International Railway Journal. www.railjournal.com/regions/asia/china-to-abolish-ministry-of-railways/, (accessed October 16, 2018).
32 Statista. 2018. “Volume of Rail Freight Traffic in China from 2008 to 2018,” www.statista.com/statistics/276066/volume-of-rail-freight-traffic-in-china/, (accessed November 25, 2019).
33 P. Amos and J. Dashan. 2009. “Sustainable Development of Inland Waterway Transport in China,” The World Bank and the Ministry of Transport People’s Republic of China. http://siteresources.worldbank.org/EXTPRAL/Resources/china.pdf, (accessed May 12, 2018).
34 F. Gronkvist. 2018. “Train Railway Freight from China: A Complete Guide,” China Importal. www.chinaimportal.com/blog/railway-freight-china/, (accessed July 27, 2019).
35 The World Bank. 2007. “China’s Expressways: Connecting People and Markets for Equitable Development,” http://documents.worldbank.org/curated/en/761361468023701493/pdf/365500ESW0P09600BOX361530B00PUBLIC0.pdf, (accessed August 16, 2017).
36 J. Webb. 2017. “The New Silk Road: China Launches Beijing-London Freight Train Route,” Forbes. www.forbes.com/sites/jwebb/2017/01/03/the-new-silk-road-china-launches-beijing-london-freight-train-route/#4e91dfc41f13, (accessed May 23, 2019).
37 J. Hillman. 2018. “The Rise of China-Europe Railways,” Center for Strategic and International Studies. www.csis.org/analysis/rise-china-europe-railways, (accessed June 12, 2019).
38 Mordor Intelligence. 2018. “China-Europe Rail Freight Transport Market—Growth, Trends, and Forecast (2020–2025),” www.mordorintelligence.com/industry-reports/china-europe-rail-freight-transport-market, (accessed October 25, 2019).
39 Shipping Gazette.com. 2018. “China to Scale Down Subsidies for Trains,” www.vandongederoo.com/china-to-scale-down-subsidies-for-trains/, (accessed November 23, 2019).
40 G. Friedman and J. Shapiro. 2017. “Leading Power: A Look at Japan vs. China.” Mauldin Economic. https://geopoliticalfutures.com/leading-power-a-look-at-japan-vs-china/, (accessed January 23, 2020).
41 Xinhua. 2017. “China’s Ningbo-Zhoushan Port Sees Record Throughput,” www.xinhuanet.com/english/2017-12/27/c_136855637.htm, (accessed May 23, 2018).
42 Cargo from China Ltd. 2019. “China Sea Freight Shipping—Everything You Need to Know,” https://cargofromchina.com/sea-freight/, (accessed August 12, 2019).
43 The Medi Telegraph Shipping and Intermodal Transport. 2018. “Shanghai Port Handling Capacity Breaks Record,” www.themeditelegraph.com/en/transport/ports/2018/01/01/news/shanghai-port-handling-capacity-breaks-record-1.38085829?refresh_ce, (accessed November 15, 2019).
44 World Shipping Council. 2014. “Trade Statistics,” www.worldshipping.org/about-the-industry/global-trade/trade-statistics, (accessed May 16, 2019).
45 F. Gronkvist. 2018. “Train Railway Freight from China: A Complete Guide,” China Importal. www.chinaimportal.com/blog/railway-freight-china/, (accessed July 27, 2019).
46 D. Lague. 2007. “On an Ancient Canal, Grunge Gives Way to Grandeur—The Grand Canal,” New York Times. www.nytimes.com/2007/07/24/world/asia/24canal.html, (accessed June 26, 2017).
47 X. Xu, G. Yang, and Y. Tan. 2018. “Ecosystem Services Trade-Offs and Determinants in China’s Yangtze River Economic Belt from 2000 to 2015,” Science of The Total Environment. www.researchgate.net/publication/324771205_Ecosystem_services_trade-offs_and_determinants_in_China’s_Yangtze_River_Economic_Belt_from_2000_to_2015, (accessed April 13, 2019).
48 M. Preen. 2018. “The Yangtze River Delta Integration Plan,” China Debriefing. www.china-briefing.com/news/yangtze-river-delta-integration-plan/, (accessed February 21, 2020).
49 E. Fuller. 2017. “China’s Crown Jewel: The Pearl River Delta,” Forbes. www.forbes.com/sites/edfuller/2017/10/02/chinas-crown-jewel-the-pearl-river-delta/#658af2925047, (accessed February 12, 2020).
50 Q. Hongbin and K. Lam. 2018. “China’s Greater Bay Area: Many Cities, One Goal,” HSBC Global Research. file:///C:/Users/seidelsonc/Downloads/greater-bay-to-drive-chinas-growth.pdf, (accessed August 12, 2020).