6
Managing Autonomous Databases
In earlier chapters, we discussed how autonomous databases are provisioned and the available options, the migration strategies, the disaster recovery concepts, and the backup/recovery options. In this chapter, we are going to explore the manageability of autonomous databases.
In general, a database is effective when it is managed well. This management topic covers how to operate and manage an autonomous database whether it is an Autonomous Transaction Processing (ATP) database, an Autonomous Data Warehouse (ADB), an APEX database (built for Oracle APEX application development), or a JSON (an autonomous database for JSON-centric applications) database.
This chapter will explore all the management options and functionalities of autonomous databases. We will discuss which tasks are automated and which management tasks need to be managed by us. At the end of this chapter, we will have a better understanding of how to effectively manage an autonomous database.
This chapter also covers the basic day-to-day tasks of a database administrator, such as the following:
- How to start/stop the database
- Scaling up/down
- Connecting to an autonomous database
- Monitoring the performance of the database
- Cloning the database
Let’s get started.
Technical requirements
To follow the instructions given in this chapter, you’ll need an Oracle Cloud Infrastructure (OCI) free tier/pay-as-you-go autonomous database (ATP or ADB).
Autonomous database actions
Let’s start by exploring all the options on the autonomous database Overview page. Log in to the OCI portal using your own credentials, then click the Oracle Database option, and then Autonomous Database, as shown in Figure 6.1. Choose either Autonomous Transaction Processing, Autonomous Data Warehouse, or Autonomous JSON Database.

Figure 6.1 – Oracle Cloud database options
The autonomous database details are shown in Figure 6.2. This details page shows information such as Database Name, OCPU Count, and Storage, and it also has options to manage the database, starting with Start or Stop (depending on the database’s current status), and options for managing the database. We will be exploring each option in detail in this chapter.

Figure 6.2 – Autonomous database overview
Starting or stopping an autonomous database
The first important topic to discuss is how to start and stop the autonomous database. The start and stop actions can be performed via the OCI portal, the OCI Command-Line Interface (OCI CLI), or a REST API:
- OCI portal: As shown in Figure 6.2, on the autonomous database overview page we can find the More Actions button. If we click on that, we will see many options, such as Start or Stop (depending on the current database status), as shown in Figure 6.3. We can also see the database workload type, which is ATP. If the database is stopped, then the letters ATP will have an orange background. Click the Start button to start the database.

Figure 6.3 – Start the autonomous database
Once the database has been started, the ATP background changes to green. The database status will change to available, as shown in Figure 6.4:

Figure 6.4 – Autonomous database details
- OCICLI: Autonomous databases can be started and stopped via the OCI CLI with the following commands:
oci db autonomous-database start –autonomous-database-id <OCID of Autonomous database>
oci db autonomous-database stop –autonomous-database-id <OCID of Autonomous database>
We need to pass the OCID of the autonomous database as an argument in OCICLI to start and stop the database. OCID information can be collected from the overview page.
- REST API: One way to start or stop an autonomous database is via a REST API:
- API to start the database: POST /20160918/autonomousDatabases/{autonomousDatabaseId}/actions/start
- API to stop the database: POST /20160918/autonomousDatabases/{autonomousDatabaseId}/actions/stop
There are many tools, such as Terraform and oci-curl, that you can use to invoke a REST API function. We can start and stop the database using the API without interacting with the OCI portal. Also, APIs are very useful when we want to automate this functionality through scripts.
Now that the autonomous database has been started, the next step is to make a connection with it. Let’s discuss that in the next section.
Autonomous database connection
Autonomous database connectivity is available as either public (available to all) or private (accessible within the same virtual cloud network (VCN)). We will discuss each connection type in detail in the upcoming sections. The autonomous database connection is always encrypted, so we need a wallet file to connect with the database. Click DB Connection on the Autonomous Database Information page. An autonomous database can be created with either a Shared Infrastructure or a Dedicated Infrastructure. If it is a Shared Infrastructure, then clicking the DB Connection button will invoke another window, as shown in Figure 6.5.
The autonomous database has two wallet types – Instance Wallet and Regional Wallet. You can find them in the Wallet Types drop-down box. Instance Wallet provides keys and wallets that are required to connect to this single autonomous database. Regional Wallet provides the keys and wallets required to connect all autonomous databases in that region.
In general, Regional Wallet is used by database administrators or account administrators.
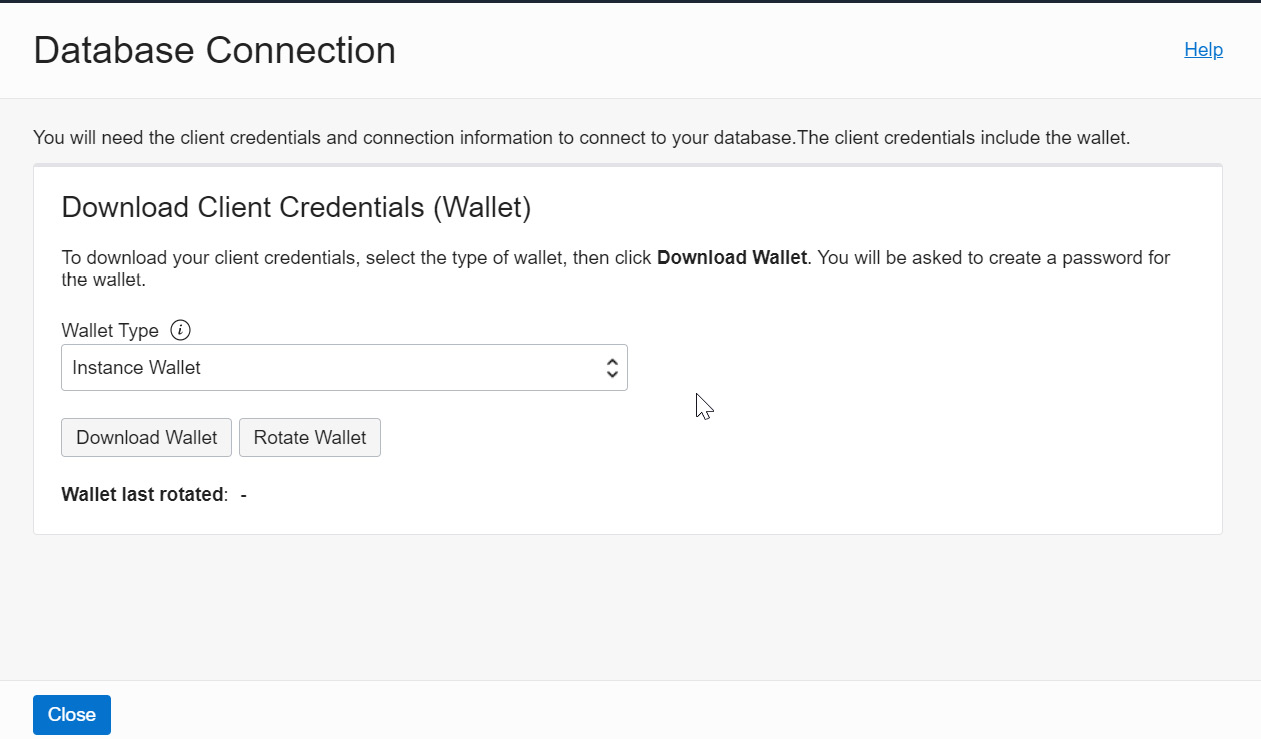
Figure 6.5 – Download Client Credentials
As we can see in Figure 6.5, there are two options for downloading client credentials – you can either Download Wallet or Rotate Wallet. We will discuss the Rotate Wallet option in the next section.
To download an Instance Wallet or a Regional Wallet type, we need to provide a password, as shown in Figure 6.6. This password is required to avoid unauthorized access. Also, database tools that do not have auto-login will require the wallet and password to make connections.
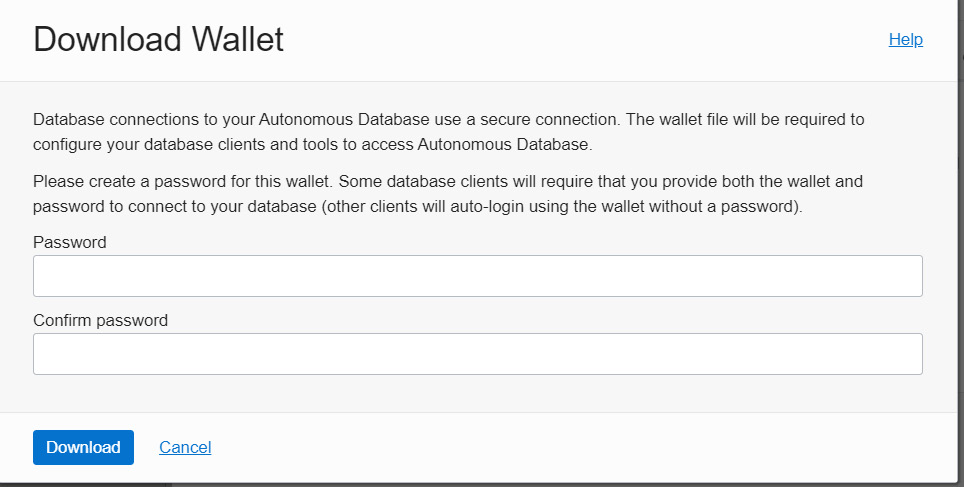
Figure 6.6 – Download Wallet
After providing a password, click the Download button. It will download the wallet as a .zip file (Wallet_<ORACLE_SID>.zip) in the default download location. The .zip file will contain all the files required to make SQL *Plus connections with the autonomous database. In general, for SQL Plus connectivity, we need sqlnet.ora, tnsnames.ora, and a wallet file as the database connection is encrypted in an autonomous environment.
The wallet ZIP file contains the following files:
- Readme: This contains details about the wallet, such as its expiry date. In general, a wallet is valid for 21 months. However, it can be downloaded again at any time to extend its validity. This folder also has autonomous database tools and resources with access links. With these access links, we can directly access the tools via the browser without logging in to the OCI portal and exploring the autonomous page.
- cwallet.sso: This is the Oracle auto-login wallet used for authorization.
- ewallet.p12: This is the wallet file associated with the auto-login wallet.
- sqlnet.ora: This is a SQL*Net profile configuration file that includes the wallet location and the TNSNAMES naming method.
- tnsnames.ora: This is a SQL*Net configuration file that contains network service names mapped to connect descriptors for the local naming method. Autonomous databases provide five different connection descriptors (HIGH, LOW, MEDIUM, TP, AND TPURGENT) to handle different kinds of workload. Each connection descriptor has a different priority with different resource allocations.
- keystore.jks: This is a Java KeyStore (JKS) file for JDBC Thin connections.
- ojdbc.properties: This carries the wallet location. The JDBC driver retrieves the username and password from the wallet.
- truststore.jks: Truststore is used to store certificates from Certificate Authorities (CAs) that verify the certificate presented by the server in SSL connections.
Basically, the unzipped folder has all the files required to make a SQL connection with the autonomous database. In the SQL client machine, the TNS_ADMIN environment variable should point to the unzipped folder (created by extracting this .zip file). We should make sure that the wallet is only available to authorized people.
After setting the TNS_ADMIN variable, we can now make a connection to an autonomous database. By default, SQL Plus connectivity with autonomous databases requires the ADMIN user. We provided the password for the ADMIN user when we provisioned the database. With the wallet and the ADMIN user password, we can now log in to the autonomous database.
You can reset the password of the Admin user through the portal. We will discuss this in the Administrator password section.
As a security best practice, we should rotate the wallet at regular intervals because using the same wallet for a long period is a security threat. After rotation, we will get a new set of certificate keys and credentials. Also, rotating an instance or regional wallet requires confirmation, as shown in Figure 6.7:
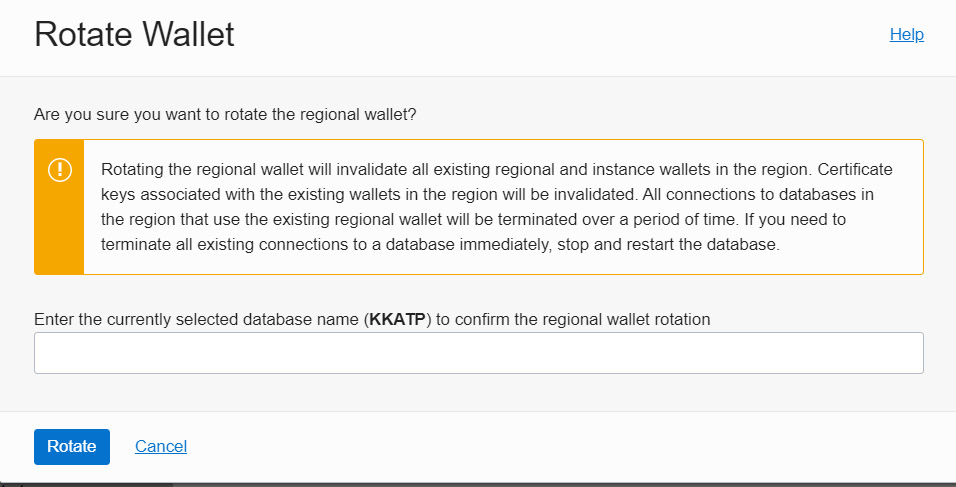
Figure 6.7 – Rotate Wallet
There are a few changes after wallet rotation. Old keys and credentials will become invalid after rotation. You need to download the wallet again to make successful connections, and existing user sessions will be terminated. As we know, there are two kinds of wallet: Instance Wallet and Regional Wallet. Rotating the Instance Wallet type will not invalidate the Regional Wallet type that covers the same database instance, whereas rotating the Regional Wallet type will invalidate the keys of all databases in that region. We will get a detailed message about the rotation’s progress, as shown in Figure 6.8:
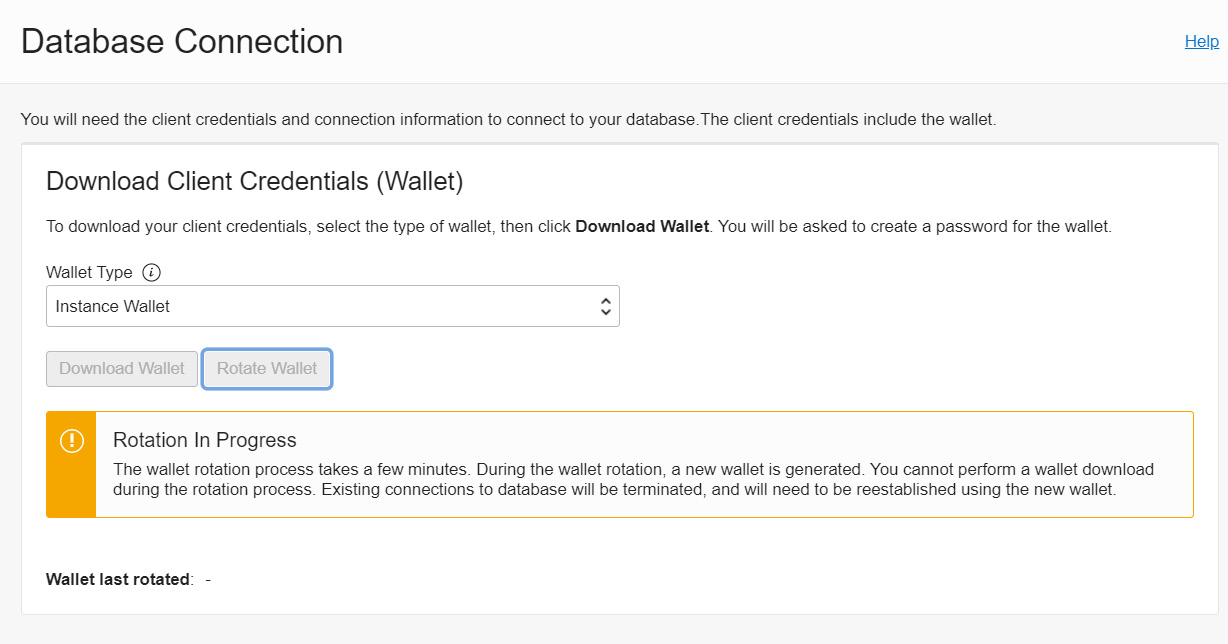
Figure 6.8 – Wallet rotation progress
We can see information about when this wallet has been rotated before. The next topic that we are going to discuss is Performance Hub.
Performance Hub
The next important management feature in the autonomous database is Performance Hub. As we know, an autonomous database manages its performance on its own. At the same time, we can see insights into the autonomous database’s real-time CPU usage, memory usage, user I/O, and disk I/O.
To access the Performance Hub page, click on the Performance Hub button on the Autonomous Database Information page.
At the top of the page, we can find the Activity Summary window, which displays the average active sessions. It provides a graphical representation of User I/O, Wait, time, and CPU usage. To look for specific data, we could filter time range (last hour/last 8 hours/last week/any custom range). We can also change the time zone, as shown in Figure 6.9. Below Activity Summary (Average Active Sessions), we can find ASH Analytics, SQL Monitoring, ADDM, Workload, and Blocking Sessions.

Figure 6.9 – Performance Hub – Average Active Sessions
The Performance Hub page has many useful details that can help us to analyze the performance of our database. At the top, you can also find the Reports button, which can generate an Automatic Workload Repository (AWR) report. Click Automatic Workload Repository in the drop-down list, as shown in Figure 6.10.
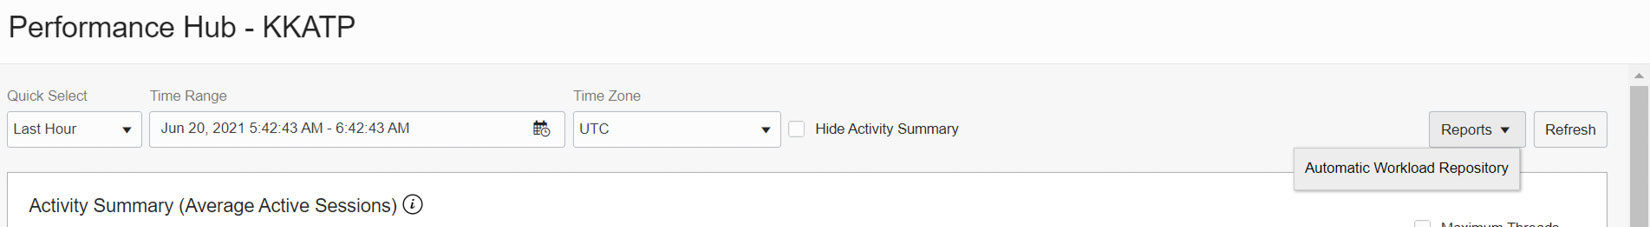
Figure 6.10 – Performance Hub – AWR
It will open a new window, as shown in Figure 6.11. The new page allows us to choose the snapshot timings to generate the AWR report.
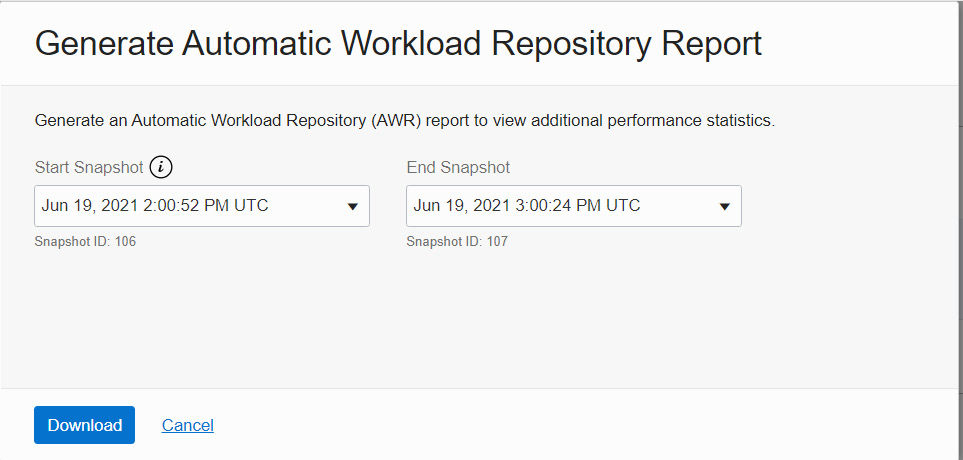
Figure 6.11 – Performance Hub – AWR period
Click Download to generate the AWR report and download it to your local system.
We will discuss the performance metrics (ASH Analytics, SQL Monitoring, ADDM, Workload, and Blocking Sessions) collected by our autonomous database in the following sections.
ASH Analytics
The Active Session History (ASH) chart explores all active session data through the SQL ID and user sessions. An active session is a session that is actively using the CPU, rather than waiting for a wait event. Using ASH Analytics, we can analyze short-lived performance issues from various dimensions, such as SQL ID, time, module, and action, as shown in Figure 6.12.
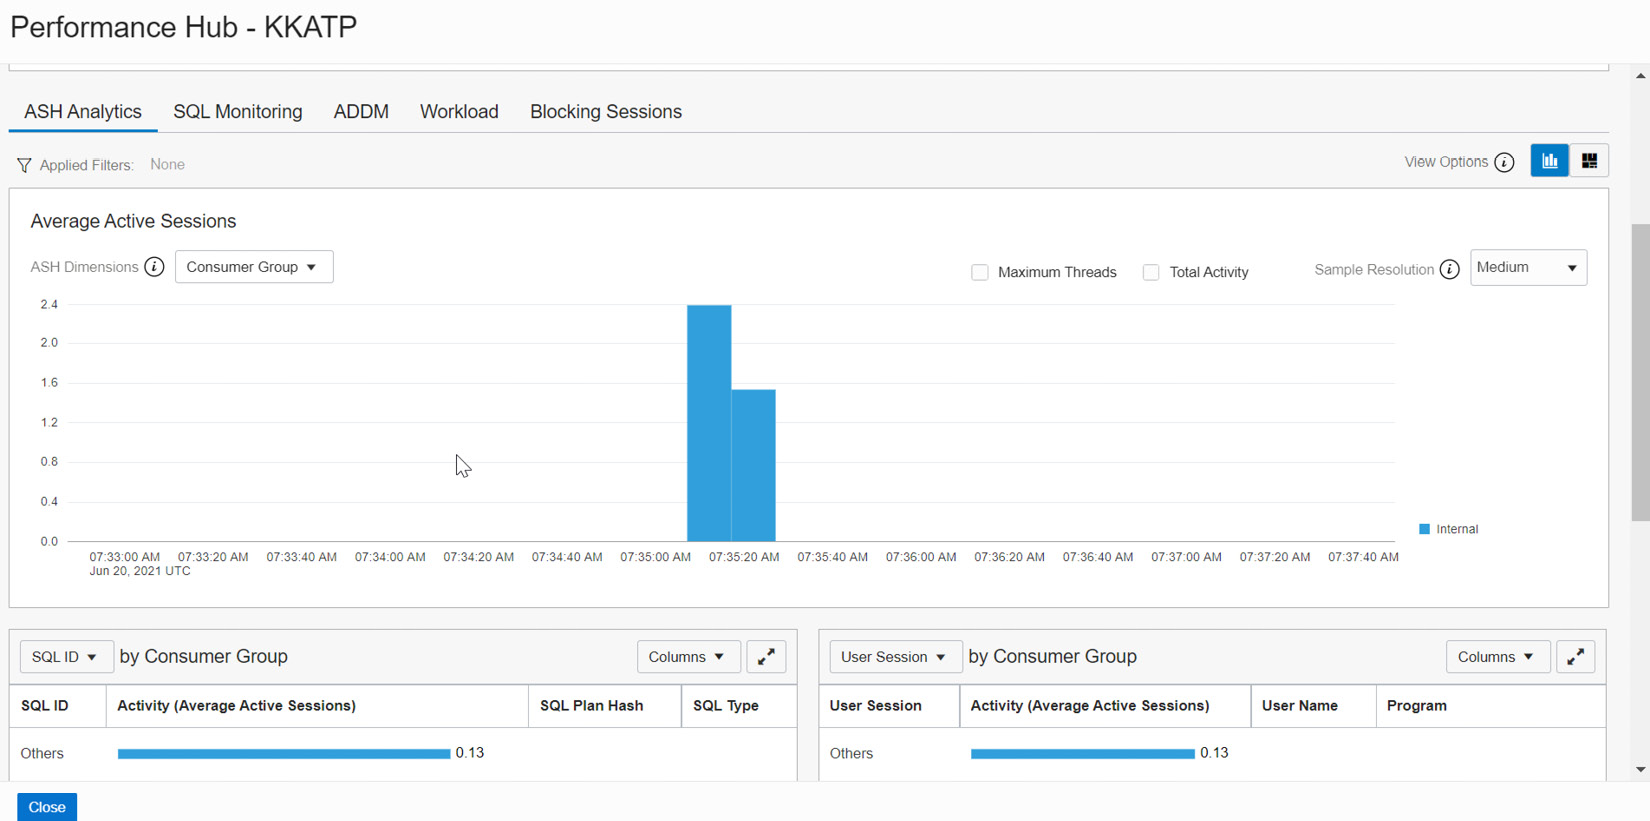
Figure 6.12 – Performance Hub – ASH Analytics
This ASH Analytics graph can be seen from various perspectives. Let’s examine each section in detail. As shown in Figure 6.13, in the Average Active Sessions section, we can see ASH Dimensions. Click on the drop-down box.
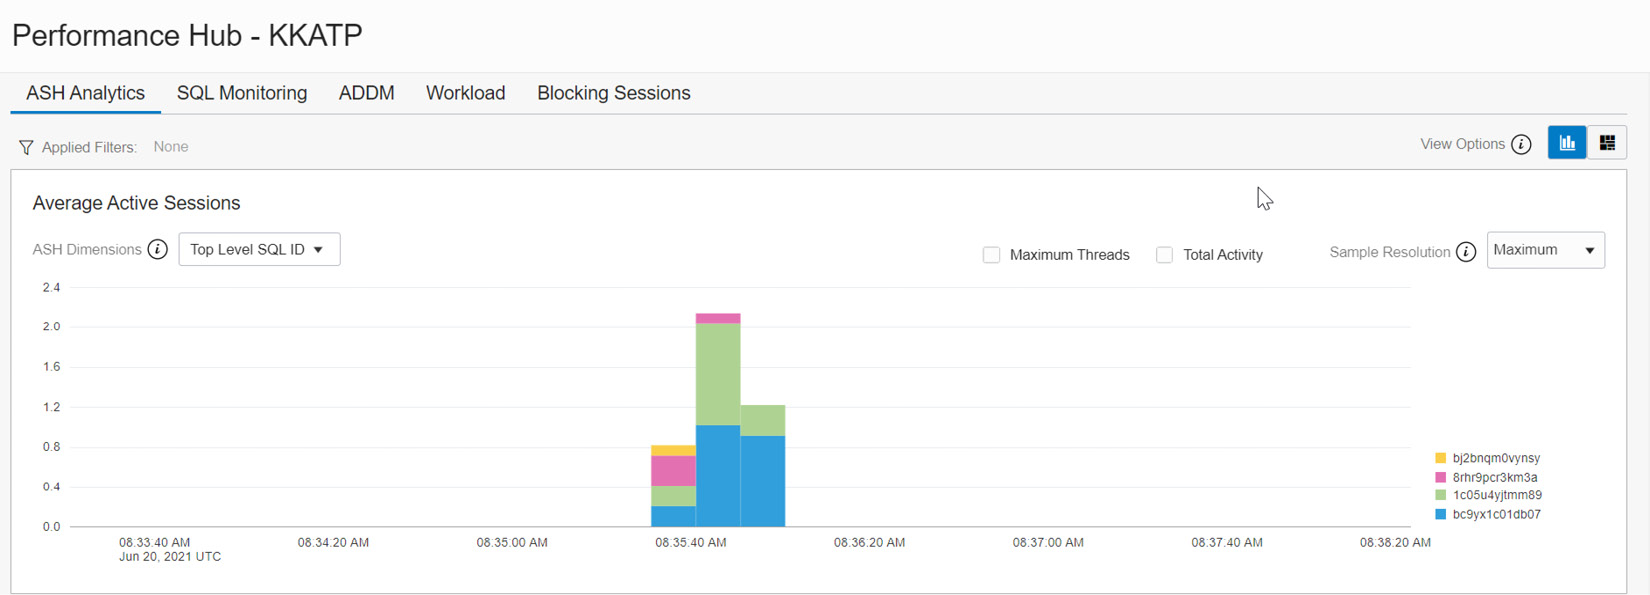
Figure 6.13 – Performance Hub – ASH Analytics (Average Active Sessions)
The drop-down box shows various dimensions, as shown in Figure 6.14. By default, Top Dimensions will be shown for SQL ID. We also have the option to view this graph from a SQL perspective, which will get us SQL information from every session.

Figure 6.14 – Performance Hub – ASH Analytics – Top Dimensions and SQL
The graph also has the option to view sessions that have PL/SQL executions, as shown in Figure 6.15. A separate dimension is available to view Resource Consumption, which provides details about wait classes and events.

Figure 6.15 – Performance Hub – ASH Analytics – PL/SQL
It also has the option to view PL/SQL-specific operations and each session’s attributes, as shown in Figure 6.16.
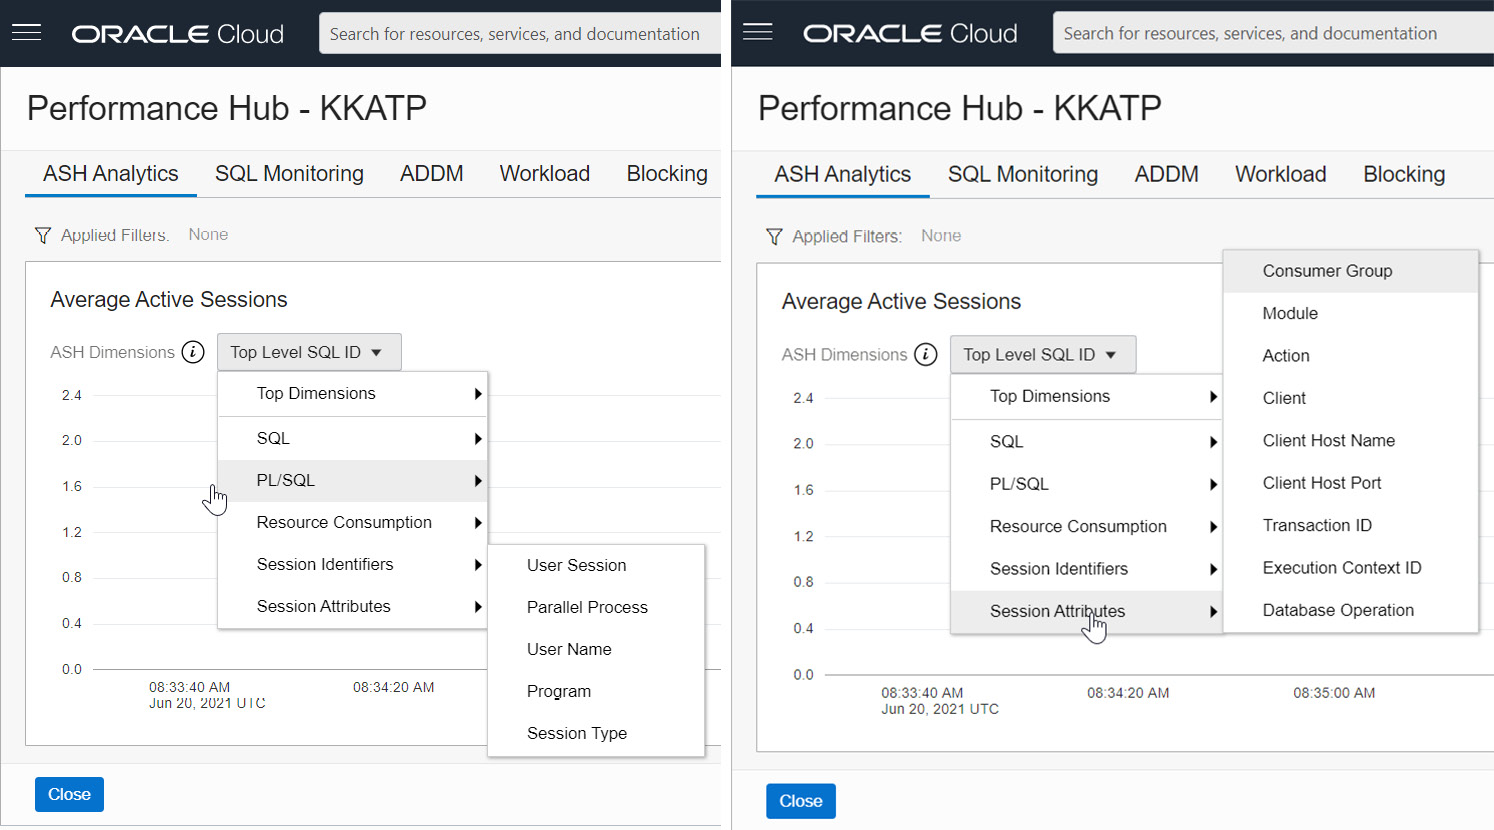
Figure 6.16 – Performance Hub – ASH Analytics – Session Attributes
The graph also has dimensions for Session Identifiers and Session Attributes, which will project the graph in terms of user session details, which we use to see the v$session view in the database.
SQL monitoring
SQL statements that have taken more than 5 seconds to execute will be monitored, and their database time, CPU time, and I/O requests will be shown in the SQL Monitoring section of the Performance Hub graph, as shown in Figure 6.17. This information will be useful when we have long-running SQL queries.

Figure 6.17 – Performance Hub – SQL Monitoring
ADDM
Automatic Database Diagnostic Monitor (ADDM) is a performance monitoring tool that examines the data collected by the AWR on a regular basis and if there are any performance problems, it identifies the root cause of these problems and provides recommendations to correct them. As shown in Figure 6.18, the findings of ADDM will be listed with recommendations.

Figure 6.18 – Performance Hub – ADDM
Workload
The Workload tab displays four sets of database statistics: CPU Statistics, Wait Time Statistics, Workload Profile, and Sessions.
The CPU Statistics chart has details about CPU time and CPU utilization. This chart shows CPU time consumed by foreground sessions, any unusual CPU spikes, and the percentage of CPU time used by each consumer group.
The Wait Time Statistics chart displays the time used in different events.
The Workload Profile has a group of charts indicating patterns of user calls, transactions, and executions.
The Sessions chart shows the number of current successful logins and the number of sessions.

Figure 6.19 – Performance Hub – Workload
Blocking Sessions
The Blocking Sessions chart contains detailed information about the blocking sessions, as shown in Figure 6.20. The chart also gives information about the user sessions that are blocked by these blocking sessions. It also provides SQL involved in blocking session, which helps to find the root cause of the blockage. The page also allows us to kill the blocking sessions.
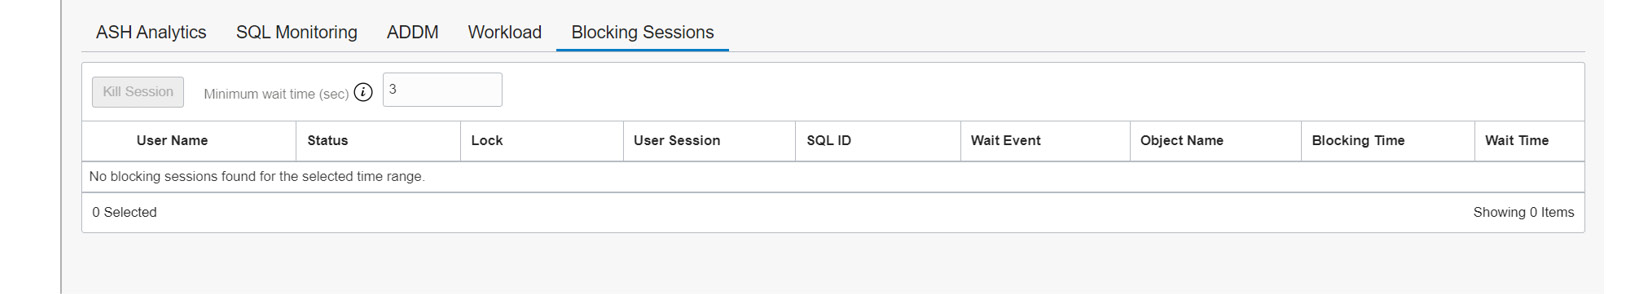
Figure 6.20 – Performance Hub – Blocking Sessions
With this, we have covered Performance Hub. The next section to explore is Scale Up/Down.
Scale Up/Down
By default, the autonomous database will be created with 1 OCPU and 1 TB of storage. However, it can be scaled up or down either manually or automatically. On the Autonomous Database Information page, click the Scale Up/Down button.
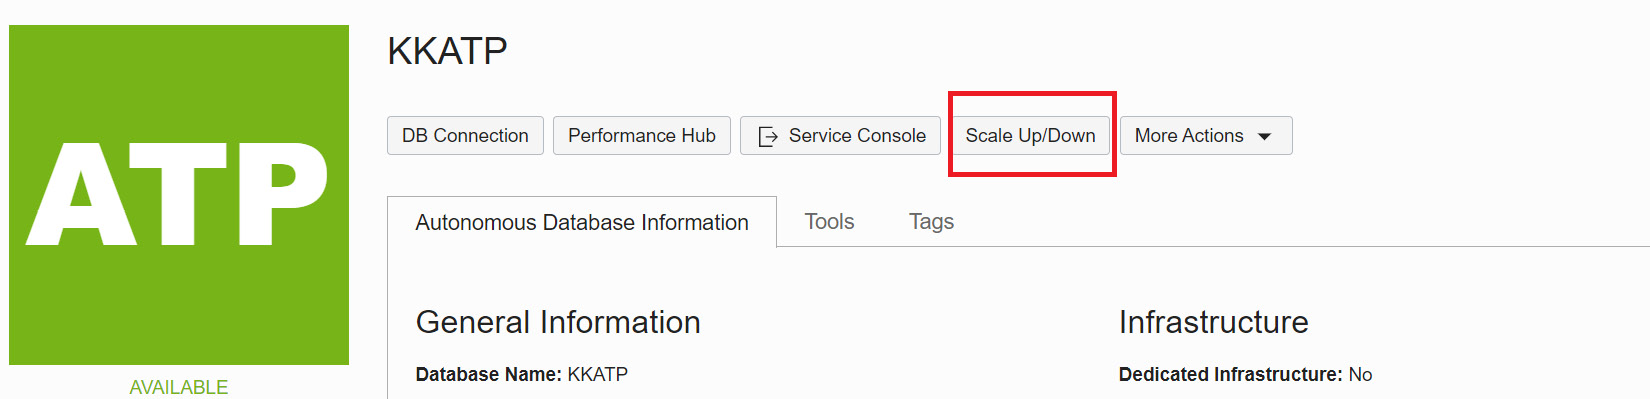
Figure 6.21 – Scale Up/Down
It will take you to the Scale Up/Down window, as shown in Figure 6.22.

Figure 6.22 –Scale Up/Down details
We can choose the required OCPU count and the amount of storage in TB. We also have the option to specify Auto Scaling. CPU scaling doesn’t require downtime, and the billing will be calculated on average OCPU usage per hour.
Auto Scaling is enabled by default, and it will scale up three times the current CPU base number. If the base number is 1 OCPU, then auto scaling will scale up the OCPU count to 3, which continues as demand increases. In the same way, scaling down will happen when demand decreases. In a Shared Infrastructure environment, where multiple autonomous databases share the same infrastructure, auto scaling happens on a first-come, first-served basis. In a Dedicated Infrastructure environment, auto scaling will happen until the maximum available number of cores for that Exadata infrastructure minus the number of OCPUs consumed by other databases in the same infrastructure. For example, for an Exadata X8 quarter rack Dedicated Infrastructure, the maximum number of OCPUs is 100. If more than one database is deployed in that environment, then auto scaling will calculate the available OCPUs as 100 minus the number of OCPUs used by all databases.
Auto scaling or storage will happen at any time without downtime and performance impact.
Let’s discuss some of the other options on the Autonomous Database Information page in the More Actions dropdown, as shown in Figure 6.23.

Figure 6.23 – More Actions of autonomous databases
Cloning
Database cloning is always interesting. We may need to clone a database for testing or recovery purposes. Autonomous databases also have the option to be cloned. The autonomous database clone can be created using the Create Clone option, as shown in Figure 6.23. Cloning is fully automated here.

Figure 6.24 – Create Autonomous Database Clone
The clone can be created in three ways, as we can see in Figure 6.24:
- Full Clone: The cloned database will have all the data and metadata of the source database.
- Refreshable Clone: This is a read-only clone of the source database.
- Metadata Clone: This is a clone of the source database without data.
For Full Clone and Metadata Clone, we can choose to Clone from database instance or Clone from a backup.
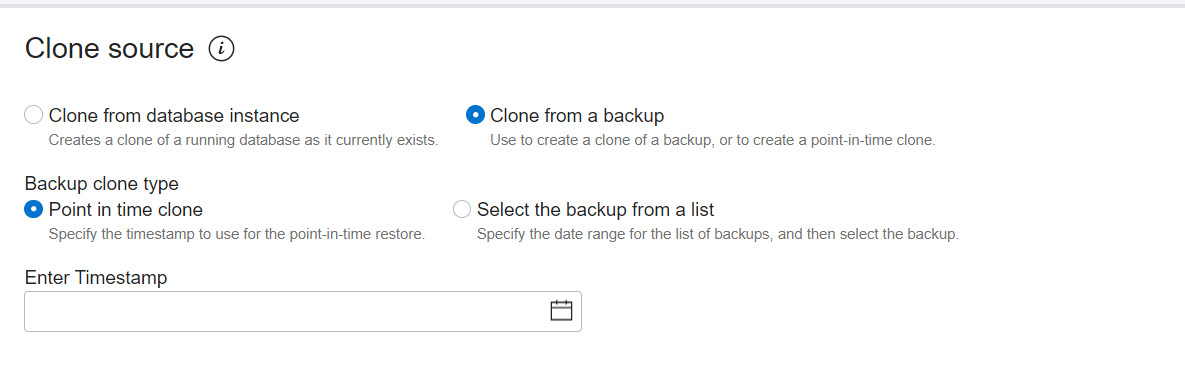
Figure 6.25 – Clone source
For the Backup clone type option, we can choose a particular timestamp or a backup from the list, as shown in the screenshot. The backup should be at least 2 hours old.
In the next step, basic details such as compartment, Source database name, and Database name should be chosen.

Figure 6.26 – Clone database creation details
Provide configuration details for the cloned database, as shown in Figure 6.27.

Figure 6.27 – Clone database configuration
We need to choose the database version, which will be always the latest version. OCPU count and the Storage (TB) size should be provided for the clone database. The OCPU count can be specified up to 128. Enabling Auto scaling helps to manage the resource need automatically. As we discussed in the previous section, when there is a demand, it scales up the OCPU of the autonomous database instance up to three times the assigned OCPU value, and it doesn’t require downtime. Also, it automatically reduces the number of cores when demand is lower. The storage limit will be specified in terabytes (TB) and we can specify up to 128 TB.
Then provide Admin credentials for the cloned database. The password should have a minimum of one uppercase character, one lowercase character, and one number; it should not be one of the last three passwords used; and it should also not contain the word admin. It can contain special characters, but double quotation marks are not allowed. For a refreshable clone, the Admin credentials should be the same as the source database credentials.

Figure 6.28 – Administrator credentials for the cloned database
For the cloned database, we need to define the network access and the license type, as shown in the following screenshot. It could be different from the source database network settings. Network access defines how the cloned database should be accessed. The access happens via SQLNet connectivity. This network access mechanism defines whether public access is allowed for SQLNet connectivity or is possible only within the VCN where the cloned database is located.
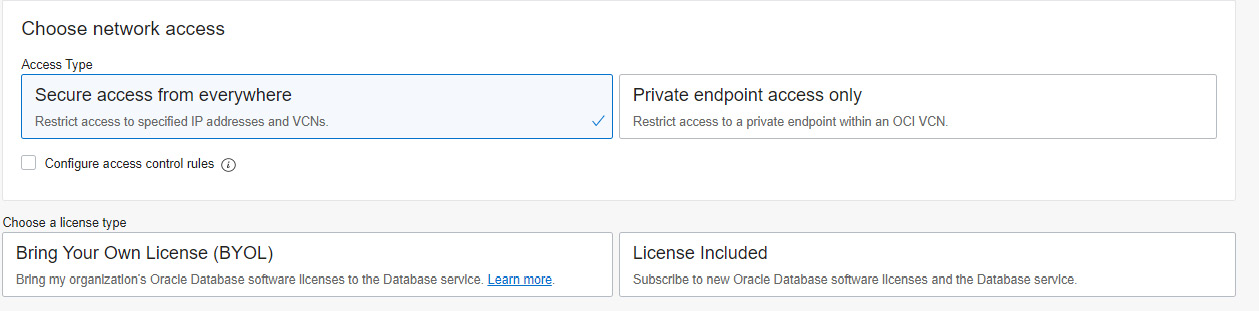
Figure 6.29 – Cloned database network access
The Secure access from everywhere option allows all open connections to the database, but when access control rules are configured, then it provides the choice to restrict the access to a set of IP addresses or any CIDR block, VCN, or VCN’s OCID, as shown in Figure 6.30.
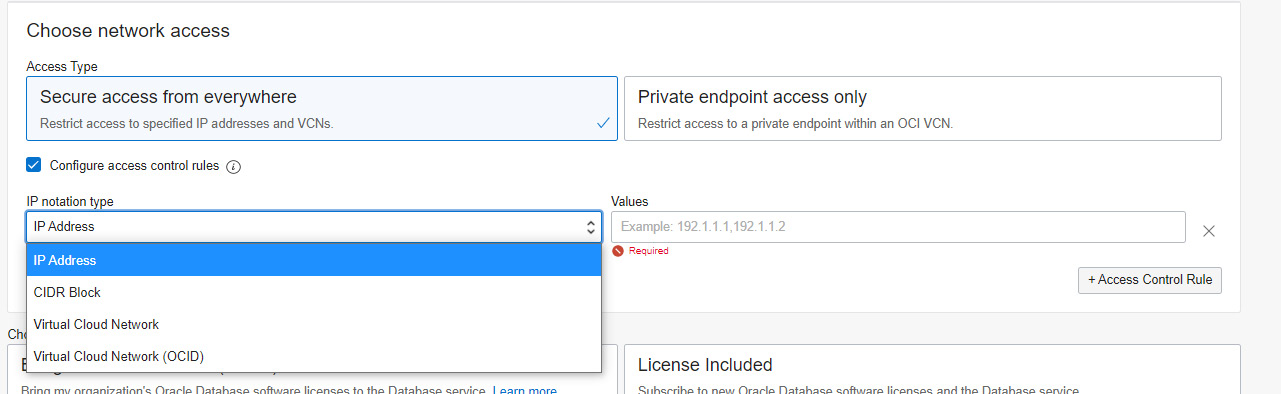
Figure 6.30 – Cloned database network access
Private endpoint access only needs VCN and subnet details to allow communication from a particular network of the same tenancy. Also, a network security group can be specified, as shown in the following screenshot. We can modify the network access method after the autonomous database is created. We will discuss that in the next section.
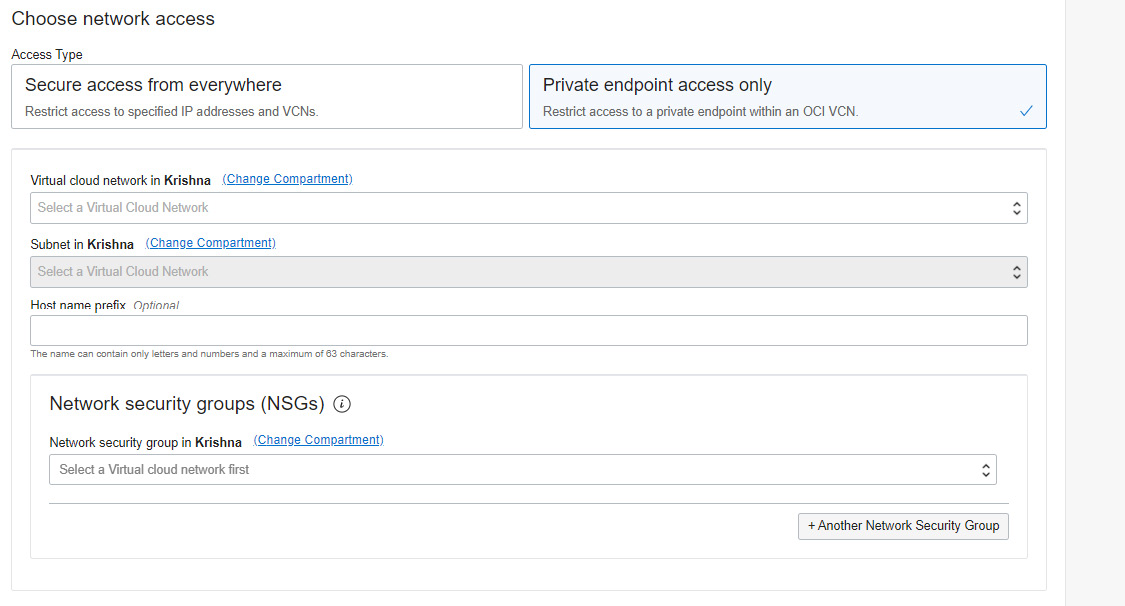
Figure 6.31 – Cloned database – private endpoint access
The license could be Bring Your Own License (BYOL) or let the usage include database licensing fees as well. BYOL allows users to use the licenses that they currently own for on-premises software. We could also provide up to 10 maintenance contacts (email IDs) for this cloned database. Click the Create Autonomous Database Clone button to initiate the action.
Updated Network Access
The network access settings define how the autonomous database should be accessed. We can modify the network access method after the autonomous database has been created as well. Click the Update Network Access option available under the More Actions button in the details page.

Figure 6.32 – Clone database – Access from everywhere
Secure access from everywhere comes with access control rules by default. We can specify IP addresses, CIDR values, any VCN in the same tenancy, or a VCN’s OCID. When we choose a VCN, all subnets belonging to this VCN will get connectivity to our database.
We can only get communication within a VCN in the same tenancy. We need to specify the VCN and the subnet to which we would like this database to connect. With this option, we give access to a specific subnet where it differs from the Secure access from everywhere method. Also it asks to specify Network Security Group (NSG) to adhere to the rules imposed on this environment.
Access control list
The access control list protects the autonomous database by filtering IP addresses and VCNs. Only the allowed IP addresses and VCNs can make a connection with an autonomous database. ACL is applicable only to autonomous databases with a network type of Allow secure access from everywhere. An access control list should contain a minimum of one entry of an IP address or a range of addresses.
Access control lists can be enabled on the Autonomous Database Information page. The networking section of the details page contains the option to Enable or Edit an access control list.

Figure 6.33 – Enabling an access control list
To edit an access control list, click the Edit button as shown in Figure 6.33. A new window will appear.

Figure 6.34 – Autonomous database – Edit Access Control List
An access control list can be created using either an IP address, a CIDR block, or a VCN. After providing the necessary values, save the list, and that will enable the access control list for the database.
Administrator password
The administrator in an autonomous database equates to the Admin user located in the pluggable database. At the time the autonomous database was created, we specified the password. After the database has been created, it can be reset or changed at any time using the Administrator option.
The password needs to follow certain standards. It should contain a minimum of 12 characters and a maximum of 30 characters with at least one lowercase character, one uppercase character, and one number. Also, it should not contain certain special characters, such as double quotation marks, or “admin,” regardless of casing. The password policy considers the history of passwords, so it should not be one of the last four passwords used for the database, and the same password should not have been used within the last 24 hours.

Figure 6.35 – Autonomous database Administrator Password
The next important thing to discuss is updating the license type.
Updating the license type
Autonomous database pricing can be either unit pricing or BYOL. The unit pricing model will charge for what we use; it’s a pay-as-you-go model. BYOL allows us to leverage existing on-premises licenses to move to Oracle Cloud with equivalent, highly automated Oracle PaaS and IaaS services in the cloud.
Update License Type allows us to switch the license option at any time, as shown in Figure 6.36. Charging will be calculated based on the option chosen.
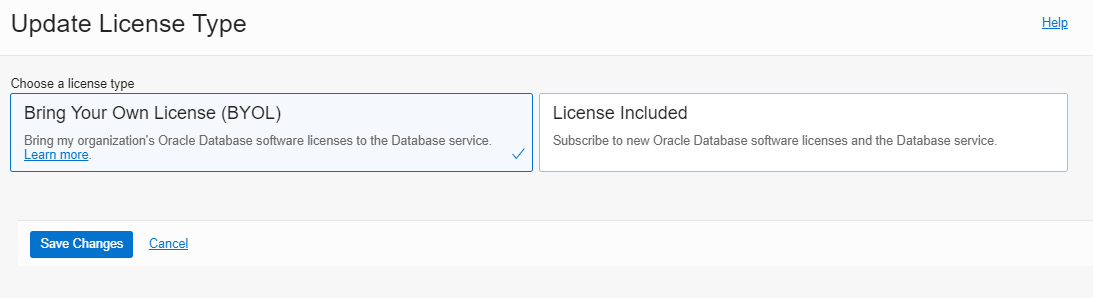
Figure 6.36 – Autonomous database license type
Renaming a database
The autonomous database can be renamed at any time using this option. The new name should have only letters and numbers, with a maximum of 14 characters. Special characters are not allowed. Note that the autonomous database OCID will not change during this operation, but the database will be restarted.

Figure 6.37 – Renaming the autonomous database
The rename operation requires a few subsequent activities because some of the operations depend on the database name and connection string:
- The wallet will be modified after a rename operation, hence it needs to be downloaded subsequently. This is applicable to Regional Wallet types as well.
- The connection string referred to at Application or Tools should be modified according to the new connection string.
- If a database link has been created for this database, then the link should be recreated using the new connection string.
- The rename operation cannot be done to databases that are involved in Data Guard or refreshable clone activities.
The next commonly used option is moving resources, that is, moving an autonomous database to a different compartment.
Move Resource
The Move Resource option is used to move an autonomous database to a different compartment in the same tenancy.
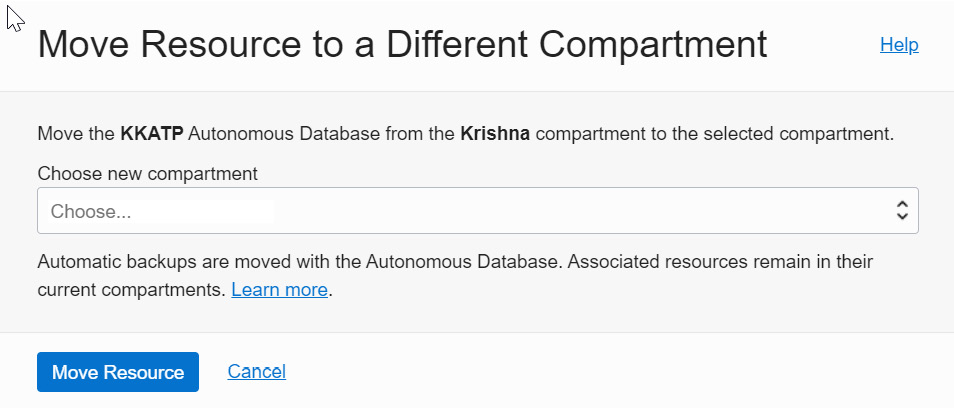
Figure 6.38 – Moving a database to a different compartment
Choose the new compartment, as shown in Figure 6.38, and click the Move Resource button. The autonomous database will be mapped to a new compartment. No changes are required after this operation.
The service console
Though an autonomous database is a managed environment, there are common questions, such as “How we can monitor our autonomous environment? How can we make sure that CPU and memory are effectively utilized by our autonomous database?” Basically, this information is very much required when we think about scaling up the resources.
We are going to talk about autonomous database monitoring tools and resources in detail in this section.
Let’s begin with the Service Console, which has tools for monitoring, administration, and development. The Service Console button is on the Overview page of our autonomous database, as shown in Figure 6.39.

Figure 6.39 – Autonomous database Service Console
Click the Service Console button. It will open a new window asking for database credentials, as shown in Figure 6.40. The database credentials could be for the Admin user or for any other database user. According to the user privileges, database metrics will be collected.

Figure 6.40 – Credentials for the Service Console
Once the database user credentials are entered, click on the Sign in button, as shown in Figure 6.40. It will direct you to the autonomous database Overview page:

Figure 6.41 – Autonomous database – Service Console – Overview page
The Overview page has details about how much storage and how much of the CPU is consumed by this database. It also has information about the number of OCPUs allocated to this database, SQL statement execution, and response time.
On the overview page, we can see Activity, Administration, and Development options. The Administration and Development options provide tools to perform administration and development jobs. The Activity page shows details about database activity and executed SQL queries, and displays the details in graphs, as shown in Figure 6.42.

Figure 6.42 – Autonomous database – Service Console – Activity
On the same page, the Monitored SQL tab shows details of the SQL statements.
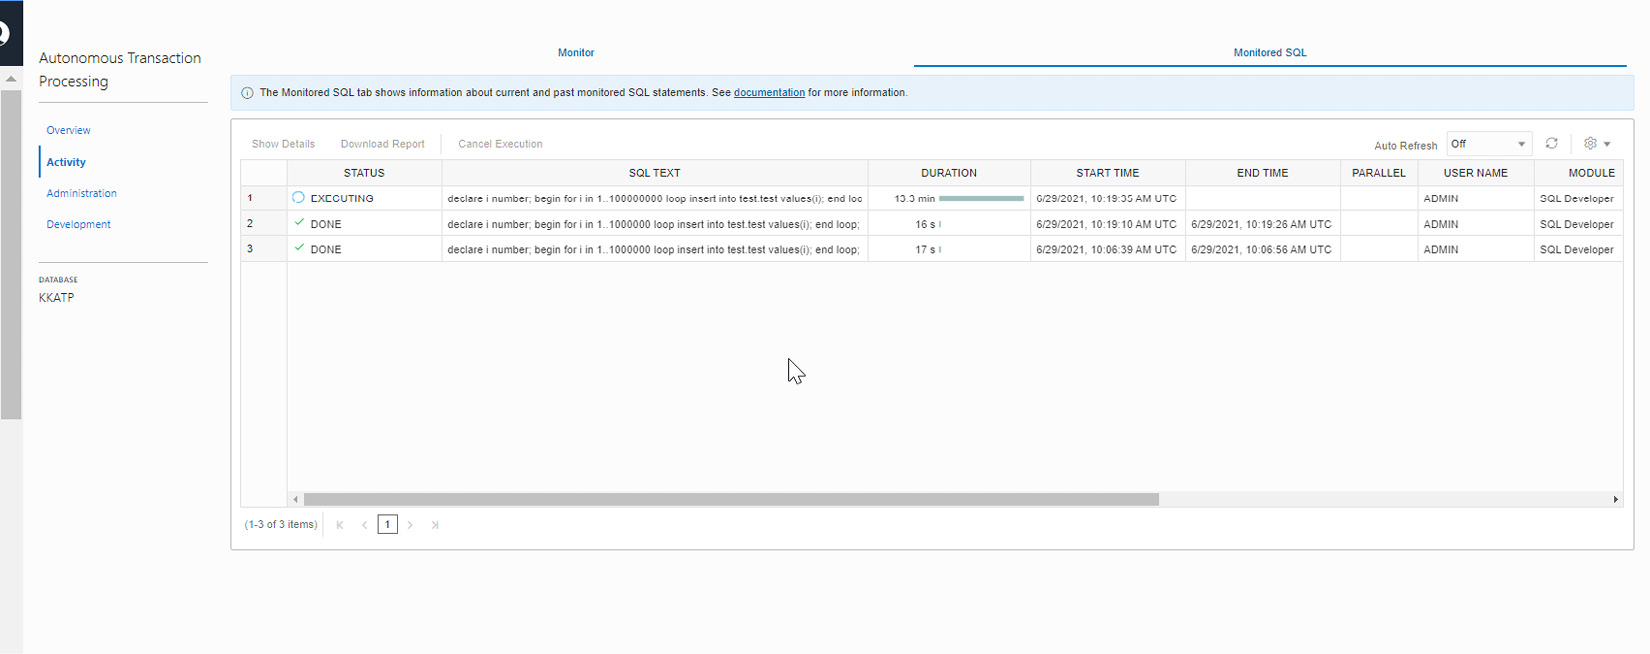
Figure 6.43 – Autonomous database – Service Console – Activity
We can see details about SQL commands, the duration and status of execution, the username, and the module executing the SQL commands.
Changing the workload type
We specify the workload type at the time the autonomous database was created. We will have to choose the appropriate workload type, as shown in Figure 6.44.
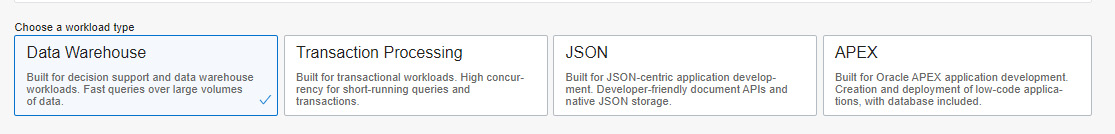
Figure 6.44 – Autonomous database – Workload type
We can change the workload type after database creation. But this option is available only to databases with the JSON and APEX workload type, and it can be converted only to ATP. Go to the APEX or JSON database information page and click More Actions. It will have the Change Workload Type option, as shown in the following screenshot:

Figure 6.45 – Autonomous database – Change Workload Type
Click Change Workload Type. We will get a window to confirm this conversion, as shown in the following screenshot.

Figure 6.46 – Autonomous database – Change Workload Type
The conversion is irreversible, and the usage charges will vary after changing the workload type. When you click the Convert button, the automatic conversion happens in the background. After the conversion, we can see the change in the workload type of the database, as shown in the following screenshot.

Figure 6.47 – Autonomous database – workload type conversion
Enabling Operations Insights
Operations Insights analyzes the database and then provides wide-ranging insights about resource consumption, the capacity of the database, and hosts. We can get more details regarding database management from Operations Insights. This cloud-native feature is available to autonomous databases (ATP and ADB) and on-premises Oracle databases (external databases). This feature can also work on OCI Compute instances (Linux only) where the OS Management Service Agent is deployed. By default, the Operations Insights option for autonomous databases is disabled. We can find this information on the Autonomous Database Information page, as shown in Figure 6.48.

Figure 6.48 – Autonomous database – Operations Insights
Click on the Enable link, and you will see a pop-up window requesting confirmation, as shown in Figure 6.49.

Figure 6.49 – Autonomous database – Enable Operations Insights
Now click on the Enable button. It will enable Operations Insights and provide a link to view it, as shown in the following screenshot:

Figure 6.50 – Autonomous database – enabled Operations Insights
Click on View. It will open another window containing the captured details, as shown in Figure 6.51.

Figure 6.51 – Autonomous database – Operations Insights overview
The Overview page has links for DB Capacity Planning and Oracle SQL Warehouse.
The DB Capacity Planning page has details about CPU, memory, and storage usage, as shown in Figure 6.52. Currently, memory is applicable only to external databases.
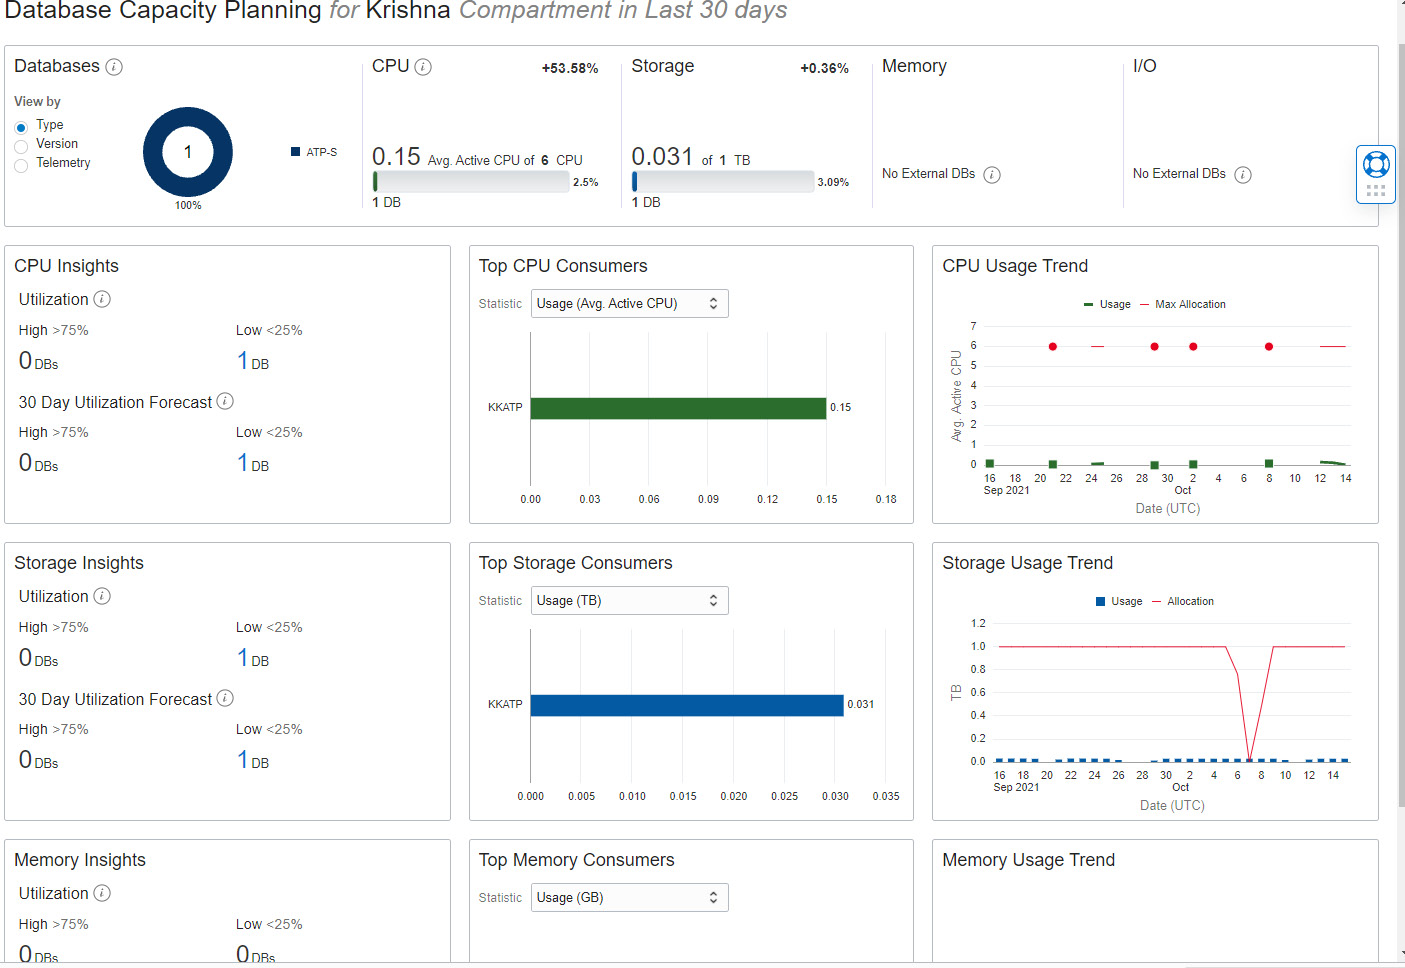
Figure 6.52 – Autonomous database – Database Capacity Planning
The analysis results are projected based on the compartment and reflect the last 30 days of data. This analysis helps us to understand resource usage trends and allows us to proactively plan and avoid unexpected capacity shortage issues. For example, as shown in Figure 6.53, it analyzes CPU usage and forecasts future usage. We can also get the aggregate CPU usage of all databases in the same compartment.

Figure 6.53 – Autonomous database – Database CPU details
As well as CPU forecasts, we can also forecast storage usage, as shown in Figure 6.54.

Figure 6.54 – Autonomous database – Database Storage details
The Oracle SQL Warehouse section provides key insights into SQL performance issues. We can identify problematic SQL statements such as degrading statements (statements with more than a 20% increase in SQL response time), SQL statements with variability (calculated based on the standard deviation of the SQL response time), inefficient statements (more than 20% inefficiency, derived from inefficient wait times), SQL statements that require improvement (statement with more than a 20% decrease in SQL response time), and SQL statements with plan changes (statements with multiple execution plans).
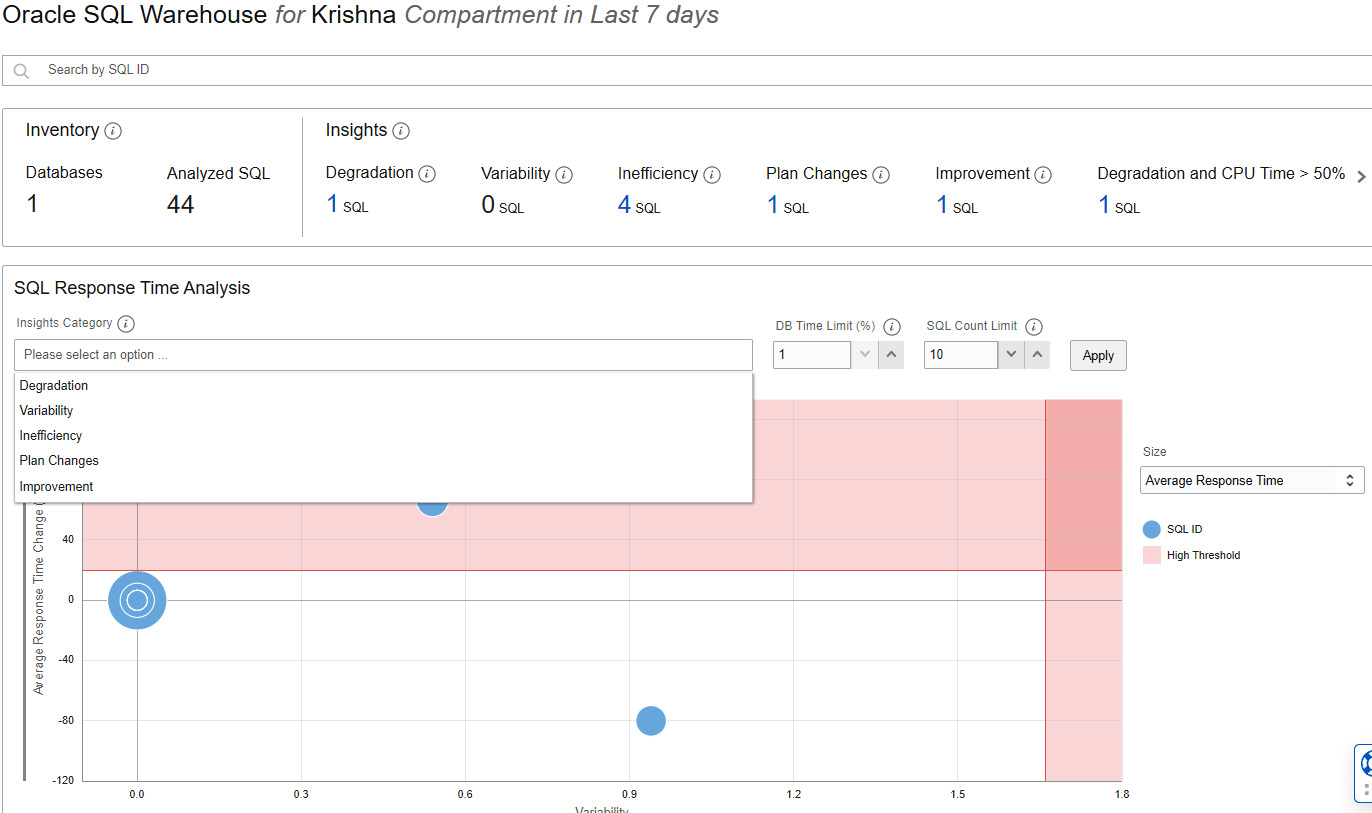
Figure 6.55 – Autonomous database – Oracle SQL Warehouse
We can also identify SQL statements with high CPU and I/O usage, as shown in Figure 6.56.
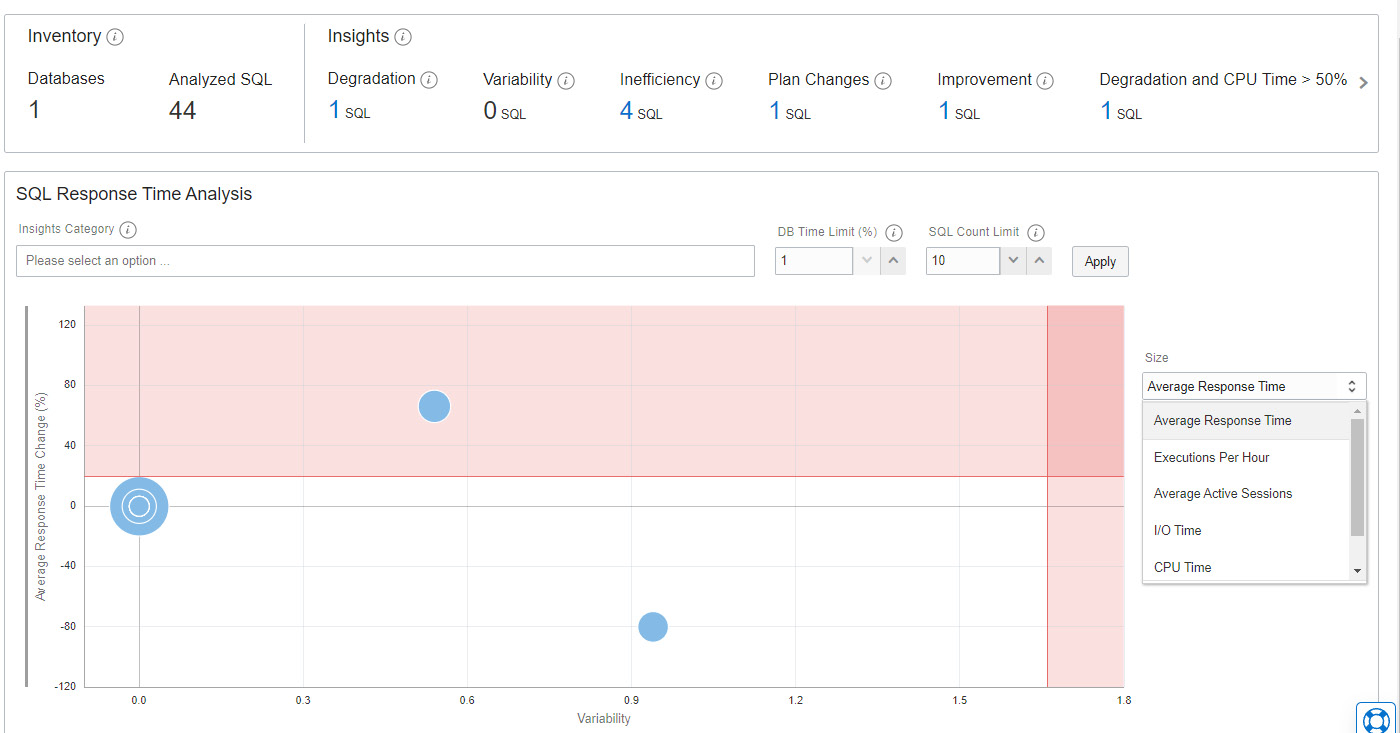
Figure 6.56 – Autonomous database – SQL Response Time Analysis
The Administration option on the Operations Insights page has links to add more databases as shown in Figure 6.57.
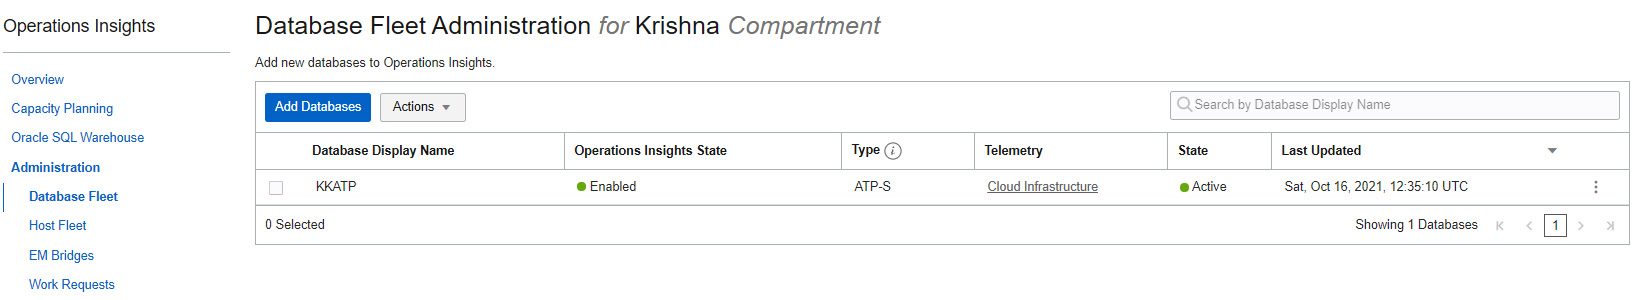
Figure 6.57 – Autonomous database – Add Database
Figure 6.57 – Autonomous database – Operations Insights
It also has links to Add Hosts to Operations Insights, as shown in Figure 6.58.
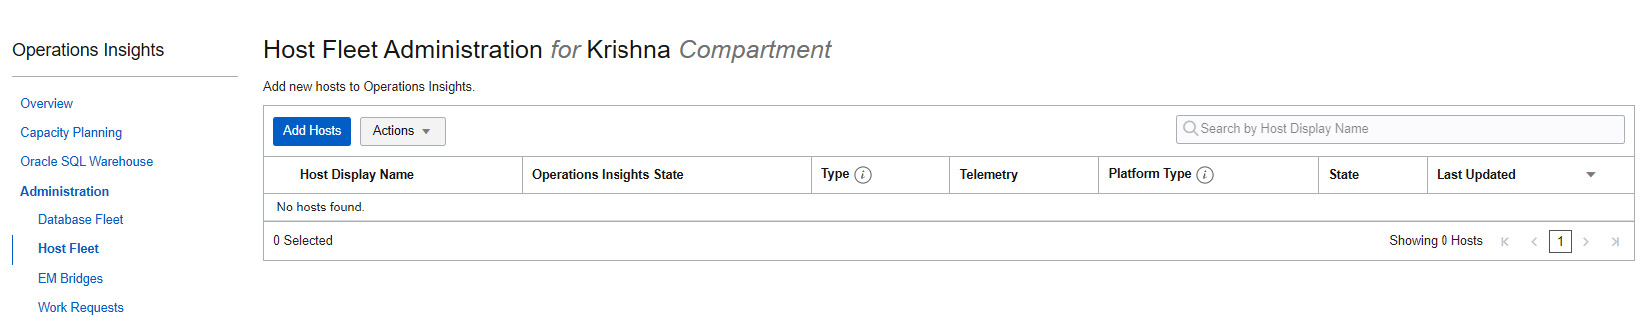
Figure 6.58 – Autonomous database – Add Hosts
To add compute hosts, it should be with a Linux operating system image, and an Oracle cloud agent should have been installed in it. If the existing compute doesn’t enable with Oracle cloud agent, then it can be installed using the Linux Yum repository:
yum install -y oracle-cloud-agent
Databases monitored through Enterprise Manager also can be added to Operations Insights. By adding it like this, we can perform resource analysis on databases managed by Enterprise Manager. The database could even be an external database. Basically, the data collected by Enterprise Manager targets and the Oracle Management Repository (OMR) can be transferred to OCI object storage and from there, Operations Insights can pick the data to analyze. These operations can be made automatic, whereby Operations Insights will pick the latest data.

Figure 6.59 – Autonomous database – Enterprise Manager Bridge
Terminate
The terminate option drops the autonomous database. Before performing a drop operation, additional confirmation will be required. We need to provide the name of our autonomous database as confirmation to proceed with the termination.

Figure 6.60 – Autonomous database termination
Registering autonomous databases with Oracle Data Safe
Oracle Data Safe provides a unified set of critical data security services for Oracle databases, whether they are running in the Oracle Cloud, on-premises, or in third-party clouds. In general, when our database is on the internet there is always the possibility of getting hacked, and therefore there is the possibility of a data breach. Data Safe overcomes all unexpected threats. Data Safe identifies database configuration drifts through overall security valuations, which helps to identify gaps and take corrective action. It flags dangerous users or behavior seen in the database and checks whether they are controlled. It audits user activity, tracks unsafe actions, raises alerts, rationalizes compliance checks, and also masks sensitive data.
In general, we need to perform a few prerequisite tasks in the database before registering it with Data Safe. But for autonomous databases, the Data Safe service account (DS$ADMIN) is pre-created. The account will be initially locked with a password expired status. When we register the autonomous database with Data Safe, OCI unlocks this account and resets its password.
To use Data Safe with an autonomous database, we first need to register the autonomous database. On the Autonomous Database Information page, we can find a section related to Data Safe.

Figure 6.61 – Autonomous database – Registering with Data Safe
Click Register, and it will ask for confirmation.

Figure 6.61 – Autonomous database – Data Safe registration confirmation
Click Confirm to proceed. It will take a few minutes to complete the registration. After successful registration, we should see the View link, as shown in the following screenshot.

Figure 6.63 – Autonomous database – Data Safe Registered status
Click View, which will take us to the Data Safe page, as shown in the following screenshot.
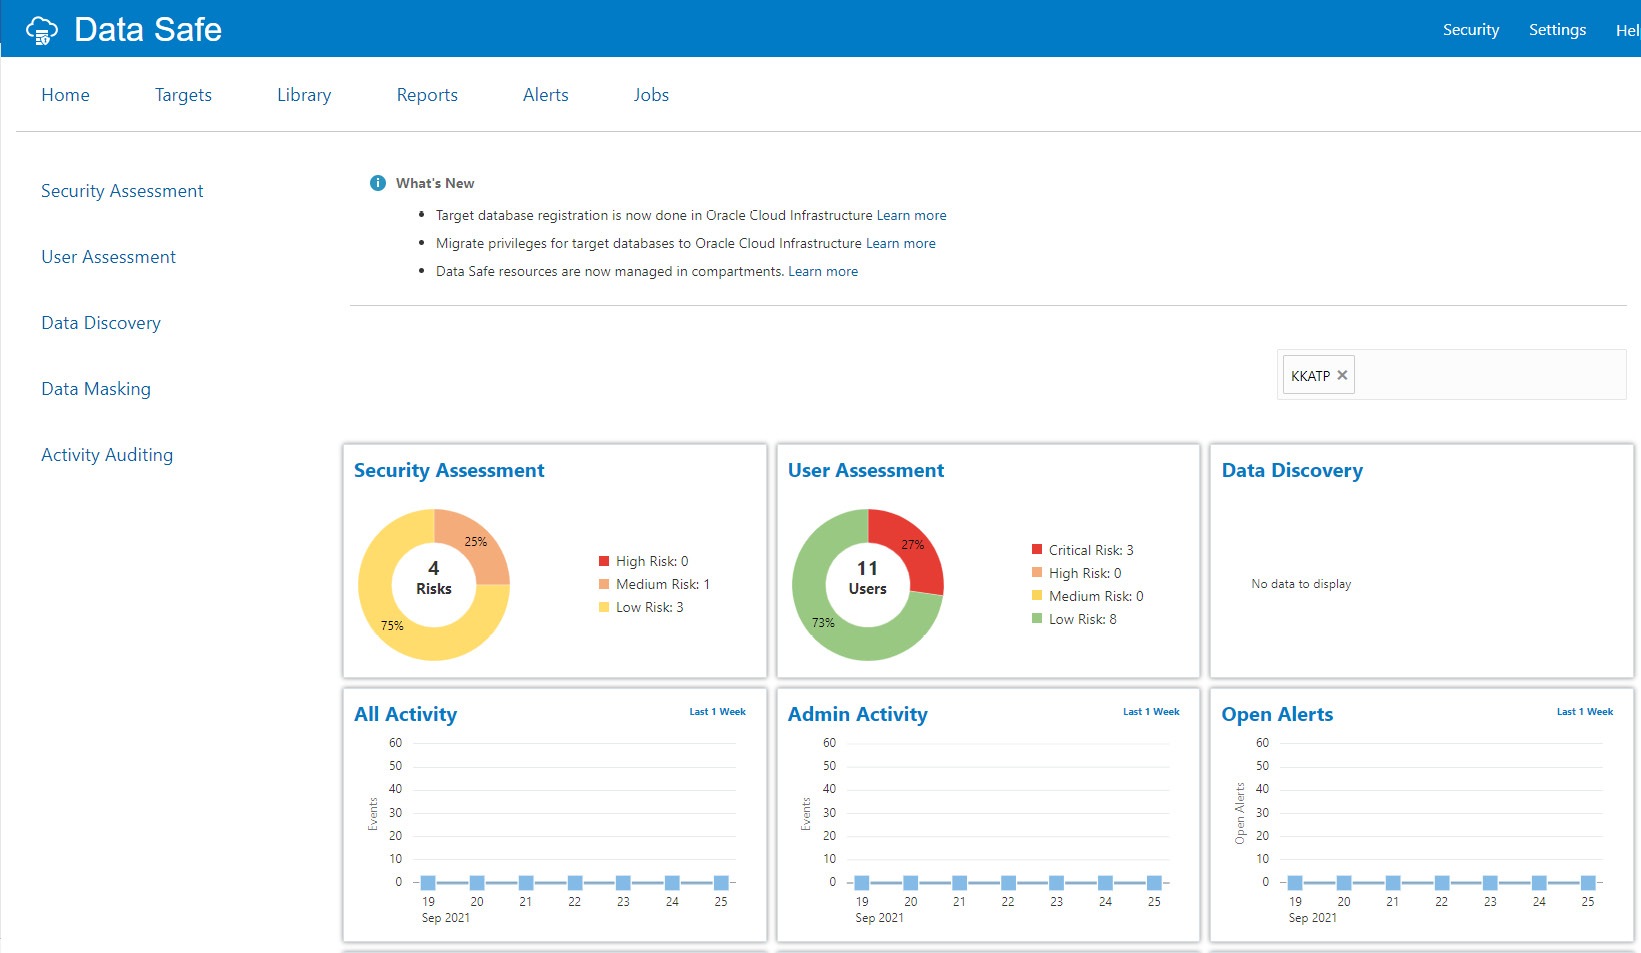
Figure 6.64 – Autonomous database – Data Safe overview
Data Safe analyzes the database and assesses security and users. Let’s discuss the options one by one.
The first option to discuss is Targets. Click the target at the top. It shows the screen shown in the following screenshot.

Figure 6.65 – Autonomous database – Data Safe Targets
We can find the registered autonomous databases as target names there. The auditing feature audits the user activity on the registered database so that we can monitor database usage and be alerted about unusual database activities. To view audits and alerts relating to the database, we need to provide audit and alert policies. To do that, click Home and then Activity Auditing as shown in the following screenshot.
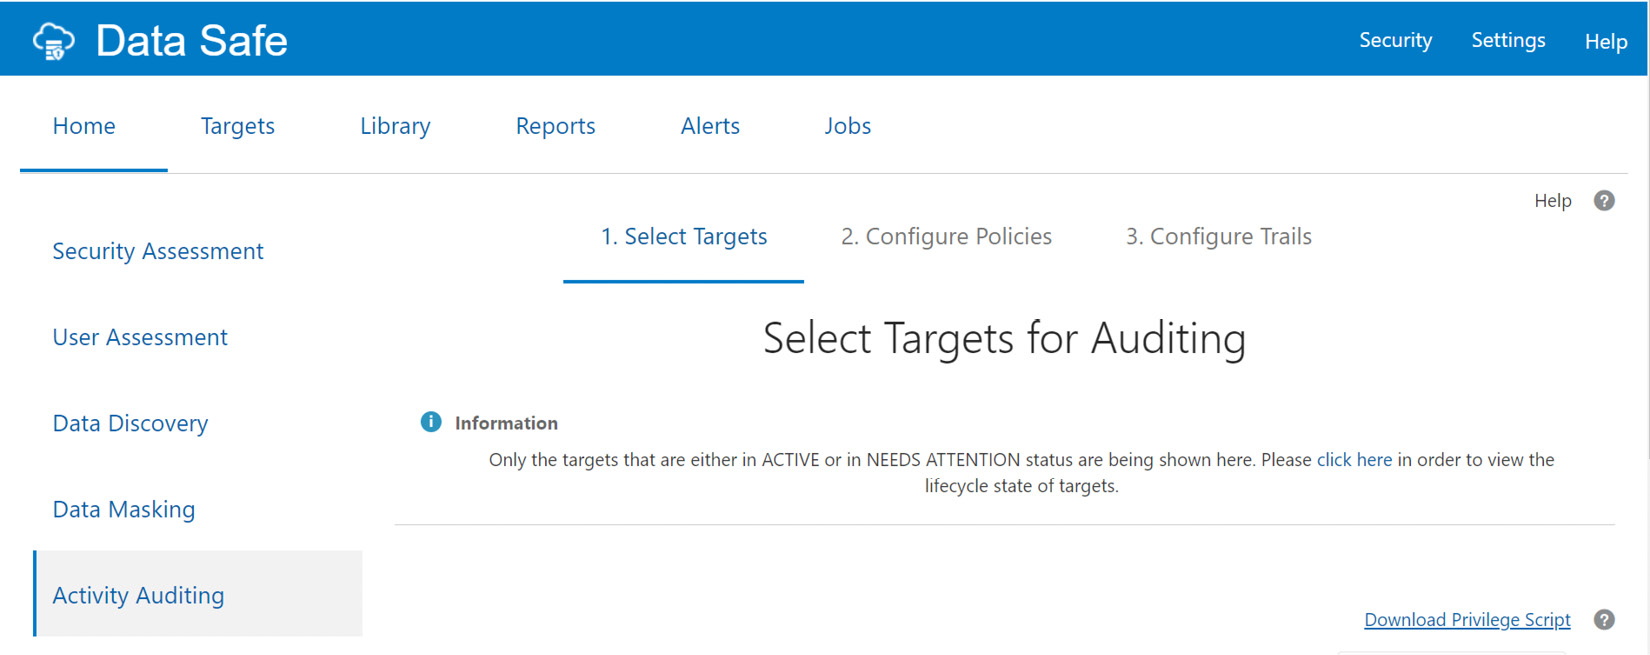
Figure 6.66 – Autonomous database – Data Safe Activity Auditing
We can see the list of target databases in the following screenshot. Choose the autonomous database and click on the Continue button.
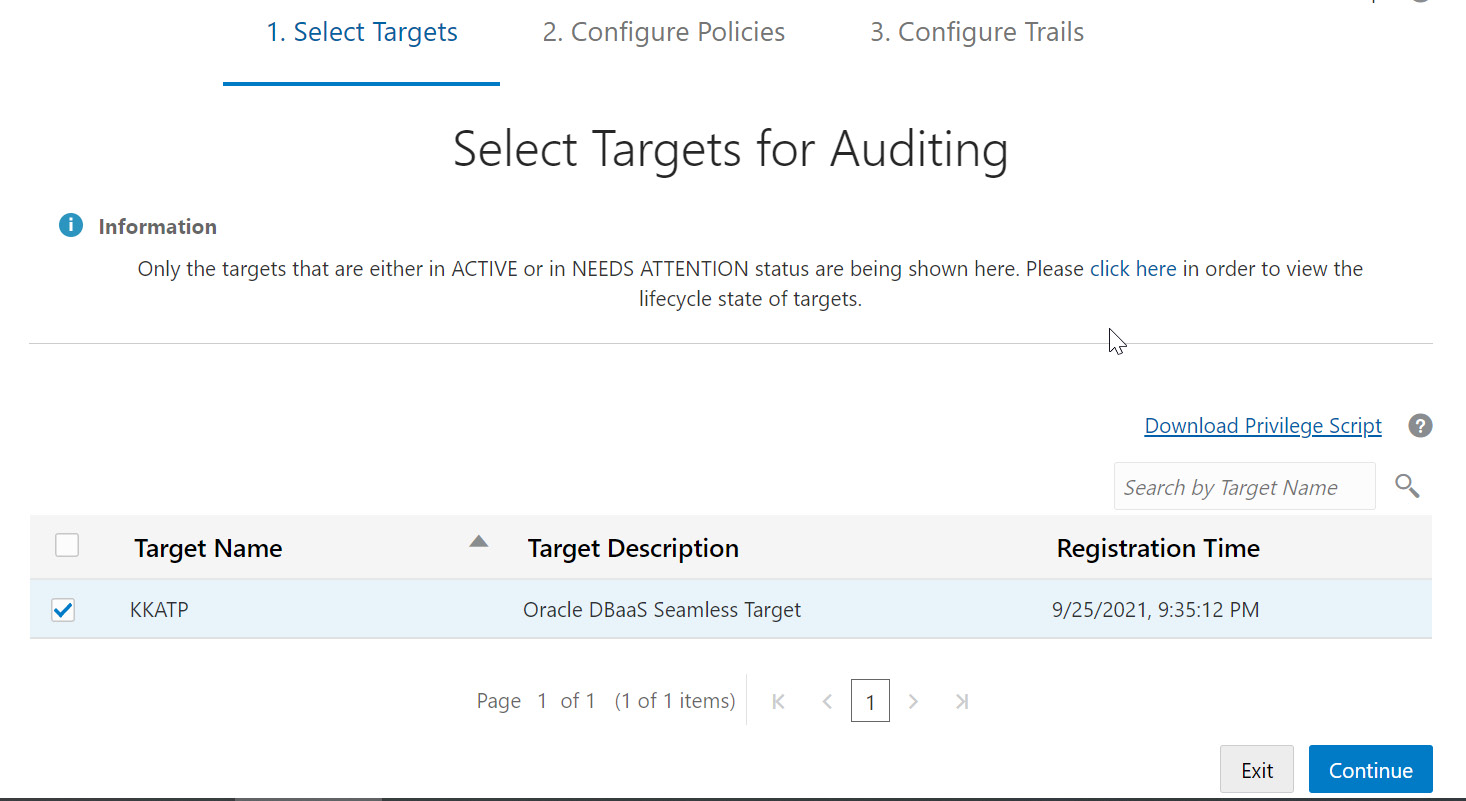
Figure 6.67 – Autonomous database – Data Safe audit targets
The next page is for retrieving audit policies. Check the checkbox for the autonomous database and click the Retrieve button to retrieve the audit policies for the database. We need to wait until a green check mark is displayed in the Retrieval Status column, as shown in the screenshot.

Figure 6.68 – Autonomous database – retrieving audit policies
Click the Continue button. The policies will be configured, and it will display the default policies configured for the database.

Figure 6.69 – Autonomous database – Data Safe audit and alert policies
In addition to the default policies, additional policies can be configured. Click the target database name. It will list the available Audit Policies and Alert Policies, as shown in the following screenshot.

Figure 6.70 – Autonomous database – configuring an audit policy
Oracle has many pre-defined policies, as shown in Figure 6.71. We can choose any policies that we require.

Figure 6.71 – Autonomous database – configuring audit policies
The Critical Database Activity policy allows us to audit critical database activities, for example, when a user, role, or profile is created, modified, or dropped.
The Login Events policy tracks all users’ (Oracle-maintained users and custom users) login and logoff activities.
The Database Schema Changes (DDL) policy tracks all Data Definition Language (DDL) commands issued by any database user, for example, when a table, view, or trigger is created, modified, or dropped.
The Admin Activity policy lets you audit all activities by privileged administrators.
We could also compare the settings with Center for Internet Security (CIS) standards. CIS is a world-recognized organization that provides consensus-based best practices for helping organizations assess and improve their cyber security posture. The CIS Recommendations policy is a pre-defined unified audit policy in Oracle Database designed to perform audits that the CIS recommends. On the next tab, we can configure alert policies, as shown in the following screenshot.

Figure 6.72 – Autonomous database – Data Safe alert policies
Alert policies define which event alerts should be invoked and their severity levels. All alert policies are rule-based, and an alert gets triggered when the event occurs that will be displayed on the Alerts page. Click Provision to enable the desired alert policies.
The next section is Configure Trails. This is where we start the audit collection. If audits have not been collected so far, then the state is Not Started, as shown in the following screenshot.

Figure 6.73 – Autonomous database – Data Safe audit collection
We need to first define from which date the audit data should be collected. Choose a date using the calendar icon available in the Collect Audit Data From column. Once the date and time have been chosen, it will start calculating how much audit data has to be collected, as shown in Figure 6.74.
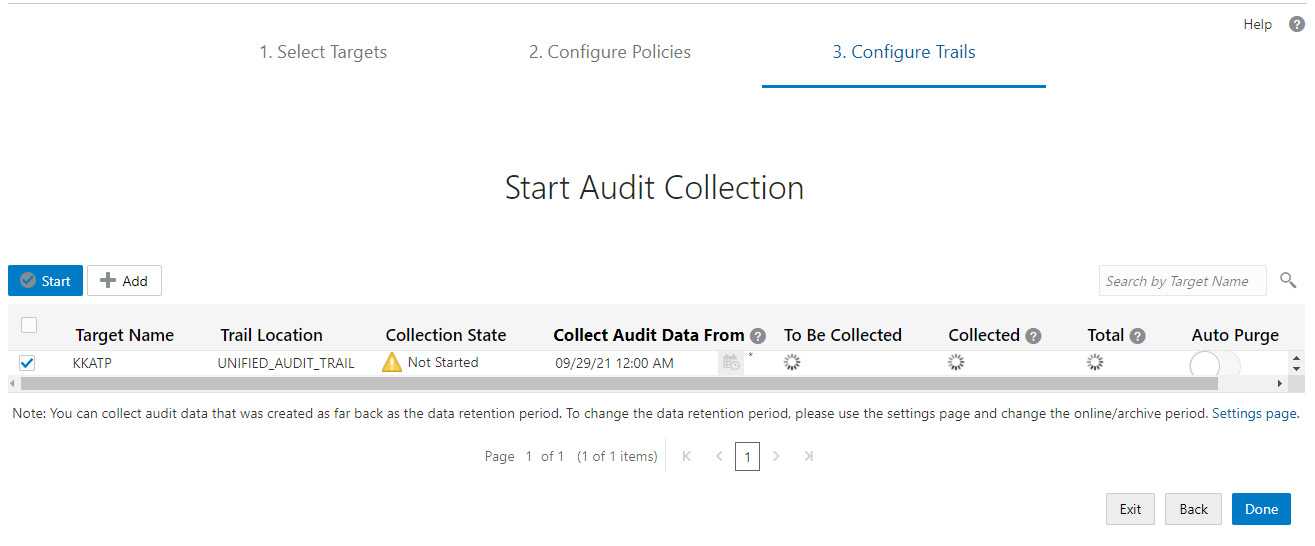
Figure 6.74 – Autonomous database – starting audit collection
Once the calculation is done, the To Be Collected column is updated with a value.

Figure 6.75 – Autonomous database – collecting audits
When the To Be Collected column contains a value, click the Start button to start collecting audit data.
We will be asked for confirmation before starting to collect audit data, as shown in the following screenshot.
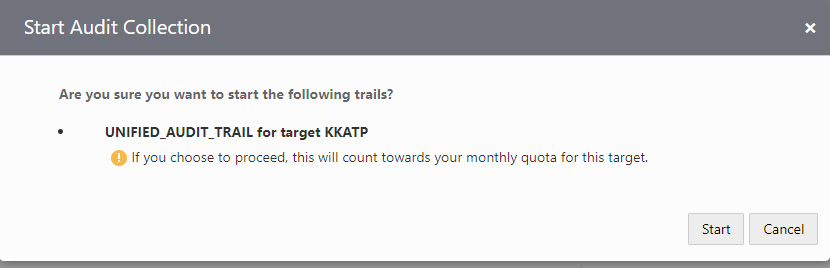
Figure 6.76 – Autonomous database – starting audit trails
A common challenge with auditing is purging the data at regular intervals. Data Safe provides an Auto Purge trail option. This option is available on the right-hand side, as shown in the following screenshot.
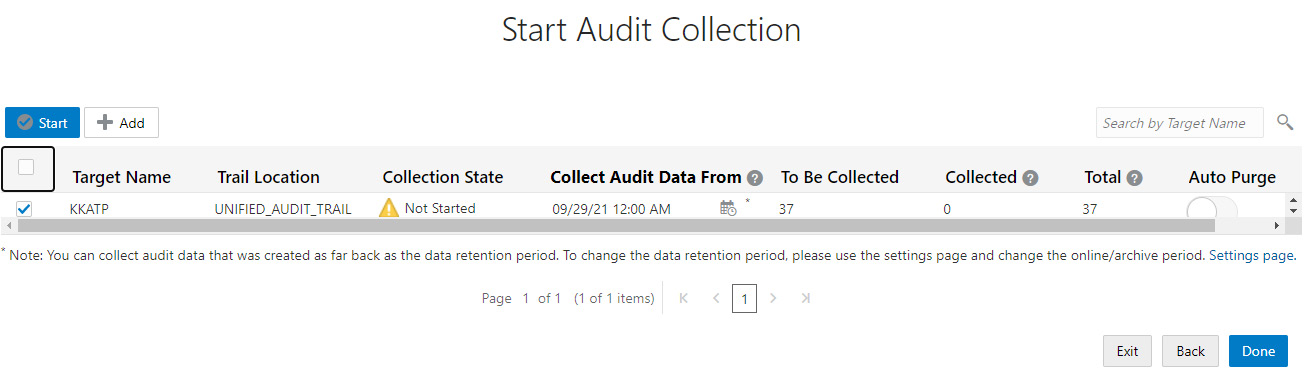
Figure 6.77 – Autonomous database – Auto Purge trail
Click the Done button in the Auto Purge trail column. It will be asked for confirmation.
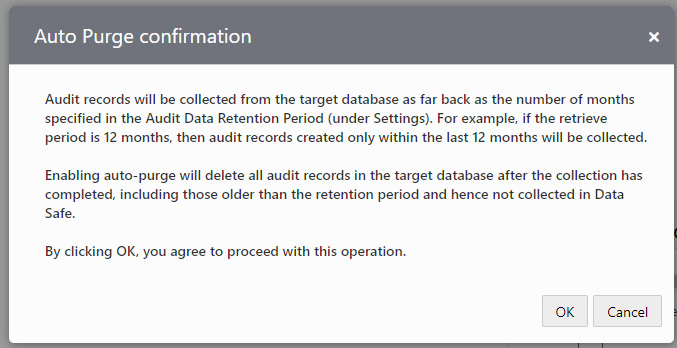
Figure 6.78 – Autonomous Database – Auto Purge confirmation
Click OK to initiate auto-purge. Once the audit data is collected, the Collection State column changes to IDLE, as shown in the following screenshot.

Figure 6.79 – Autonomous database – Collection State
The collected audit data can be viewed through reports. Various reports are available, as shown in the following screenshot.

Figure 6.80 – Autonomous database – Data Safe Summary details
Many reports are generated using audit data. We shall discuss Security Assessment and User Assessment reports in upcoming sections.
Security Assessment
The Security Assessment report lists the security risks seen in the database. On the reports page, click Security Assessment. This categorizes the security risks with different levels, as shown in Figure 6.82. Each risk type has a unique color.
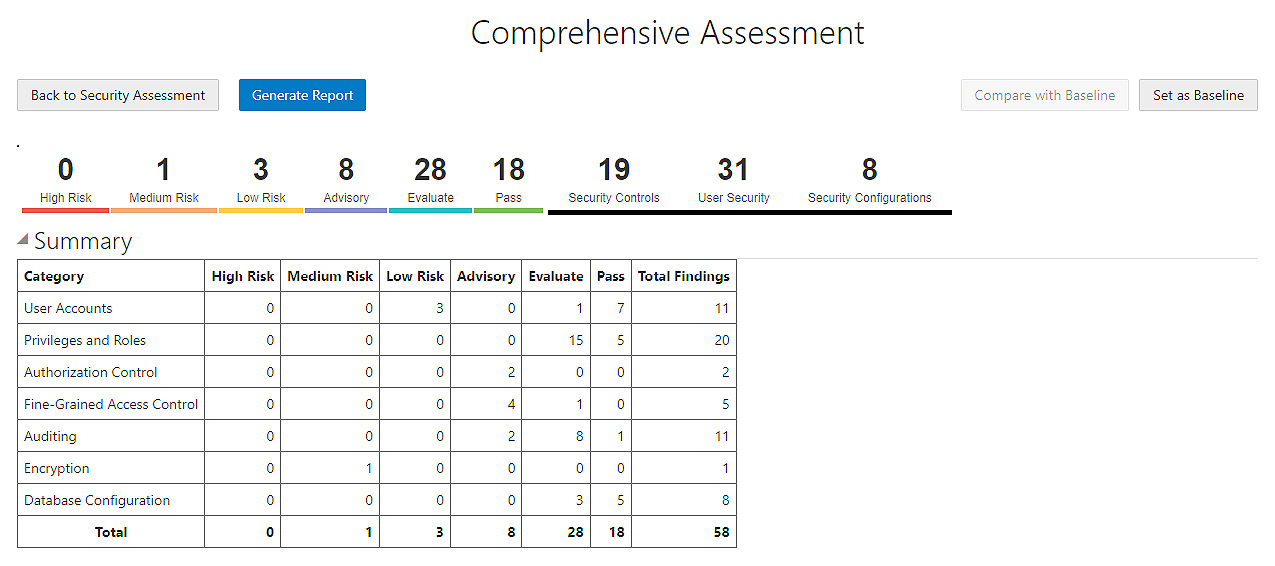
Figure 6.81 – Autonomous database – Data Safe – Security Assessment
We can generate the report with all the findings using the Generate Report button. We can also download the report for reference. The findings are categorized into multiple sections, such as User Accounts and Privileges and Roles. Each section details the security finding and its risk level. For example, the database has inactive users in the database, which is a low security risk, as shown in Figure 6.82.
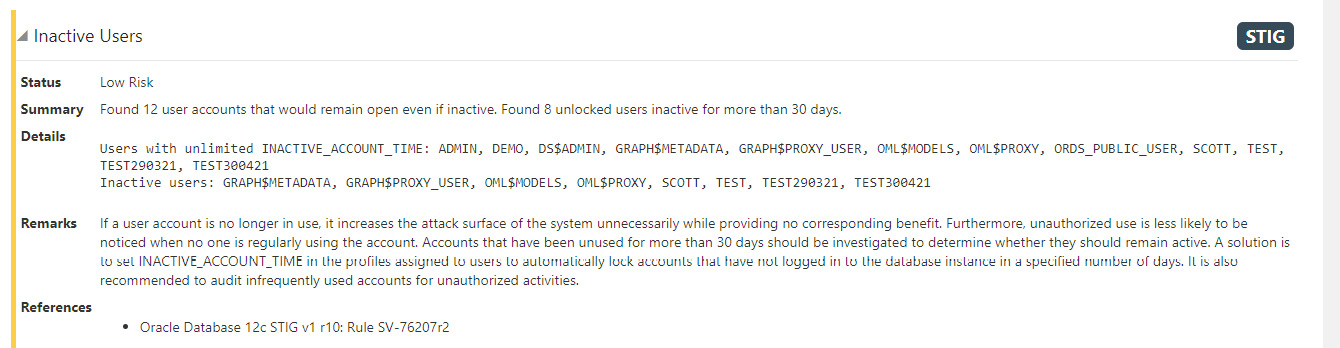
Figure 6.82 – Autonomous database – Data Safe – Security Assessment
User Assessment
Let’s discuss the User Assessment report. It validates user privileges and reports the risks associated with user settings.

Figure 6.83 – Autonomous database – Data Safe – User Assessment
As shown in Figure 6.83, the risks are categorized as Low, Medium, High, and Critical. Alerts are grouped by user. We can also find a table that contains the User Name information and all alerts related to that user. If we click on User Name, we can find all alerts related to that user, as shown in Figure 6.85.

Figure 6.84 – Autonomous database – Data Safe – User Assessment details
The preceding screenshot shows alerts relating to the ADMIN user. There are 21 audit records available for this user to review. We can view details about the audit records by clicking on the audit record number.
The following figure displays a few audit records. This particular record details a login failure with the ADMIN user.

Figure 6.85 – Autonomous database – Data Safe – login failure details
We have discussed SecurityAssessment and User Assessment reports in this section, but there are many more reports to view. Can we view all reports in one place? Yes, we the have option to view all the activities.
In the Reports section, click Activity Auditing and All Activity. It will display details about all the activities.

Figure 6.86 – Autonomous database – Data Safe – Reports
As shown in Figure 6.86, we can see details of all the activities. This page totals up the number of occurrences of each activity and projects them on that page. If we click on the number, we can see details about that activity. For example, if we click Login Failures, we will see the User Assessment report that we discussed in the previous session.
Like audits we can also view all alerts captured for this database. Click the Alerts tab next to Reports.

Figure 6.87 – Autonomous database – Data Safe – All Alerts
As shown in the figure, the Alerts page displays all alerts along with details. By clicking any alert ID in the table, we can get more details about the alert.

Figure 6.88 – Autonomous database – Data Safe – Alert Details
The preceding screenshot shows the details of an alert ID. It contains the client IP, the kind of event, and its operation status.
This chapter has provided insights into how to effectively manage autonomous databases. In the next chapter, we will discuss the security aspects of autonomous databases.
Summary
This chapter provided insights into all the management options for autonomous databases. We have explored how to start/stop a database, scale it up/down, clone it, and manage it. Also, we have discussed the performance metrics collected by the autonomous database and how they can be interpreted. The topics that we have discussed in this chapter will be required for day-to-day administrative activities. We now understand which tasks are automated and where manual effort is required.
In the next chapter, we will discuss a very important topic: autonomous database security. Most security attributes will be taken care of automatically, but users may need to contribute in a few places. We will discuss this in detail in the next chapter.