
Chapter Five
Fuel Cell Operating Conditions
Fuel cell operating conditions include:
Typical PEM fuel cell operating conditions are listed in Table 5-1. It should be mentioned that the values listed in Table 5-1 do not represent rigid boundaries but rather the typical values.
Table 5-1 Typical PEM Fuel Cell Operating Conditions
| H2/air: Ambient to 400 kPa | |
| Pressure | H2/O2: up to 1,200 kPa |
| Temperature | 50°C to 80°C |
| Flow rates | H2: 1 to 1.2 |
| O2: 1.2 to 1.5 | |
| Air: 2 to 2.5 | |
| Humidity of reactants | H2: 0 to 125% |
| O2/Air: 0 to 100% |
These parameters are discussed in the following sections.
5.1 Operating Pressure
A fuel cell may be operated at ambient pressure or it may be pressurized. As we have already learned, a fuel cell gains some potential when the operating pressure is increased (Figure 5-1, for example [1]), thus generating more power. The gain is not linear with pressure, but it is proportional to the logarithm of pressure ratio. However, pressurization of reactant gases requires power, which, as illustrated in Chapter 9, may offset the gain. Whether there will be any net power gain depends on fuel cell polarization curves, efficiency of the compression devices, system configuration, and so on and therefore must be evaluated for each fuel cell system. The issue of pressurization is also related to the issue of water management, which in turn is related to the operating temperature. This issue, therefore, must be addressed from a system perspective.
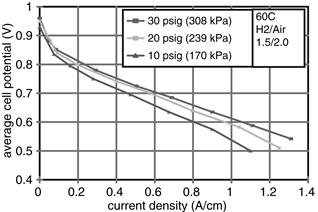
Figure 5-1 Fuel cell performance at various operating pressures [1].
For a hydrogen/oxygen fuel cell, when both reactants are already stored in pressurized tanks there is no power penalty for compression, so such fuel cells usually operate at elevated pressures, typically from 3 bars up to 10–12 bars. (Note that because of logarithmic dependency the voltage/power gain in going from 10 to 100 bars would be the same as going from 1 to 10 bars.) However, for hydrogen/air fuel cells, pressurization of air requires a mechanical device, a blower or a compressor, which adds to the complexity of the system and which requires power. For such systems the choice is to operate at ambient conditions at the fuel cell exhaust or to operate at elevated pressure, typically up to 3 bars.
When a fuel cell is fed the reactant gases from a pressurized tank, its pressure is controlled by a backpressure regulator placed at the outlet (Figure 5-2a). This pressure regulator keeps the desired preset pressure at the fuel cell outlet. Very often in laboratory settings the inlet pressure is not even recorded. The inlet pressure is always higher because of inevitable pressure drop from inlet to outlet due to reactants’ passage through tiny channels inside the fuel cell. However, when the reactant gas (for example, air) is fed to a fuel cell by a mechanical device, a blower or a compressor, which is the case in any practical system, it is the inlet pressure that matters (Figure 5-2b). The compressor or the blower must be capable of delivering the required flow rate at that pressure. The backpressure regulator may still be used to pressurize the cell or, if no backpressure regulator is used, the gas leaves the cell at atmospheric pressure. Note that atmospheric pressure may vary, too, depending on weather conditions or elevation. (Many fuel cell experiments reported by the Los Alamos National Laboratory are actually conducted at substandard pressure because of elevation.)

Figure 5-2 Fuel cell operating pressure as a function of reactant gas supply: (a) supply from a high-pressure tank, (b) supply by a mechanical device, a compressor or blower.
5.2 Operating Temperature
In general, a higher operating temperature results in higher cell potential; however, for each fuel cell design there is an optimal temperature. Figure 5-3 shows an example of how an optimum operating temperature exists [2]. For that particular fuel cell, the optimum operating temperature appears to be between 75°C and 80°C. Operation above 80°C results in diminished performance.

Figure 5-3 Effect of operating temperature on fuel cell performance [2].
A PEM fuel cell does not have to be heated up to the operating temperature to become operational. As already shown in Figure 3-19, a fuel cell can operate even at freezing conditions, but it cannot reach its full rated power. The car companies have put a lot of effort into investigating fuel cell survival and cold-start capabilities for temperatures as low as –30°C.
The upper limit of operating temperature is determined by the membrane. Because the main function of the proton exchange membrane depends on its state of hydration, the typical PSA membranes cannot operate above 100°C without a danger of being dehydrated and eventually damaged. This temperature is already close to the glass transition temperature of the polymer. For that reason PEM fuel cells with PSA or similar membranes are rarely operated at temperatures above 90°C but more typically up to 80°C. Different types of membrane (for example, phosphoric acid, H3PO4, doped polybenzimidazole, or PBI membranes), in which water as the proton solvent is replaced by the acid, allow operation at 140°C or higher.
The operating temperature of practical fuel cells, similarly to operating pressure, must be selected from the system perspective, taking into account not only the cell performance but also the system requirements, particularly the size and parasitic power requirements of the heat management subsystem. A fuel cell generates heat as a byproduct of the electrochemical reaction. To maintain the desired temperature, heat must be taken away from a fuel cell. Some heat dissipates from the outer surface of the fuel cell and some must be taken away with a cooling system. The medium that takes away the heat may be air, water, or a special coolant. The inner design of the fuel cell must allow the heat transfer to occur. Sometimes small fuel cells need a heater to reach the operating temperature. In these fuel cells so much heat is being taken away from the outer surface that an additional heater is required. This, of course, is not very practical, but it is sometimes necessary for testing fuel cells at a desired temperature.
The following is the fuel cell heat balance:
![]() (5-1)
(5-1)
In other words, the heat generated in the fuel cell plus the heat brought into the cell with reactant gases is taken away from the cell by the reactant gases leaving the cell, by heat dissipation from the cell surface to the surrounding, and by the coolant.
The temperature inside a fuel cell may not be uniform; it may vary from inlet to outlet, from inside out, or from cathode to anode. So which temperature is the cell temperature? The cell temperature may be approximated by the following temperatures, which are much easier to measure than the cell temperature:
Because of finite temperature differences needed for heat transfer inside a fuel cell, none of these is exactly the cell operating temperature. The surface temperature is clearly lower than the temperature inside a fuel cell in a case in which the fuel cell is heating itself, and it is actually higher than the inside temperature if the fuel cell is heated with the heating pads on its surface. Because most of the losses in the fuel cell may be associated with the cathode reaction, the temperature of air exiting the fuel cell is a good approximation of the cell operating temperature, although again the temperature inside a fuel cell must be at least slightly higher than the air temperature. In a case in which the cell temperature is maintained by the flow of coolant through the cell, the coolant outlet temperature may be used as the operating temperature. The accuracy of these approximations depends on thermal conductivity of the cell materials and air and coolant flow rates.
5.3 Reactant Flow Rates
The reactants’ flow rate at the inlet of a fuel cell must be equal to or higher than the rate at which those reactants are being consumed in the cell. The rates (in mol s−1) at which hydrogen and oxygen are consumed and water is generated are determined by Faraday’s law:
![]() (5-2)
(5-2)
![]() (5-3)
(5-3)
![]() (5-4)
(5-4)
where:
The mass flow rates of reactants’ consumption (in g s−1) are then:
![]() (5-5)
(5-5)
![]() (5-6)
(5-6)
The mass flow rate of water generation (in g s−1) is:
![]() (5-7)
(5-7)
Most often, the flow rates of gases are expressed in volumetric units, that is, normal liters per minute (Nl min−1) or normal liters per second (Nl s−1), or normal cubic meters per minute (Nm3 min−1) or normal cubic meters per hour (Nm3 h−1). Normal liter or normal cubic meter is a quantity of gas that would occupy 1 liter or 1 cubic meter, respectively, of volume at normal conditions, namely atmospheric pressure, 101.3 kPa, and 0°C. Often in practice and in technical literature, standard conditions are used, such as standard liter per minute (slpm), standard cubic foot per minute (scfm), or standard cubic foot per hour (scfh), but there is a great deal of confusion about standard conditions that vary from source to source: values of 15°C, 15.6°C (60°F), 20°C (68°F), and 21.1°C (70°F) are being used for standard temperature, and values of 101 kPa (1 atm or 14.696 psi), 1 bar (0.987 atm or 14.5 psi), or 30 inHg (1.06 bar or 14.73 psi) have been used for standard pressure. Note that in atmospheric science standard atmosphere is defined at sea level at a temperature of 15°C (59°F) and pressure of 101.3 kPa, whereas most chemical handbooks and textbooks refer to 25°C as standard or reference temperature. Therefore, to avoid confusion about standard temperature and pressure, it is better to use units such as normal liter (Nl) or normal cubic meter (Nm3), which is an SI unit. Also note that a liter is not an SI unit, but it has been accepted by the International Committee for Weights and Measures (CIPM). The symbol for liter is the letter 1, but to avoid the risk of confusion between the letter l and the number 1, the General Conference on Weights and Measures (CGPM) adopted the alternative symbol for the liter, L, which is more widely used in the United States [3]. Thus, both l and L are internationally accepted symbols for the liter. The script letter ![]() or abbreviation lit are not approved symbols for the liter.
or abbreviation lit are not approved symbols for the liter.
For any ideal gas, mols and volumes are directly related by the equation of state:
![]() (5-8)
(5-8)
Molar volume is:
![]() (5-9)
(5-9)
At normal conditions, that is, atmospheric pressure 101.3 kPa and 0°C, molar volume is:
![]()
The volumetric flow rates of reactants consumption (in normal liters per minute, or Nl min−1) are:
![]() (5-10)
(5-10)
![]() (5-11)
(5-11)
Consumption of the reactants, hydrogen and oxygen, and water generation in the fuel cell are summarized in Table 5-2.
Table 5-2 Reactants’ Consumption and Water Generation (per Amp and per Cell)

The reactants may, and in some cases must, be supplied in excess of consumption. For example, this is always necessary on the cathode side where water is produced and must be carried out from the cell with excess flow. The ratio between the actual flow rate of a reactant at the cell inlet and the consumption rate of that reactant is called the stoichiometric ratio, S:
![]() (5-12)
(5-12)
Hydrogen may be supplied at the exact rate at which it is being consumed, in so-called dead-end mode (Figure 5-4a). If hydrogen is available at elevated pressure, such as in a high-pressure storage tank, the dead-end mode does not require any controls, that is, hydrogen is being supplied as it is being consumed. In a dead-end mode, S = 1. If hydrogen loss due to crossover permeation or internal currents is taken into account, then the hydrogen flow rate at the fuel cell inlet is slightly higher than the consumption rate corresponding to the electrical current being generated:
 (5-13)
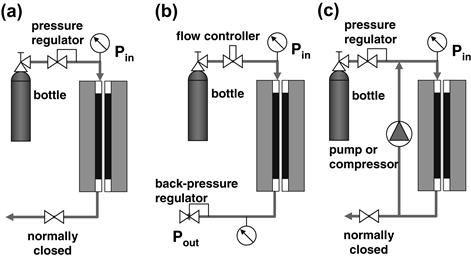
Figure 5-4 Modes of reactant supply: (a) dead-end mode, (b) flow-through mode, and (c) recirculation mode.
Fuel utilization, that is, a ratio between the fuel consumed in the electrochemical reaction and fuel supplied to the fuel cell, is the reverse of the previously defined stoichiometric ratio:
![]() (5-14)
(5-14)
Thus for a dead-end operation the fuel utilization is:
 (5-15)
Even in a dead-end mode, hydrogen has to be periodically purged because of accumulation of inert gases or water that may be present in the feed hydrogen or that can permeate the polymer membrane. The frequency and duration of purges depend on purity of hydrogen, rate of nitrogen permeation of the membrane, and water net transport through the membrane. In calculating the fuel cell efficiency, the loss of hydrogen due to purging must be taken into account through fuel utilization.
 (5-16)
where:
![]() rate of hydrogen consumption (mol s−1)
rate of hydrogen consumption (mol s−1)
![]() rate of hydrogen loss (mol s−1)
rate of hydrogen loss (mol s−1)
![]() rate of hydrogen purge (mol s−1)
rate of hydrogen purge (mol s−1)
Instead of purging, hydrogen may be supplied in excess (S > 1) in so-called flow-through mode (Figure 5-4b). In that case fuel utilization is given by Equation (5-14). Air is almost always supplied in a flow-through mode, with stoichiometry about S = 2 or higher. In the case of pure reactants (hydrogen and/or oxygen), a recirculation mode may be utilized (Figure 5-4c). In this case the unused gas is returned to the inlet by a pump or compressor, or sometimes a passive device such as an ejector (based on a Venturi tube) may be employed. Note that in case of recirculation, a cell may operate at a stoichiometric ratio much higher than 1, but because unused reactant (hydrogen or oxygen) is not wasted but returned for consumption back to the cell inlet, fuel or oxidant utilization on a system level is high (close to 1). However, periodic purging may still be necessary to get rid of the inert gases that may accumulate in anode and cathode compartments. In that case Equation (5-16) may be used to calculate the fuel or oxygen utilization.
In general, higher flow rates result in better fuel cell performance. This is particularly true when either hydrogen or oxygen is not pure. Although pure hydrogen may be supplied in a dead-end mode (S = 1) or with a stoichiometry slightly higher than 1 (1.05 to 1.2), hydrogen in a mixture of gases (such as that coming out of a fuel processor) must be supplied with higher stoichiometries (1.1 to 1.5). The exact flow rate is actually a design variable. If the flow rate is too high, the efficiency will be low (because hydrogen would be wasted), and if the flow rate is too low, the fuel cell performance may suffer.
Similarly, for pure oxygen flow rate, the required stoichiometry is between 1.2 and 1.5, but when air is used, the typical stoichiometry is 2 or higher. Although higher air flow rates result in better fuel cell performance, as shown in Figure 5-5, the air flow rate is also a design variable. Air is supplied to the cell by means of a blower or a compressor (depending on operating pressure) whose power consumption is directly proportional to the flow rate. Therefore, at higher air flow rates the fuel cell may perform better, but power consumption of a blower or particularly of a compressor may significantly affect system efficiency. This idea is discussed in Chapter 9 in greater detail.

Figure 5-5 Fuel cell performance at different air-flow rates.
There are at least two reasons that fuel cell performance improves with excess air flow rate:
Because oxygen is being consumed in the cell, its concentration at the cell outlet depends on the flow rate. If air is supplied at the exact stoichiometric ratio (S = 1), all the oxygen in the supplied air will be consumed in the fuel cell, that is, oxygen concentration in air exhaust will be zero. The higher the flow rate, the higher the oxygen concentration at the outlet and throughout the cell, as shown in Figure 5-6.
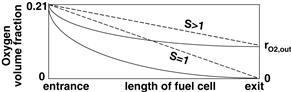
Figure 5-6 Oxygen volume or molar fraction through a fuel cell. Dashed lines represent an ideal case where the rate of oxygen consumption is constant; solid lines are more realistic because the oxygen consumption rate, (i.e., current generation), is a function of oxygen concentration and thus as oxygen content decreases so does the oxygen consumption rate.
If oxygen volume or molar fraction at the fuel cell inlet is rO2,in, then the oxygen volume or molar fraction at the outlet is:
 (5-17)
From Figure 5-7 it is clear that oxygen content at the outlet rapidly diminishes with stoichiometric ratios below 2. Because air at the outlet is almost always saturated with water vapor, oxygen content is even lower than it would be in dry air. For example, oxygen content at the fuel cell outlet at atmospheric pressure and 80°C operating with a stoichiometric ratio of 2 would be only 6%. An increase of stoichiometric ratio to 3 would result in oxygen content increasing to 8%. Above the stoichiometric ratio of 3 the curve levels off, and little gain in oxygen concentration and fuel cell performance is achieved.

Figure 5-7 Oxygen content (by volume) at the fuel cell outlet as a function of stoichiometric ratio.
5.4 Reactant Humidity
Because the membrane requires water to maintain protonic conductivity, as shown in Chapter 4, both reactant gases typically must be humidified before entering the cell. In some cases they have to be saturated, but in some cases excess humidity is needed on the anode side, and less than saturated conditions may be sufficient on the cathode side.
The humidity ratio is a ratio between the amount of water vapor present in a gas stream and the amount of dry gas. The humidity mass ratio (grams of water vapor/grams of dry gas) is:
![]() (5-18)
(5-18)
The humidity molar ratio (mols of water vapor/mols of dry gas) is:
 (5-19)
The relationship between mass and molar humidity ratios is:
 (5-20)
Molar ratio of gases is the same as a ratio of partial pressures:
![]() (5-21)
(5-21)
where P is the total pressure and pv and pg are the partial pressures of vapor and gas, respectively.
Relative humidity is a ratio between the water vapor partial pressure, pv, and saturation pressure, pvs, which is the maximum amount of water vapor that can be present in gas for given conditions:
![]() (5-22)
(5-22)
Saturation pressure is a function of temperature only. The values of saturation pressure may be found in thermodynamic tables. ASHRAE Fundamentals [4] provides an equation that allows us to calculate the saturation pressure (in Pa) for any given temperature between 0°C and 100°C:
![]() (5-23)
(5-23)
where a, b, c, d, e, and f are the coefficients:
The humidity ratios may be expressed in terms of relative humidity, saturation pressure, and total pressure by combining Equations (5-20), (5-21), and (5-22):
 (5-24)
![]() (5-25)
(5-25)
Figure 5-8 shows the water vapor content in gas at different temperatures and pressures. As it follows from Equation (5-25), at lower pressure a gas can contain more water vapor, and as it follows from Equations (5-23) and (5-25), water content in gas increases exponentially with temperature. At 80°C and ambient pressure, water content in air is close to 50%. Water vapor content by volume is:
![]() (5-26)
(5-26)
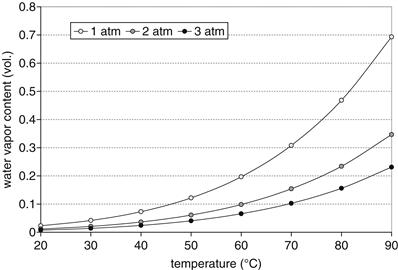
Figure 5-8 Water vapor content in a gas at different pressures and temperatures.
Enthalpy of dry gas is:
![]() (5-27)
(5-27)
where:
Note that this equation allows the use of degrees Celsius by assuming that a reference zero state is at 0°C (i.e., h0 = 0), so 1 degree of temperature difference on the Celsius scale is equal to 1 Kelvin.
Enthalpy of water vapor is [5]:
![]() (5-28)
(5-28)
where hfg = heat of evaporation = 2500 J g−1 at 0°C.
Enthalpy of humid gas is then [5]:
![]() (5-29)
(5-29)
and the unit is Joules per gram of dry gas.
Enthalpy of liquid water is:
![]() (5-30)
(5-30)
If the gas contains both water vapor and liquid water, such as may be the case at the fuel cell outlet, its enthalpy is [5]:
![]() (5-31)
(5-31)
where xv = water vapor content (in grams of vapor per gram of dry gas) and xw = liquid water content (in grams of liquid water per gram of dry gas). The total water content is:
![]() (5-32)
(5-32)
Note that when xw = 0, then x = xv; and when xw > 0, then xv = xvs. (When there is liquid water present in gas, gas is already saturated with vapor.)
The processes with humid gases are best seen in an h-x diagram, or a so-called Mollier diagram (Figure 5-9) [5], where the x-axis is tilted by:
 (5-33)

Figure 5-9 Mollier h-x diagram for moist air.
The saturation line divides the diagram into two distinct regions: the unsaturated region above the saturation line and the fog (mist) region below the saturation line (Figure 5-9). The state of humid gas is determined by its temperature and relative humidity, or temperature and water content, or temperature and dew point. The dew point temperature is the temperature at which all the water vapor present in gas would condense.
The reactant gases in PEM fuel cells are typically humidified. Most commonly, both reactant gases are required to be saturated at the cell operating temperature, although there are cell and MEA designs that require either subsaturated conditions or oversaturation. The process of humidification may be as simple as water or steam injection. In either case, to get from a dry gas or from ambient-temperature air to fully saturated gas at cell operating temperature, both water and heat are required. Injection of water in relatively dry gas would result in saturation at a temperature lower than that of starting air and water (as shown in Figure 5-10).

Figure 5-10 Illustration of humidification process in an h-x diagram.
The amount of heat required for humidification may be quite significant, especially if ambient pressure air is to be saturated at relatively high temperatures.
Example
A fuel cell with a 300-cm2 active area operates at 0.6 A/cm2 and 0.65 V. Air is supplied at a stoichiometric ratio of 2 and at a pressure of 1.15 bar, and it is humidified by injecting hot water (60°C) just before the stack inlet. Ambient air conditions are 1 bar, 20°C, and 60% RH. The requirement is to saturate the air at cell operating temperature of 60°C. Calculate the air flow rate, the amount of water required for 100% humidification of air at the inlet, and heat required for humidification.
Oxygen consumption is (Equation 5-3):

Oxygen flow rate at cell inlet is (Equation 5-12):
![]()
Air flow rate at cell inlet is:

where Mair = molecular weight of air = 0.21 × 32 + 0.79 × 28 = 28.85 g mol−1.
The amount of water in the air at the cell inlet (saturated at 1.15 bar and 60°C) is (Equation 5-18):
![]()
where xs is water content in air at saturation, that is, φ = 1 (Equation 5-24):

where pvs is the saturation pressure at 60°C (Equation 5-23) and P is total pressure, 1.15 bar = 115 kPa.
![]()
![]()
Ambient air already has some water in it (60% relative humidity at 20°C; pvs = 2,339 kPa):
![]()

Therefore, the amount of water needed for humidification of air at cell inlet is:
![]()
Heat required for humidification may be calculated from the heat balance:
![]()
Enthalpy of humid air is (Equation 5-29):
![]()
Humidified air: hvair,in = 1.01 × 60 + 0.131 = (1.87 × 60 + 2500) = 402.8 J g−1
Ambient air: hvair,amb = 1.01 × 20 + 0.00888 = (1.87 × 20 + 2500) = 42.73 J g−1

![]()
Just for comparison:
Cell electricity generation: Wel = I × V = 0.6Acm−2 × 300cm2 × 0.65 V =117 W
Water generation rate: 
The fuel cell from this example thus generates more than enough heat and just about enough water needed for humidification of incoming air. With a clever system design it would be possible to capture both heat and water generated by the cell and use it for humidification of incoming air.
Figure 5-11 shows the conditions at which a fuel cell generates enough water for humidification of both air and hydrogen (assuming that both gases are completely dry before humidification). Above the line for given stoichiometry ratios, the need for humidification of reactant gases is greater than the amount of water generated in the stack.

Figure 5-11 Temperatures and pressures at which a fuel cell generates enough water to humidify both hydrogen and air inlet streams.
A logical question arises: If a fuel cell generates enough water on the cathode side, why does air have to be humidified before entering the cell? In general, air humidification is needed to prevent drying the portion of the membrane near the air inlet. Figure 5-12a shows that although there is enough water generated in the cell, the air in most of the cell is undersaturated. However, the conditions in Figure 5-12a are not very realistic:

Figure 5-12 Water profiles in a fuel cell: (a) assuming uniform current density distribution and isothermal conditions; (b) assuming realistic current density distribution and air temperature increase from inlet to outlet.
When more realistic conditions are applied, the water profiles in the cell change dramatically, as shown in Figure 5-12b. Conditions are selected so that the product water is sufficient to saturate air at the fuel cell exit. Air enters the cell at ambient conditions, relatively dry. At low temperatures (20°C to 30°C), small amounts of water are needed to saturate the air, and the product water is more than sufficient. As the air is heated up and its pressure decreases, it needs more and more water. With careful design of air passages and heat transfer inside the fuel cell, it is possible to match the two water profiles even more closely.
Figure 5-13 shows the inlet air water content, shown as the dew point temperature, required to saturate air at the fuel cell outlet for typical air flows. Conditions above the line would result in liquid water at the outlet, whereas conditions below the line would result in undersaturated air at the outlet.
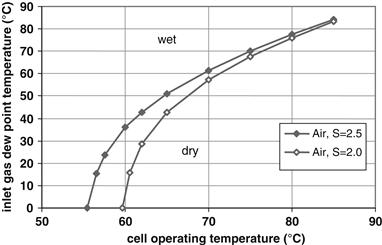
Figure 5-13 Water content in air at inlet (specified as dew point) required to result in saturated conditions at the fuel cell outlet.
Berning [6] suggested that the dew point temperature of the exhaust gases may be used as a criterion for selecting operating conditions. The dew point temperature at the anode outlet depends on the molar gas flow rates. The molar stream of hydrogen leaving the cell is:
![]() (5-34)
(5-34)
The molar flow rate of water leaving the cell is calculated using the definition of the net drag coefficient rd, defined as [7]:
 (5-35)
Net drag coefficient is a difference between the water flux due to electroosmotic drag and water back diffusion. It is defined the same as the electroosmotic drag, that is, the number of water molecules per proton. It is positive when the net flux is from the anode to the cathode.
For dry hydrogen inlet (![]() ) this leads to:
) this leads to:
![]() (5-36)
(5-36)
Molar ratio of water vapor and dry hydrogen gas at the anode outlet is thus:
 (5-37)
Note that there will be water in the hydrogen gas at the outlet only when the net drag is negative, that is, when the net flux is from the cathode to the anode. The water vapor partial pressure at the anode outlet can then be calculated by combining Equation (5-37) and Equation (5-21):
 (5-38)
From Equation (5-38) it follows that for a given pressure at the anode outlet, the dew point temperature depends only on the stoichiometric flow ratio and the net drag coefficient. When fuel cells operate at an elevated pressure, the pressure is typically fixed at the outlet so that the preceding equation yields the value of the water vapor pressure at the fuel cell outlet.
The molar flow rate of depleted air at the cathode exhaust (neglecting the crossover of nitrogen to the anode) is given by:
 (5-39)
where SO2 is the cathode side stoichiometric flow ratio. This equation assumes that dry air consists of 79% nitrogen and 21% oxygen on a molar basis.
The molar water vapor stream leaving the cathode side, assuming the air was dry at the inlet, is:
![]() (5-40)
(5-40)
Note that only if rd < 0 some of the product water will end up on the anode side.
The molar ratio of water vapor and dry gas at the cathode outlet is:
 (5-41)
The partial pressure of water vapor in the gas at the cathode outlet finally can be obtained by combining Equations (5-41) and (5-21):
 (5-42)
Equations (5-38) and (5-42) can be used to calculate the water vapor pressure at the anode and cathode side outlets, respectively, and the dew point temperatures can then be calculated using the following equation, which is a reverse of Equation (5-23):
 (5-43)
where pH2O is the water vapor partial pressure in Pa calculated from Equations (5-38) and (5-42), respectively. Equation (5-43) is an excellent curve-fit between 40°C and 90°C [6].
The dew point temperature depends on the net drag coefficient rd. However, when the cell is operated on dry reactant gases, the net drag coefficient is typically within a very narrow range of −0.1 < rd < 0 [8]. The dew point temperature depends strongly on the operating pressure, and an increase in cell pressure will lead to an increase in the dew point temperature and consequently increase the danger of condensation and cell flooding.
The preceding equations allow for the construction of charts that show the anode and cathode dew point temperatures Tdew as functions of the net drag coefficient rd and the stoichiometric flow ratio. Due to the dependence of the dew point temperatures on the pressure, different charts have been created for each operating pressure. Figure 5-14 shows exemplarily the calculated dew point temperatures at the anode (left) and cathode (right) for an ambient operating pressure (top), 1.5 bar (middle), and 2.0 bar (bottom).
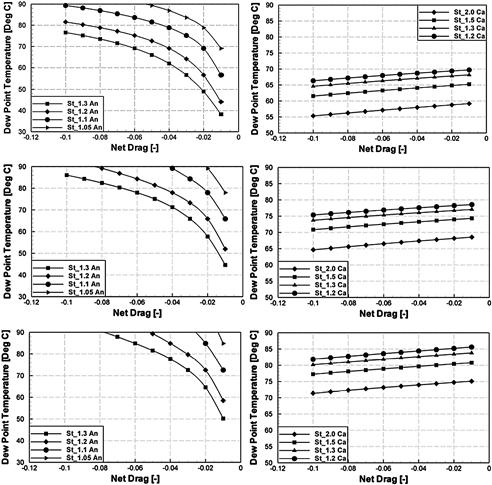
FIGURE 5-14 Dew point temperatures at the anode (left) and the cathode (right) exhaust at ambient operating pressure (top) 1.5 bar (middle) and 2.0 (bottom) for a fuel cell operated with dry gases at the inlet [6].
Combining the preceding analysis of the exhaust gases’ dew point with modeling of the processes inside a fuel cell, Berning [6] has suggested that the ideal operating temperature of a fuel cell should be a few degrees above the cathode condensation temperature, which typically ranges between 60°C and 80°C, depending on the pressure and stoichiometric flow ratio. Operating the fuel cell around 10°C above the dew point temperature leads to a dry membrane. When the anode side operates at a stoichiometric flow ratio as low as ξ = 1.05, the predicted net drag falls within a very narrow regime and is quite independent of the current density, which greatly helps determine ideal operating conditions. Because the anode-side dew point temperature is very sensitive to rd and increases quickly to values above 80°C, it is advisable to have the anode outlet be the hot end of the fuel cell when operating in counter-flow mode. This can be facilitated by running the coolant counter-flow to the cathode.
Therefore, under certain conditions, operation with dry gases is possible. The criterion for operation with dry gases is that the amount of product water should be sufficient to saturate the outlet gases [9], that is:
 (5-44)
Figure 5-15 [9] gives the critical gas stoichiometry for typical cell temperatures of 60°C and 80°C and pressure 1.5 and 3 bar. However, satisfaction of the preceding equation does not guarantee that the local dehydration will not occur.

FIGURE 5-15 Maximum air stoichiometry that for a given hydrogen stoichiometry still fulfils Equation (5-44); each point corresponds to a combination of stoichiometries for which the amount of product water is just sufficient to saturate the outlet gas [7].
Indeed, Tolj et al. [10] have shown what happens inside a fuel cell fed with ambient unhumidified air if the cell hardware is kept at a constant temperature (Figure 5-16). Although the product water is sufficient to humidify the air at the exhaust, the air stream, quickly after entering the cell, heats up, which causes relative humidity to drop below 25%. By the end of the channel the air stream gets fully saturated, but throughout the cathode channel the air is practically dry. This can be avoided if a temperature profile along the cathode channel is established that would prevent air from heating up quickly and that would ensure relative humidity close to 100% throughout the channel. This can be accomplished by flowing the coolant counter-flow to the cathode and/or with carefully designed heat removal from the cell. If neither of these measures is sufficient to avoid drying conditions in the fuel cell, humidification of air before it inlets the fuel cell may be necessary.

FIGURE 5-16 Temperature and relative humidity along the cathode channel of a fuel cell operated at 60°C with ambient air at the inlet [10].
When both gases (hydrogen and air) are saturated at cell temperature, it is still possible to end up with dehydration on either anode or cathode, depending on the magnitude and direction of the net water drag. A limited positive drag does not necessarily result in dehydration of the anode gas, whereas a substantial negative drag is possible before the cathode gas shows dehydration. The maximum drag before the anode dehydration occurs is given by the following Equation [7]:
 (5-45)
Similarly, the minimum drag before the cathode dehydration occurs is [7]:
 (5-46)
5.5 Fuel Cell Mass Balance
Fuel cell mass balance requires that the sum of all mass inputs must be equal to the sum of all mass outputs. The inputs are the flows of fuel and oxidant plus water vapor present in those gases. The outputs are the flows of unused fuel and oxidant plus water vapor present in those gases, plus any liquid water present in either fuel or oxidant exhaust:
![]() (5-47)
(5-47)
where i are the species, namely H2, O2, N2, H2O(g), and H2O(l). In cases when hydrogen is fed from a fuel processor, other species, such as CO2 and small amounts of CO, CH4, and others, may also be present and must be accounted for in the energy balance.
5.5.1 Inlet Flow Rates
As shown earlier (Equations 5-2 and 5-3), consumption of reactants in a fuel cell is proportional to current and number of cells. Furthermore, the stoichiometric ratio is defined as a ratio between the actual flow of reactant at the fuel cell inlet and its theoretical consumption. Therefore, all the flow rates of reactants and their constituents at the inlet are also proportional to current and number of cells. Because the cell power output is:
![]() (5-48)
(5-48)
all the flows are also proportional to power output and inversely proportional to cell voltage:
![]() (5-49)
(5-49)
Hydrogen mass flow rate (g s−1) is:
![]() (5-50)
(5-50)
If hydrogen is in a gas mixture, with rH2 volumetric and molar fraction, then the mixture flow rate is:
![]() (5-51)
(5-51)
Oxygen mass flow rate (g s−1) is:
![]() (5-52)
(5-52)
Air mass flow rate (g s−1) is then:
 (5-53)
Nitrogen (which makes 79% of air by volume at the fuel cell inlet) mass flow rate (g s−1) is:
![]() (5-54)
(5-54)
Water vapor (g s−1) present in hydrogen inlet with relative humidity (φan) is:
 (5-55)
If hydrogen is supplied not as a pure gas but in a gas mixture, with rH2 volumetric or molar fraction, water vapor in fuel inlet (g s−1) is:
 (5-56)
Water vapor (g s−1) present in an oxygen inlet with relative humidity (φca) is:
 (5-57)
If air is used as an oxidant, water vapor in the air inlet (g s−1) is:
 (5-58)
5.5.2 Outlet Flow Rates
The equations for the outlet mass flow rates must account for reactants’ consumption, water generation, and water net transport across the membrane.
The unused hydrogen flow rate is:
![]() (5-59)
(5-59)
The water content in hydrogen exhaust is equal to water brought into the cell with the hydrogen inlet minus the net water transport across the membrane. As discussed in Chapter 3, water gets “pumped” from anode to cathode because of electroosmotic drag. At the same time, some water diffuses back because of the water concentration gradient and because of the pressure differential. The net water transport is then the difference between these two fluxes. Water balance in the cathode side is then:
![]() (5-60)
(5-60)
Electroosmotic drag is proportional to current, just like any other flow in or out of the fuel cell (Equation 4-5). The proportionality constant, ζD, the so-called electroosmotic drag coefficient, represents a number of water molecules per proton. When ζD = 1, each proton is accompanied by one water molecule to form H2O+:
![]() (5-61)
(5-61)
Back diffusion of water depends on water concentration on both sides of the membrane, water diffusivity through the membrane, and membrane thickness. Because water concentration is not uniform, it is not easy to explicitly calculate back diffusion for the entire cell or a stack of cells. For the sake of mass balance, back diffusion may be expressed as a fraction, β, of electroosmotic drag. When β = 1, back diffusion is equal to electroosmotic drag, that is, there is no net water transport across the membrane. The coefficient β may be determined experimentally by carefully condensing and measuring water content in both anode and cathode exhaust streams:
![]() (5-62)
(5-62)
The relationship between the previously defined net water transfer coefficient, rD (Equation 5-35), the electro-osmotic drag coefficient, ζD (defined by Equation 5-61), and coefficient β (defined by Equation 5-62) is:
![]() (5-63)
(5-63)
Depending on the hydrogen flow rate, that is, stoichiometry, and conditions at the outlet (temperature and pressure), water at the hydrogen exhaust may be present as vapor only, or liquid water may be present after the gas is saturated with water vapor. The water vapor content/flux at the anode outlet is the smaller of the total water flux at the anode outlet (calculated by Equation 5-60) and the maximum amount of vapor the exhaust gas can carry (saturation):
 (5-64)
where ΔPan is the pressure drop on the anode side, that is, the difference in pressure between the inlet and the outlet. In other words, if there is liquid water in the exhaust, the gas is already saturated.
The amount of liquid water, if any, is the difference between the total water present at the exhaust and water vapor:
![]() (5-65)
(5-65)
A similar set of equations may be applied for the cathode exhaust. Oxygen flow rate at the outlet, that is, unused oxygen, is equal to oxygen supplied at the inlet minus oxygen consumed in the fuel electrochemical reaction:
![]() (5-66)
(5-66)
Nitrogen flow rate at the exit is the same as the flow rate at the inlet because nitrogen does not participate in the fuel cell reaction:
![]() (5-67)
(5-67)
The depleted air flow rate is then simply a sum of oxygen and nitrogen flow rates:
 (5-68)
Note that the oxygen volume fraction at the outlet is inevitably lower than the inlet volume fraction (Equation 5-16):
 (5-69)
Both rO2,in and rO2,out refer to volume or molar fractions of oxygen in dry air. The actual volume fraction in humid air is lower (see Figure 5-7):
 (5-70)
Water content in the cathode exhaust is equal to the amount of water brought in the cell by humid air at the inlet plus water generated in the cell, plus the net water transport across the membrane, that is, the difference between electroosmotic drag and water back diffusion:
![]() (5-71)
(5-71)
Depending on the oxygen/air flow rate, that is, the stoichiometry, and conditions at the outlet (temperature and pressure), water at the cathode exhaust may be present as vapor only, or liquid water may be present after the gas is saturated with water vapor. The water vapor content/flux at the cathode outlet is the smaller of the total water flux at the cathode outlet and the maximum amount the exhaust gas can carry (saturation):
 (5-72)
where ΔPca is the pressure drop on the cathode side, that is, the difference in pressure between the inlet and outlet, so Pca,− ΔPca is the pressure at the outlet.
The amount of liquid water, if any, is the difference between the total water present at the exhaust and water vapor:
![]() (5-73)
(5-73)
The previous set of Equations (5-47 through 5-73) represents the fuel cell mass balance. For a given set of inlet conditions (temperatures, pressures, flow rates, relative humidities) and some known or estimated stack performance characteristics (such as current, pressure drop, temperature difference, electroosmotic drag, and back diffusion), it allows one to calculate the flow rates and particularly water conditions at the outlet, or it may be used to tailor the inlet conditions so that desired conditions at the outlet are obtained, as demonstrated in an example at the end of this chapter.
5.6 Fuel Cell Energy Balance
Fuel cell energy balance requires that the sum of all energy inputs must be equal to the sum of all energy outputs:
![]() (5-74)
(5-74)
The inputs are the enthalpies of all the flows into the fuel cell, namely fuel and oxidant, plus enthalpy of water vapor present in those gases. The outputs are:
• Enthalpies of all the flows out of the fuel cell, namely unused fuel and oxidant, plus enthalpy of water vapor present in those gases, plus enthalpy of any liquid water present in either fuel or oxidant exhaust
• Heat flux out of the fuel cell, both controlled through a cooling medium and uncontrolled because of heat dissipation (radiation and convection) from the fuel cell surface to the surroundings
For each flow in and out of the fuel cell there is an associated enthalpy, which can be calculated from Equations (5-75) through (5-79).
For each dry gas or a mixture of dry gases, the enthalpy (in J s−1) is:
![]() (5-75)
(5-75)
where:
Note that the use of degrees Celsius implies that 0°C has been selected as a reference state for all enthalpies.
If a gas is combustible, that is, it has a heating value, its enthalpy is then:
![]() (5-76)
(5-76)
where h0HHV is the higher heating value of that gas ( J g−1) at 0°C. Typically, heating values are reported and tabulated at 25°C. The difference between the heating value at 25°C and 0°C is the difference between the enthalpies of reactants and products at those two temperatures. For hydrogen it is:
 (5-77)
Enthalpy of water vapor is (from Equation 5-28):
![]() (5-78)
(5-78)
Enthalpy of liquid water is:
![]() (5-79)
(5-79)
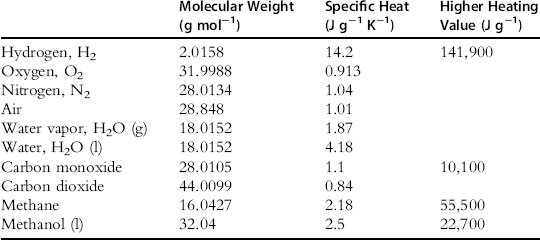
Some properties of the species commonly found in fuel cell inlets and outlets are listed in Table 5-3.
Table 5-3 Properties of Some Gases and Liquids
The use of mass and energy balance equations is demonstrated in the following example.
Example
A hydrogen/air fuel cell may be cooled through evaporative cooling by injecting liquid water at the air inlet and having the air flow rate sufficiently high. For a fuel cell that generates 1 kW at 0.7 V, find the required oxygen stoichiometric ratio and injected liquid water flow rate (g/s) so that the outlet air is fully saturated at 65°C (and there is no liquid water at the outlet) and that no additional cooling or heating of the fuel cell is required. Air is supplied at room temperature (20°C) with 70% relative humidity. Hydrogen is supplied in a dead-end mode at room temperature (20°C) and dry. Assume that the net water transport through the membrane is sufficient to maintain saturated conditions in the anode chamber at 65°C. Inlet pressure is 120 kPa (for both air and hydrogen); air outlet pressure is atmospheric, that is, 101.3 kPa.
To solve this problem with two unknowns, namely water injection rate, ![]() , and oxygen stoichiometric ratio, SO2, two independent equations are needed. They may be obtained from water and energy balance.
, and oxygen stoichiometric ratio, SO2, two independent equations are needed. They may be obtained from water and energy balance.
Water balance is:
![]()
Water in air in is (Equation 5-58):
MH2O = 18.015 (from Table 5-3)
![]() (Equation 5-23); T = 293.15; pvs = 2.339 kPa
(Equation 5-23); T = 293.15; pvs = 2.339 kPa
Water generated is (Equation 5-7):
![]()
Water vapor in air out is (Equation 5-72):

![]()
Water balance is therefore:
![]()
or, after rearranging:
![]() (Equation E1)
(Equation E1)
Energy balance is:

The flow rates are:
Hydrogen in (Equation 5-50): ![]()
![]()
Air in (Equation 5-53):
![]()
Water vapor in air in (from water balance above): ![]() 0.0044SO2 g s−1
0.0044SO2 g s−1
Air out (Equation 5-68): 
Water vapor in air out (from water balance above):
![]()
Energy flows (enthalpies) are:
Hydrogen in (Equation 5-76): ![]()
Hydrogen higher heating value at 0°C is (Equation 5-77):
Air in (Equation 5-75): ![]()
![]()
Water vapor in air in (Equation 5-78):

Water injected (Equation 5-79):
![]()
Air out: ![]()

Water vapor in air out (Equation 5-78):

Electricity generated: Wel = 1000 W
Energy balance is:
![]()
After rearranging the energy balance equation becomes:
![]() (Equation E2)
(Equation E2)
By combining with the water balance and solving the two equations, E1 and E2, with two unknowns, the result is:
![]()
![]()
Therefore, by injecting 0.27 g s−1 of liquid water in ambient air at fuel cell inlet with the stoichiometry of 4.25, it would be possible to maintain the desired operating temperature of 65°C and have just enough water at the air outlet to avoid either flooding with liquid water or drying with dry air. Note that such a fuel cell would have to be thermally insulated. Also, operation with dry hydrogen probably would not be possible, that is, additional water may be needed to humidify hydrogen. Nevertheless, such a fuel cell would result in an extremely simple system: no need for air humidification and no need for stack cooling, probably the two bulkiest supporting system components.
Problems
1. A fuel cell generates 200 amps at 0.6 V. Hydrogen flow rate in the fuel cell is 1.8 Nl m−1; air flow rate is 8.9 Nl m−1. Calculate:
a. Hydrogen stoichiometric ratio
b. Oxygen stoichiometric ratio
c. Oxygen concentration at the outlet (neglect water present)
2. If both gases in Problem 1 are 100% saturated at 60°C and 120 kPa, calculate:
a. The amount of water vapor present in hydrogen (in g/s)
b. The amount of water vapor present in air (in g/s)
c. The amount of water generated in the fuel cell reaction (in g/s)
3. In Problem 2, calculate the amount of liquid water at the cell outlet (assuming zero net water transport through the membrane). Both air and hydrogen at the outlet are at ambient pressure and at 60°C.
5. An H2/Air fuel cell operates at 80°C and 170 kPa. Hydrogen is supplied in a dead-end mode. If the net water drag is 0.25 molecules of H2O per proton, calculate the required relative humidity of hydrogen at the inlet so that there is neither water accumulation nor drying of the membrane on the hydrogen side of the fuel cell. Explain the physical meaning of your result.
6. An H2/Air fuel cell operates with hydrogen utilization of 84% and oxygen stoichiometric ratio of 2. Both hydrogen and air must be fully saturated at the cell operating pressure and temperature. Which of the following is true?
a. Air needs approximately 4 times more water
b. Air needs approximately 2 times more water
c. Hydrogen needs approximately 2 times more water
d. Cannot say which reactant needs more water because temperature and pressure are not given
7. Air is fully saturated with water vapor at the fuel cell inlet and at the fuel cell outlet (actually there is also liquid water dripping at the outlet). The air temperature is the same at the inlet and at the outlet. The fuel cell operates with an oxygen stoichiometric ratio of 2. Air passes through a single-channel serpentine flow field. Is the water vapor content (in mols of water vapor per mol of dry gas) at the outlet:
Quiz
1. The stoichiometric ratio is:
a. The ratio between hydrogen and oxygen at the fuel cell inlet
b. The ratio between hydrogen and oxygen consumed in the fuel cell
c. The ratio between an actual flow rate of a reactant at the fuel cell inlet and the rate of consumption of that same reactant
2. In the case of an air-breathing fuel cell, a higher oxygen stoichiometric ratio:
a. Means a higher concentration of O2 at the outlet
b. Means a higher concentration of O2 at the inlet
c. Has nothing to do with concentration
a. No hydrogen is leaving the fuel cell
b. The fuel cell is “dead,” that is, produces no current
c. Consumption is proportional to cell voltage
4. In a dead-end operation, the stoichiometric ratio at the inlet is:
5. Pressure at a fuel cell air inlet:
b. Is higher than at the outlet
c. You cannot say if it is higher or lower because it depends on the current
6. A certain quantity of a gas at higher temperature can contain:
a. Less water vapor than at a lower temperature
b. More water vapor than at a lower temperature
c. The same amount of water vapor as at a lower temperature
a. The percentage of partial pressure of water vapor relative to saturation pressure
b. The ratio between the amount of water vapor and the amount of dry air
c. The percentage of water in air
8. If the air flow rate at the inlet is kept proportional to the current (for example, at 2 × stoichiometry), then:
a. Concentration of O2 is constant throughout the cell, regardless of current
b. O2 concentration decreases along the length of the fuel cell
c. O2 concentration reaches zero at certain current
9. If back diffusion of water is equal to the electroosmotic drag and both gases are saturated at the inlet:
a. There is no net water transport across the membrane
b. The fuel cell will flood on the air (cathode) side
c. The fuel cell will dry out on the air (cathode) side
10. The form of water at the cathode (air) exit of the fuel cell depends on:
a. Operating pressure and temperature only
b. Stoichiometric ratio and temperature only
c. Stoichiometric ratio, temperature, pressure, and humidity of air at the inlet
References
1. Barbir F, Fuchs M, Husar A, Neutzler J. Design and Operational Characteristics of Automotive PEM Fuel Cell Stacks. Fuel Cell Power for Transportation. 2000;SAE SP-1505:63–69 SAE, Warrendale, PA.
2. Yan Q, Toghiani H, Causey H. Steady State and Dynamic Performance of Proton Exchange Membrane Fuel Cells (PEMFCs) Under Various Operating Conditions and Load Changes. Journal of Power Sources. 2006;Volume 161:492–502 Issue 1.
3. National Institute of Standards and Technology; http://physics.nist.gov/cuu/Units/outside.html.
4. ASHRAE Handbook. Fundamentals. Atlanta, GA: ASHRAE; 1981; 1982.
5. Bosnjakovic F. Technical Thermodynamics. New York: Holt Rinehart and Winston; 1965.
6. Berning T. The Dew Point Temperature as a Criterion for Optimizing Operating Conditions for Proton Exchange Membrane Fuel Cells, Int. Journal of Hydrogen Energy 2012.
7. Janssen GJM, Overvelde MLJ. Water Transport in the Proton-Exchange-Membrane Fuel Cell: Measurements of the Effective Drag Coefficient. J Power Sources. 2001;101:117–125.
8. Berning T, Kær SK. Low Stoichiometry Operation of a Proton-Exchange Membrane Fuel Cell Employing the Interdigitated Fuel Cell: a Modeling Study. J Power Sources. 2012.
9. Buchi FN, Srinivasan S. Operating Proton Exchange Membrane Fuel Cells Without External Humidification of the Reactant Gases. J Electrochemical Society. 1997;144:2767–2772.
10. Tolj I, Bezmalinovic D, Barbir F. Maintaining Desired Level of Relative Humidity Throughout a Fuel Cell with Spatially Variable Heat Removal Rates. International Journal of Hydrogen Energy. 2011;36:13105–13113.