
9.4. Code and Code Explanation
Now you should have an understanding of what information will be collected and how to retrieve it in a meaningful way so it's time to turn your attention to writing the project's code. You have the ability to create charts and graphs by using PHP's GD functions. Here you'll build two common types: a bar chart and a pie chart. Both will be coded as classes so they can easily be extended and reused in future projects. First I will take a look at the pie chart and then the bar chart. They can be incorporated into the report to augment the presentation of information in a visual way. Then I will present the code for the report itself.
9.4.1. Pie Chart
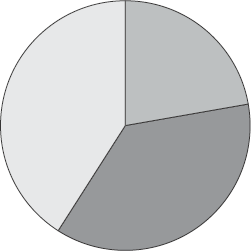
A pie chart is a circular graph that is divided into section. Each section represents how much a data member consumes of the aggregate total. In other words, a pie chart might be a good choice when you want to visually present percentage data. The PieChart class will offer three public methods, as shown in Table 9-1.
The class has three private properties: One to store the image handle of the graph, one to store the width of the graph, and then the center of the chart. The constructor initializes a new instance of PieChart by creating a new true color image using imagecreatetruecolor() and flood fills the image canvas using imagefill(). The image's width is divided in half and stored for later use so you'll be able to easily determine the image's center point.
class PieChart
{
    private $center;
    private $width;
    private $image;

    public function __construct($width)
    {
        $this->image = imagecreatetruecolor($width, $width);

        $this->width = $width;
        $this->center = $width / 2;

        $white = imagecolorallocate($this->image, 0xFF, 0xFF, 0xFF);
        imagefill($this->image, 0,0, $white);
    }
...
}
The flushImage() method encapsulates the logic of outputting an image to the browser. It sends the appropriate HTTP header and then flushes the image from memory. This behavior can change, however, if a file name is passed as an argument, in which case it will save the image as the provided name.
public function flushImage($filename = '')
{
    if ($filename)
    {
        imagepng($this->image, $filename);
    }
    else
    {
        header('Content-type: image/png'),
        imagepng($this->image);
    }
}
graphData() accepts two related arrays and is where the majority of the drawing routines takes place. The first array is the sequence of data to graph and the second is which colors the segments will be. Each color is represented as an array with r, g, and b representing the individual RGB values.
Each arc is drawn twice — once for the filled segment and a second time for a black outline. Set the starting angle of the first slice at −90 degrees so it starts at the circle's top (the 12 o'clock position if it were a clock), although this is nothing more than personal preference. The default 0 value for imagefilledarc() would start slice at the circle's right (3 o'clock).
public function graphData($data, $colors)
{
    $black = imagecolorallocate($this->image, 0x00, 0x00, 0x00);

    $sum = array_sum($data);

    $start = −90;

    for ($i = 0; $i < count($data); $i++)
    {
        $color = imagecolorallocate($this->image, $colors[$i]['r'],
            $colors[$i]['g'], $colors[$i]['b']);

        $stop = (100 * $data[$i] / $sum * 3.6) + $start;

        imagefilledarc($this->image, $this->center, $this->center,
            $this->width, $this->width, $start, $stop, $color,
            IMG_ARC_PIE);
        imagefilledarc($this->image, $this->center, $this->center,
            $this->width, $this->width, $start, $stop, $black,
            IMG_ARC_NOFILL | IMG_ARC_EDGED);

        $start = $stop;
    }
}
To generate a new pie chart you must first instantiate a new object of the PieChart class, feed graphData() some values and colors, and call flushImage(). Figure 9-2 shows the sample's output.
<?php
include '../lib/PieChart.php';

$data = array(150, 302, 250);
$colors = array(
    array('r' => 0x33, 'g' => 0xCC, 'b' => 0xFF),
    array('r' => 0xFF, 'g' => 0x33, 'b' => 0xCC),
    array('r' => 0xCC, 'g' => 0xFF, 'b' => 0x33));

$chart = new PieChart(150);
$chart->graphData($data, $colors);
$chart->flushImage();
?>
Figure 9-2. Figure 9-2
Here is the complete code for lib/PieChart.php.
<?php
class PieChart
{
    private $center;  // center point
    private $width;   // width of chart
    private $image;   // image reference

    // initialize new object
    public function __construct($width)
    {
        // create a new image
        $this->image = imagecreatetruecolor($width, $width);

        // determine center of image
        $this->center = $width / 2;
        $this->width = $width;

        // fill image background white
        $white = imagecolorallocate($this->image, 0xFF, 0xFF, 0xFF);
        imagefill($this->image, 0,0, $white);
    }

    // dump image to browser or save
    public function flushImage($filename = '')
    {
        if ($filename)
        {
            imagepng($this->image, $filename);
        }
        else
        {
            header('Content-type: image/png'),
imagepng($this->image);
}
}
// graph the data using the associated colors
public function graphData($data, $colors)
{
// allocate black for slice outline
$black = imagecolorallocate($this->image, 0x00, 0x00, 0x00);
// sum of all values
$sum = array_sum($data);
// starting angle of pie slice
$start = −90;
for ($i = 0; $i < count($data); $i++)
{
$color = imagecolorallocate($this->image, $colors[$i]['r'],
$colors[$i]['g'], $colors[$i]['b']);
// stop angle of pie slice
$stop = (100 * $data[$i] / $sum * 3.6) + $start;
// draw arc twice - once for filled area and again for outline
imagefilledarc($this->image, $this->center, $this->center,
$this->width, $this->width, $start, $stop, $color,
IMG_ARC_PIE);
imagefilledarc($this->image, $this->center, $this->center,
$this->width, $this->width, $start, $stop, $black,
IMG_ARC_NOFILL | IMG_ARC_EDGED);
// increment to next starting point
$start = $stop;
}
}
}
?>9.4.2. Bar Chart
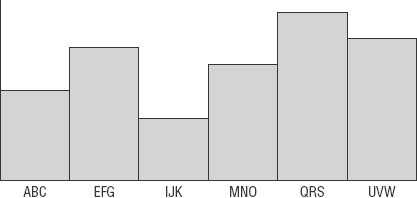
A bar chart places multiple values for a visual side-by-side comparison. Because pieces of data appear alongside one other against an x-y axis, bar charts are useful for showing trends over a given period of time. The BarChart class will also offer three public methods, as shown in Table 9-2.
The BarChart class's methods and their purposes are similar to the ones in the PieChart class. The constructor is responsible for initializing a new object and preparing the image in memory. flushImage() outputs the graph image and the drawing logic is contained in graphData().
The class has three private properties: One property stores the image handle of the graph and two other properties store the width and height of the graph. Because the color black used in several places in the code, it makes sense to only allocate it once in the image and store a handle to it as a property as well.
The constructor initializes a new instance of BarChart by creating a new true color image using imagecreatetruecolor() and flood fills the image canvas using imagefill(). The image's width and height are stored to the corresponding property. The black color is allocated and used to draw the chart's axis lines.
class BarChart
{
    private $width;
    private $height;
    private $image;
    private $black;

    public function __construct($width, $height)
    {
        $this->image = imagecreatetruecolor($width, $height);
        $this->width = $width;
        $this->height = $height;

        $white = imagecolorallocate($this->image, 0xFF, 0xFF, 0xFF);
        imagefill($this->image, 0,0, $white);

        $this->black = imagecolorallocate($this->image, 0x00, 0 x00, 0 x00);
        imageline($this->image, 20, 0, 20, $height - 20, $this->black);
        imageline($this->image, 20, $height - 20, $width - 20, $height - 20,
            $this->black);
    }
...
}
The flushImage() method encapsulates the logic of outputting an image to the browser. It sends the appropriate HTTP header and then flushes the image from memory. This behavior can change, however, if a file name is passed as an argument, in which case it will save the image as the provided name.
public function flushImage($filename = '')
{
    if ($filename)
    {
        imagepng($this->image, $filename);
    }
    else
    {
        header('Content-type: image/png'),
        imagepng($this->image);
    }
}
Unlike its PieChart counterpart, BarChart's graphData() method accepts an additional argument. Besides the arrays of data and corresponding colors, the elements' labels for the graph's x-axis are provided as a third array. The method places these labels underneath the dataset. Again, the data segments are drawn twice — once for the color and again to provide a black outline.
public function graphData($data, $colors, $labels)
{
    $x = 20;
    $y = $this->height - 20;

    $bar_width = ($this->width - $x - 20) / count($data);

    $ymax = max($data);
    for ($i = 0; $i < count($data); $i++)
    {
        $bar_height = ($data[$i] / $ymax) * ($this->height - 30);
        $color = imagecolorallocate($this->image, $colors[$i]['r'],
            $colors[$i]['g'], $colors[$i]['b']);

        imagefilledrectangle($this->image, $x, $y, $x + $bar_width,
            $y - $bar_height, $color);
        imagerectangle($this->image, $x, $y, $x + $bar_width,
            $y - $bar_height, $this->black);
        imagestring($this->image, 2, $x, $y, $labels[$i], $this->black);

        $x += $bar_width;
    }
}
Here's the example usage of the BarChart class. Figure 9-3 shows the sample's output.
<?php
include '../lib/BarChart.php';

$data = array(100, 150, 70, 130, 190, 160);
$colors = array_fill(0, count($data),
array('r' => 0x33, 'g' => 0xCC, 'b' => 0xFF));
$labels = array('ABC', 'EFG', 'IJK', 'MNO', 'QRS', 'UVW'),

$chart = new BarChart(400, 175);
$chart->graphData($data, $colors, $labels, 10);
$chart->flushImage();
?>
Figure 9-3. Figure 9-3
Here is the complete listing for lib/BarChart.php:
<?php
class BarChart
{
    private $width;   // width of chart
    private $height;  // height of chart
    private $image;   // image reference
    private $black;   // allocated color black

    // initialize new object
    public function __construct($width, $height)
    {
        // create new image
        $this->image = imagecreatetruecolor($width, $height);
        $this->width = $width;
        $this->height = $height;

        // fill image background white
        $white = imagecolorallocate($this->image, 0xFF, 0xFF, 0xFF);
        imagefill($this->image, 0,0, $white);

        // draw axis
        $this->black = imagecolorallocate($this->image, 0x00, 0x00, 0x00);
        imageline($this->image, 20, 0, 20, $height - 20, $this->black);
        imageline($this->image, 20, $height - 20, $width - 20, $height - 20,
            $this->black);
    }

    // dump image to browser or save
public function flushImage($filename = '')
{
if ($filename)
{
imagepng($this->image, $filename);
}
else
{
header('Content-type: image/png'),
imagepng($this->image);
}
}
// graph the data using the associated colors and labels
public function graphData($data, $colors, $labels)
{
// start point
$x = 20;
$y = $this->height - 20;
// calculate bar width
$bar_width = ($this->width - $x - 20) / count($data);
$ymax = max($data);
for ($i = 0; $i < count($data); $i++)
{
// calculate height of bar
$bar_height = ($data[$i] / $ymax) * ($this->height - 30);
$color = imagecolorallocate($this->image, $colors[$i]['r'],
$colors[$i]['g'], $colors[$i]['b']);
// draw bar twice - once for filled area and again for outline
imagefilledrectangle($this->image, $x, $y, $x + $bar_width,
$y - $bar_height, $color);
imagerectangle($this->image, $x, $y, $x + $bar_width,
$y - $bar_height, $this->black);
imagestring($this->image, 2, $x, $y, $labels[$i], $this->black);
// increment starting point
$x += $bar_width;
}
}
}
?>The chart classes presented in this chapter are basic and prove sufficient enough to meet your needs. However, to make them truly useful you may want to expand them. Some possible suggestions are adding titles, centering the axis labels, drawing the bars or pie slices so they appear three-dimensional, or whatever else you may think of.
9.4.3. The Report
The information you collect from the database will be displayed in a report page. However, before any data is pulled from the database, it might be a good idea to retrieve some date values that would be useful in constructing queries or to be displayed in the report. This can be done conveniently with the date(), list(), and explode() functions.
list($full_month, $full_year, $short_month, $num_month, $short_year) =
    explode('/', date('F/Y/M/m/y'));
This first portion of the report will show the top 10 unique IP addresses for the current month and current year. Retrieving the unique IP addresses for the current month can be done like this:
$query = sprintf('
    SELECT
        INET_NTOA(IP_ADDRESS) AS IP_ADDRESS
    FROM
        %sSITE_ACCESS
    WHERE
        DATE(ACCESS_TIME) BETWEEN
            "%d-%02d-01" AND
            "%d-%02d-01" + INTERVAL 1 MONTH - INTERVAL 1 DAY
    GROUP BY
        IP_ADDRESS
    ORDER BY
        COUNT(IP_ADDRESS) DESC',
    DB_TBL_PREFIX,
    $full_year,
    $num_month,
    $full_year,
    $num_month);
After the addresses have been retrieved, the top 10 results can be stored in an array. As I chose not to use a LIMIT clause in my SQL statement, I must use a for loop to obtain the first 10 addresses but also check against the total number of records in case less than 10 were returned. This allows me to retrieve the total number of unique visitors for the month at the same time which will also appear in the report.
$result = mysql_query($query, $GLOBALS['DB']);

$mo_total = mysql_num_rows($result);

for ($i = 0; $i < 10 && $i < $mo_total; $i++)
{
    $row = mysql_fetch_assoc($result);
    $mo_addrs[] = $row['IP_ADDRESS'];
}
The same logic applies to retrieving the top IP addresses for the year, although the comparison in the query's WHERE clause is adjusted to retrieve the entire year's addresses.
$query = sprintf('
    SELECT
        INET_NTOA(IP_ADDRESS) AS IP_ADDRESS
    FROM
        %sSITE_ACCESS
    WHERE
        DATE(ACCESS_TIME) BETWEEN
            "%d-01-01" AND
            "%d-01-01" + INTERVAL 1 YEAR - INTERVAL 1 DAY
    GROUP BY
        IP_ADDRESS
    ORDER BY
        COUNT(IP_ADDRESS) DESC',
    DB_TBL_PREFIX,
    $full_year,
    $full_year);
$result = mysql_query($query, $GLOBALS['DB']);

$yr_total = mysql_num_rows($result);

for ($i = 0; $i < 10 && $i < $yr_total; $i++)
{
    $row = mysql_fetch_assoc($result);
    $yr_addrs[] = $row['IP_ADDRESS'];
}
Once the number of unique visitors for the month and year and the list of top 10 addresses have been collected, they can easily displayed in the report.
<table>
 <tr>
  <th>Unique Visitors</th>
  <td>MONTH: <?php echo $mo_total;?></td>
  <td>YEAR: <?php echo $yr_total;?></td>
 </tr><tr>
  <th>Top 10 IP Addresses</th>
  <td>MONTH<br/>
   <?php foreach ($mo_addrs as $addr) echo $addr . '<br/>';?></td>
  <td>YEAR<br/>
   <?php foreach ($yr_addrs as $addr) echo $addr . '<br/>';?></td>
 </tr>
</table>
Unlike the IP addresses, the total number of pages isn't needed so a LIMIT clause may be used in the query to retrieve the top five requested pages for the month and year. This code retrieves the pages for the current month. The query to retrieve pages for the year is only different within the WHERE clause.
$query = sprintf('
    SELECT
        REQ_PAGE, COUNT(REQ_PAGE) AS TOTAL
    FROM
        %sSITE_ACCESS
    WHERE
        DATE(ACCESS_TIME) BETWEEN
            "%d-%02d-01" AND
            "%d-%02d-01" + INTERVAL 1 MONTH - INTERVAL 1 DAY
    GROUP BY
        REQ_PAGE
    ORDER BY
        TOTAL DESC
    LIMIT 5',
    DB_TBL_PREFIX,
    $full_year,
    $num_month,
    $full_year,
    $num_month);
$result = mysql_query($query, $GLOBALS['DB']);

while ($row = mysql_fetch_assoc($result))
{
    $mo_pages_most[] = $row['REQ_PAGE'];
}
mysql_free_result($result);
When the LIMIT clause is used though you must issue another query with the sort order reversed to retrieve the least popular pages. Perhaps a more convenient way to do things would be to omit the LIMIT clause so that all pages are returned. A for loop can be used to retrieve the first five as shown previously, but then the results pointer can be set to the end of the set with mysql_data_seek() and a loop reads the results in reverse for the least five popular. Which method you choose is a matter of taste and clarity.
// assume the query omits LIMIT clause

$total = mysql_num_rows($result);

// retrieve the 5 most popular pages for the month
for ($i = 0; $i < 5 && $i < $ total; $i++)
{
    $row = mysql_fetch_assoc($result);
    $mo_pages_most [] = $row['REQ_PAGE'];
}

// retrieve the 5 least popular pages
for ($i = $total; $i > $total - 5 && $i > 0; $i--)
{
    mysql_data_seek($GLOBALS['DB'], $i - 1);
    $row = mysql_fetch_assoc($result);
    $mo_pages_least[] = $row['REQ_PAGE'];
}
After the most popular and least popular pages have been retrieved for the month and year, they, too, can be displayed in the report. It's then time to pull in the traffic distribution charts. Another file (in my case img/chart.php) will make use of the BarChart class to output the graphic, so it can be referenced with an img tag.
<p><strong>Monthly Traffic Distribution for
   <?php echo $full_year; ?></strong></p>
  <p><img src="img/chart.php?month" alt="monthly traffic distribution"></p>

  <p><strong>Daily Traffic Distribution for <?php echo $full_month . ' ' .
    $full_year; ?></strong></p>
  <p><img src="img/chart.php?day" alt="daily traffic distribution"></p>
Here's the complete code for public_files/report.php:
<?php
include '../lib/common.php';
include '../lib/db.php';

// determine useful date values
list($full_month, $full_year, $short_month, $num_month, $short_year) =
    explode('/', date('F/Y/M/m/y'));
?>
<html>
 <head>
  <title>Website Statistics</title>
  <style type="text/css">
table {
    border-collapse: collapse;
}
th.blank {
    border: none;
}
th, td {
    text-align: center;
    vertical-align: top;
    border: 1px solid black;
    padding: 4px;
}
th.label {
    text-align: right;
}
  </style>
 </head>
 <body>
  <h1>Website Statistics</h1>
  <table>
   <tr>
    <th class="blank"> </th>
    <th>Current Month (<?php echo $short_month . ' ' . $short_year; ?>)</th>
    <th>Year to Date</th></th>
   </tr>
<?php
// retrieve the unique IP addresses for the current month
$query = sprintf('
SELECT
INET_NTOA(IP_ADDRESS) AS IP_ADDRESS
FROM
%sSITE_ACCESS SA
WHERE
DATE(ACCESS_TIME) BETWEEN
"%d-%02d-01" AND
"%d-%02d-01" + INTERVAL 1 MONTH - INTERVAL 1 DAY
GROUP BY
SA.IP_ADDRESS
ORDER BY
COUNT(IP_ADDRESS) DESC',
DB_TBL_PREFIX,
$full_year,
$num_month,
$full_year,
$num_month);
$result = mysql_query($query, $GLOBALS['DB']);
// total addresses
$mo_total = mysql_num_rows($result);
// collect the top 10 IP addresses from the result set
for ($i = 0; $i < 10 && $i < $mo_total; $i++)
{
$row = mysql_fetch_assoc($result);
$mo_addrs[] = $row['IP_ADDRESS'];
}
mysql_free_result($result);
// retrieve the unique IP addresses for the current year
$query = sprintf('
SELECT
INET_NTOA(IP_ADDRESS) AS IP_ADDRESS
FROM
%sSITE_ACCESS
WHERE
DATE(ACCESS_TIME) BETWEEN
"%d-01-01" AND
"%d-01-01" + INTERVAL 1 YEAR - INTERVAL 1 DAY
GROUP BY
IP_ADDRESS
ORDER BY
COUNT(IP_ADDRESS) DESC',
DB_TBL_PREFIX,
$full_year,
$full_year);
$result = mysql_query($query, $GLOBALS['DB']);
// total addresses$yr_total = mysql_num_rows($result);
// collect the top 10 IP addresses from the result set
for ($i = 0; $i < 10 && $i < $yr_total; $i++)
{
$row = mysql_fetch_assoc($result);
$yr_addrs[] = $row['IP_ADDRESS'];
}
mysql_free_result($result);
?>
<tr>
<th class="label">Unique Visitors</th>
<td><?php echo $mo_total;?></td>
<td><?php echo $yr_total;?></td>
</tr><tr>
<th class="label">Top 10 IP Addresses</th>
<td><?php foreach ($mo_addrs as $addr) echo $addr . '<br/>';?></td>
<td><?php foreach ($yr_addrs as $addr) echo $addr . '<br/>';?></td>
</tr>
<?php
// retrieve the top 5 pages accessed during the current month
$query = sprintf('
SELECT
REQ_PAGE, COUNT(REQ_PAGE) AS TOTAL
FROM
%sSITE_ACCESS
WHERE
DATE(ACCESS_TIME) BETWEEN
"%d-%02d-01" AND
"%d-%02d-01" + INTERVAL 1 MONTH - INTERVAL 1 DAY
GROUP BY
REQ_PAGE
ORDER BY
TOTAL DESC
LIMIT 5',
DB_TBL_PREFIX,
$full_year,
$num_month,
$full_year,
$num_month);
$result = mysql_query($query, $GLOBALS['DB']);
// collect the pages from the result set
while ($row = mysql_fetch_assoc($result))
{
$mo_pages_most[] = $row['REQ_PAGE'];
}
mysql_free_result($result);
// retrieve the top 5 pages accessed during the current year
$query = sprintf('
SELECTREQ_PAGE, COUNT(REQ_PAGE) AS TOTAL
FROM
%sSITE_ACCESS
WHERE
DATE(ACCESS_TIME) BETWEEN
"%d-01-01" AND
"%d-01-01" + INTERVAL 1 YEAR - INTERVAL 1 DAY
GROUP BY
REQ_PAGE
ORDER BY
TOTAL DESC
LIMIT 5',
DB_TBL_PREFIX,
$full_year,
$full_year);
$result = mysql_query($query, $GLOBALS['DB']);
// collect the pages from the result set
while ($row = mysql_fetch_assoc($result))
{
$yr_pages_most[] = $row['REQ_PAGE'];
}
mysql_free_result($result);
?>
<tr>
<th class="label">Top 5 Most Popular Pages</th>
<td><?php foreach ($mo_pages_most as $addr) echo $addr . '<br/>';?></td>
<td><?php foreach ($yr_pages_most as $addr) echo $addr . '<br/>';?></td>
</tr>
<?php
// reverse sort order to retrieve the 5 least popular pages
$query = sprintf('
SELECT
REQ_PAGE, COUNT(REQ_PAGE) AS TOTAL
FROM
%sSITE_ACCESS
WHERE
DATE(ACCESS_TIME) BETWEEN
"%d-%02d-01" AND
"%d-%02d-01" + INTERVAL 1 MONTH - INTERVAL 1 DAY
GROUP BY
REQ_PAGE
ORDER BY
TOTAL ASC
LIMIT 5',
DB_TBL_PREFIX,
$full_year,
$num_month,
$full_year,
$num_month);
$result = mysql_query($query, $GLOBALS['DB']);
// collect the least popular pages from the result setwhile ($row = mysql_fetch_assoc($result))
{
$mo_pages_least[] = $row['REQ_PAGE'];
}
mysql_free_result($result);
$query = sprintf('
SELECT
REQ_PAGE, COUNT(REQ_PAGE) AS TOTAL
FROM
%sSITE_ACCESS
WHERE
DATE(ACCESS_TIME) BETWEEN
"%d-01-01" AND
"%d-01-01" + INTERVAL 1 YEAR - INTERVAL 1 DAY
GROUP BY
REQ_PAGE
ORDER BY
TOTAL ASC
LIMIT 5',
DB_TBL_PREFIX,
$full_year,
$full_year);
$result = mysql_query($query, $GLOBALS['DB']);
// collect the least popular pages
while ($row = mysql_fetch_assoc($result))
{
$yr_pages_least[] = $row['REQ_PAGE'];
}
mysql_free_result($result);
?>
<tr>
<th class="label">Top 5 Least Popular Pages</th>
<td><?php foreach ($mo_pages_least as $addr) echo $addr . '<br/>';?></td>
<td><?php foreach ($yr_pages_least as $addr) echo $addr . '<br/>';?></td>
</tr>
</table>
<p><strong>Monthly Traffic Distribution for
<?php echo $full_year; ?></strong></p>
<p><img src="chart.php?month" alt="monthly traffic distribution"></p>
<p><strong>Daily Traffic Distribution for <?php echo $full_month . ' ' .
$full_year; ?></strong></p>
<p><img src="chart.php?day" alt="daily traffic distribution"></p>
</body>
</html>Another file is needed to use the BarChart class and output the chart. Since it will output an image, I've chosen to store the file in the public_files/img directory.
The script is passed a parameter so it can determine the correct query to execute. If an appropriate parameter is not received, then the script terminates as there is no sense in continuing forward and the img element will present a broken image. A day parameter will retrieve the total number of page hits for a given month and display them by day. A month parameter will retrieve the total number of hits for the year and display them by month.
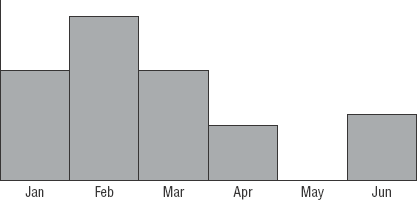
A word of caution: You must initialize the data arrays you pass to BarChart first. If the data set has any missing dates and you just read in the database records and assign them, then the missing values would be skipped over in the chart as shown in Figure 9-4. Sometimes you may want this behavior. Typically, however, this isn't desired and space for the missing value should still be allocated as shown in Figure 9-5.
Here's one way you can initialize the data set prior to querying the database for month values as an example:
// initialize arrays
for ($i = 1; $i < 13; $i++)
{
    $data[$i] = 0;
    $labels[$i] = date("M", mktime(0,0,0,$i));
    $colors[$i] = array('r' => 0xCC, 'g' => 0x33, 'b' => 0x33);
}
Figure 9-4. Figure 9-4
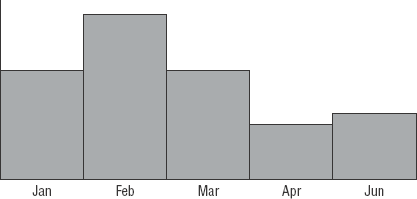
Figure 9-5. Figure 9-5
Here is the complete code listing for public_files/img/chart.php:
<?php
include '../../lib/common.php';
include '../../lib/db.php';
include '../../lib/BarChart.php';

// get current month and year
list($month, $year) = explode('/', date('m/Y'));

// determine which query to execute
if (isset($_GET['day']))
{
    // initialize arrays
    $num_days = date("t", mktime(0, 0, 0, $month, 1, $year));
    for ($i = 1; $i < $num_days + 1; $i++)
    {
        $data[$i] = 0;
        $labels[$i] = $i;
        $colors[$i] = array('r' => 0xCC, 'g' => 0x33, 'b' => 0x33);
    }

    // retrieve total hits
    $query = sprintf('
        SELECT
            DAY(ACCESS_TIME) AS ATIME, COUNT(IP_ADDRESS) AS TOTAL
        FROM
            %sSITE_ACCESS
        WHERE
            DATE(ACCESS_TIME) BETWEEN
                "%d-%02d-01" AND
                "%d-%02d-01" + INTERVAL 1 MONTH - INTERVAL 1 DAY
        GROUP BY
            ATIME
        ORDER BY
            ATIME ASC',
        DB_TBL_PREFIX,
        $year,
        $month,
$year,
$month);
$result = mysql_query($query, $GLOBALS['DB']);
while ($row = mysql_fetch_assoc($result))
{
$data[$row['ATIME']] = $row['TOTAL'];
}
mysql_free_result($result);
}
else if (isset($_GET['month']))
{
// initialize arrays
for ($i = 1; $i < 13; $i++)
{
$data[$i] = 0;
$labels[$i] = date("M", mktime(0,0,0,$i));
$colors[$i] = array('r' => 0xCC, 'g' => 0x33, 'b' => 0x33);
}
// retrieve total hits
$query = sprintf('
SELECT
MONTH(ACCESS_TIME) AS ATIME, COUNT(IP_ADDRESS) AS TOTAL
FROM
%sSITE_ACCESS
WHERE
DATE(ACCESS_TIME) BETWEEN
"%d-01-01" AND
"%d-12-31"
GROUP
BY ATIME
ORDER BY
ATIME ASC',
DB_TBL_PREFIX,
$year,
$year);
$result = mysql_query($query, $GLOBALS['DB']);
while ($row = mysql_fetch_assoc($result))
{
$data[$row['ATIME']] = $row['TOTAL'];
}
mysql_free_result($result);
}
else
{
die();
}
// present bar chart
$chart = new BarChart(500, 200);
$chart->graphData($data, $colors, $labels);
$chart->flushImage();
?>