Pizza Station
Kathryn Marley, Duquesne University
Gopesh Anand, University of Illinois at Urbana–Champaign
Background
Established in 1980, Pizza Station is located in the trendy downtown area of Salina, Pennsylvania. Situated within walking distance of Salina State College, the restaurant initially offered in-house dining and a variety of food items on its menu. However, as competition among local restaurants grew, Pizza Station’s staff decided to limit their offerings to delivery of pizzas in early 2001. Since then, they have developed a loyal following among customers who have come to expect quick and reliable delivery of good-quality pizza from the restaurant. Nevertheless, in the past two years, manager Tom Smith has noticed that customer complaints have increased significantly. With new pizza outlets and other restaurants opening up in the area every year, Tom is concerned that unless changes can be made quickly, Pizza Station will lose market share, and might eventually have to close its doors permanently.
Pizza Station operates seven days a week. On Sunday through Thursday, the hours are noon through 1 a.m. On Fridays and Saturdays, the hours are noon through 3 a.m. The busiest hours are on Fridays and Saturdays between 9 p.m. and 2 a.m. Demand for pizza varies throughout the week and times of day. From Sunday through Thursday, the average daily demand is 300 pizzas. Fridays and Saturdays are busier, with average demand increasing to 650 pizzas per day. On these two days, the demand during each busy 9 p.m.–2 a.m. period averages 400 pizzas. Currently, Pizza Station is promising a delivery time of 45 minutes to customers.
Tom recently hired Kate Fox, a business major from Salina State College, to manage the weekend shift. He asked her for assistance in identifying the necessary changes that would enable Pizza Station to decrease complaints, increase customer satisfaction, and win back lost customers. Kate recently completed a Lean Six Sigma training course as one of her business school classes; and, eager to apply some of the things she learned, she sat down with Tom to discuss the situation.
“I don’t know where we went wrong and, frankly, I don’t know where to begin!” exclaimed Tom. “All I know is that our troubles seem to have suddenly multiplied since last January when the students came back to campus. Things started off normally, but over the next three months I noticed a steadily increasing number of complaints.” Tom pulled out a file folder from the bottom of a stack on his desk. Inside were papers of varying sizes with notes scribbled on them. He squinted as he tried to read them. “This customer said the crust was too thin, while this one said the delivery time was too long.” As he read from the stack of mismatched notes, Kate realized that they were going to have to implement a better system for capturing customer feedback—and fast, if they were going to turn this place around.
“Okay, Tom, I get the idea,” said Kate. “Let’s start at the beginning. We need to approach this problem from a systematic process improvement perspective—which first involves figuring out what is the voice of the customer.” Tom looked confused. Kate continued, “The voice of the customer (or VOC) consists of customer requirements, which is what the customer is expecting Pizza Station to deliver. There is no chance that customers are going to keep ordering pizza from Pizza Station if these expectations are not being met. So you need to capture this information to know where to begin to make changes.”
“Sounds great, Kate,” said Tom. “Let’s get started!”
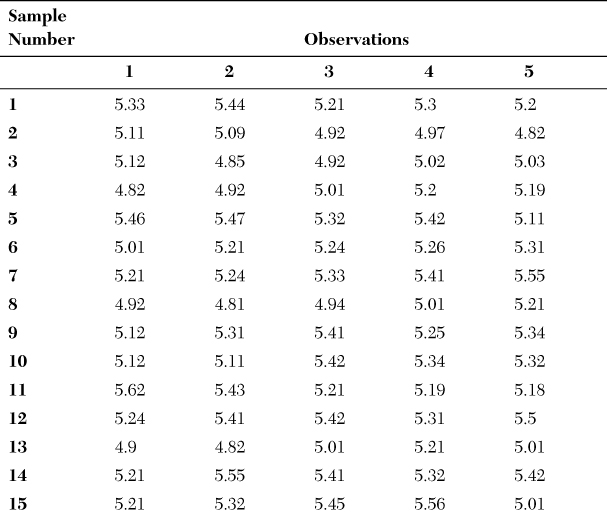
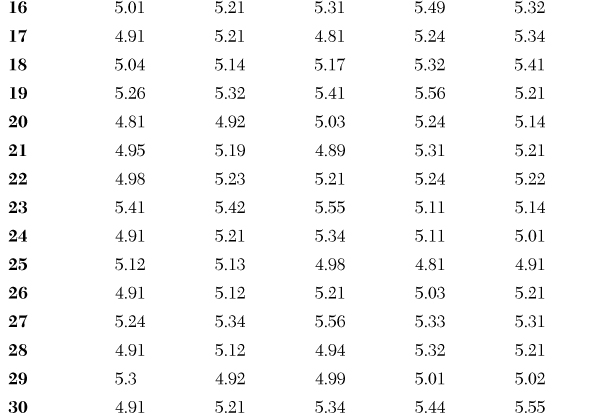
A customer satisfaction study was commissioned to figure out the voice of the customer (VOC). It pointed to delivery time and crust thickness as being critical to quality (CTQ) characteristics. An analysis of recent sales data revealed that the most commonly ordered crust from Pizza Station was the unique medium crust. In addition, three focus groups with eight customers each revealed that the ideal medium pizza crust was found to be between 4.25 mm and 5.75 mm. To measure what the process was actually producing (voice of the process, or VOP), Kate took a sample of five medium pizza crusts every day over a period of 30 days, and measured their thickness. The data that she collected is provided in Exhibit 1.
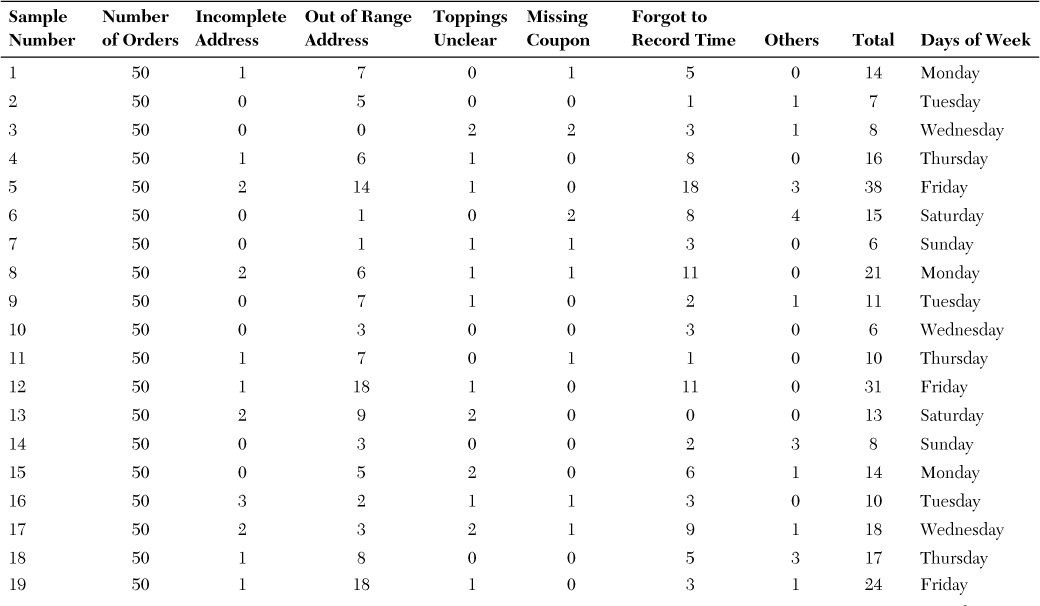
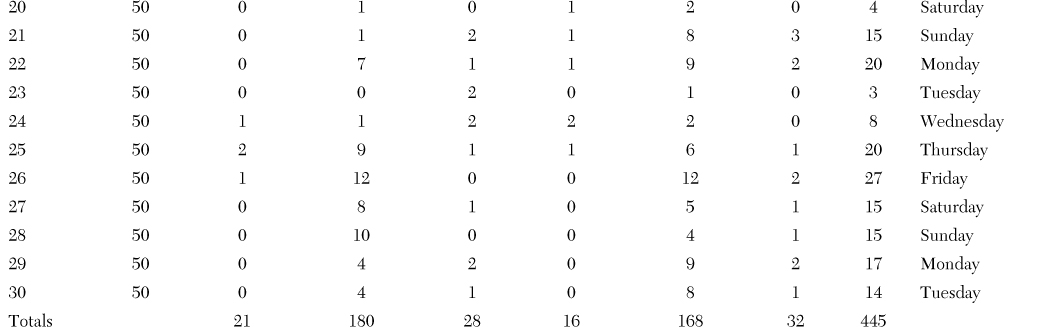
Kate’s training in Lean Principles also prompted her to talk with the employees who actually work on the pizza-making line. As she told Tom, people working on the frontlines of any process know the most about how the work is done. From the spirited discussion that Kate had with the staff, it soon became apparent that they believed the task of order-taking had problems. So, she asked them to collect data on this task. For 30 days, they took samples of 50 orders every day, inspected them, and recorded all the errors involved. This data is provided in Exhibit 2.
Next, choosing one of the busiest times at Pizza Station, Kate walked the process to map the value stream for pizza-making and delivery. She explained to Tom that this exercise was aimed at 1) getting some measurements of different tasks in the process, and 2) gaining additional insights into the current length of delivery time. Because the peak demand period for Pizza Station is Friday nights between 9 p.m. and 2 a.m., Kate and Tom walked the process at that time and observed the following steps involved in making pizzas. Their observations are described in the following sections.
There are a total of five employees in the store on Friday nights, along with nine delivery drivers on staff. The pizza-making process begins with orders received by phone. Next, pizzas are assembled and baked. Finally, the pizzas are cut, boxed, labeled, and delivered to the customers.
Ordering
There are no designated operators who answer the phones at Pizza Station. The phones are answered by whoever is “nearby” at the time. That can be any of the four employees who are working the pizza line during the shift, with the exception of the employee who is dedicated to the baking process. It is estimated that each of the four employees spends 20% of her time answering phones. Kate watched the order-taking process for 15 minutes. During that time, orders for 20 pizzas were received. After the customer places the order, the employee who took the order informs the customer about the price and the estimated delivery time. The order is written on a note pad and hung on a board for the assembly station workers to retrieve as they become available. Kate observed during those 15 minutes that there were orders for 5 pizzas waiting to be assembled; an order waits on average 225 seconds before moving to assembly.
Pizza Assembly
Each of the four employees dedicates 60% of her time to assembling pizza. After an order is received, an assembly worker retrieves a ball of pizza dough from the refrigerator at the back of the store. Employees only retrieve one ball of pizza dough at a time. It takes, on average, three minutes for one employee to walk to the refrigerator and back every time an order is received. The worker begins by flattening the dough to the desired thickness and forming the crust. Next, the worker drizzles oil on the crust and assembles the pizza, which includes adding sauce, cheese, toppings, and seasonings. Kate noticed that this process took an average of 90 seconds per pizza. After the pizza is completed, it is placed on a tray until there is an available rack in the oven. Kate observed six pizzas waiting to be baked. A pizza waits 270 seconds before baking on average.
Baking
The oven used for baking the pizzas is set at 500 degrees to ensure crisp and efficient baking. The baking process takes nine minutes and the oven can hold six pizzas at a time. There is one worker at the oven station, who dedicates 100% of her time to putting the pizzas in the oven and removing them, as well as monitoring the baking time of each pizza. After the pizza is baked, it is removed and placed on a large wooden tray. Kate observed 15 pizzas waiting to be cut. A pizza waits an average of 675 seconds before moving to the next station.
Cutting/Boxing/Labeling
The four employees dedicate 20% of their time to cutting and boxing the pizzas. When the pizza is removed from the oven, a worker uses a metal cutter to cut the pizza into the appropriate number of slices. Then he assembles the box and places the cut pizza in the box. The employee then goes to the order station, retrieves the address information from the order slip, and writes this information on the pizza box. The boxed pizza is placed on the delivery counter and waits for delivery. Cutting the pizza takes an average of 5 seconds. Making the box takes 20 seconds. Placing the pizza in the box and closing the lid takes 5 seconds on average. Retrieving the order information and writing the information on the box takes 90 seconds on average. Kate observed 10 pizzas waiting to be delivered, and that, on average, the pizzas wait 450 seconds before being taken out for delivery.
Delivery
There are nine dedicated delivery drivers. When a driver returns from a delivery, she checks to see whether there is another pizza waiting to be delivered. If there is, she proceeds with delivering that pizza. If there is not, she is free to wait in the break room until there is a pizza waiting to be delivered. Each delivery driver delivers one order at a time. Because the majority of Pizza Station customers live within a five-mile radius of the restaurant, a worker is usually able to deliver a pizza and be back in the restaurant within 18 minutes; therefore, the delivery time to the customer is approximately 9 minutes.
Suppliers
Tom Smith is in charge of ordering all the supplies and ingredients for the restaurant. The pizza dough is made by a local bakery and delivered once a week by truck to Pizza Station. Each delivery consists of 2,500 pizza crusts. After the crusts are received, they are stored in a large refrigerator in the back of the storeroom. Because the delivery day varies, on average there are 1,250 balls of dough on hand.
Analysis
After walking the process with Tom, Kate started scrutinizing the current state of operations as depicted in the value stream map to consider potential areas of improvement. Tom was skeptical but excited. “Let’s get going, Kate; I don’t want to lose one more customer if I can help it. Let’s get Pizza Station back on top where we belong!”
Assume you are a new addition to Kate’s Lean Six Sigma team. Answer the following questions:
1. Based on the sample data on pizza thickness collected for the 30-day period and presented in Exhibit 1, construct an X-bar–R chart. Include the information on customer requirements obtained through the focus groups, conduct a process capability analysis, and interpret its result.
2. Based on the data on errors in order-taking provided in Exhibit 2, construct a Pareto chart to identify the areas that should be top priorities for Pizza Station.
3. Compute the DPMO and sigma level of the order-taking task using the data in Exhibit 2.
4. Using the data on total daily errors provided in Exhibit 2, conduct an analysis of variance (ANOVA) test to determine whether there is a significant difference in errors on different days of the week.
5. Construct the appropriate control chart (based on the nature of the data collected) for the total number of defects or errors per 50 orders shown in Exhibit 2. Is this process in statistical control?
6. What is the Takt time for this process (in seconds)? (Note: Because the information was gathered during the Friday evening shift, use that time period for this analysis.)
7. Draw a Current State Map of this pizza-making process. Pizza Station is quoting a delivery lead time of 45 minutes to its customers. What is the total lead time between ordering and delivery? Is Pizza Station capable of meeting this promise based on your Current State Map calculations?
8. Develop a list of the symptoms that indicate problem areas in the pizza-making and delivery value stream. Provide suggestions for how the problems underlying the symptoms might be reduced or eliminated.
9. Draw a Future State Map of the pizza-making process, incorporating the changes you suggested in #8.
10. Develop an implementation plan for your suggested improvements at Pizza Station.