
Voter Rationality and Macroeconomic Preferences
Introduction: Rational Voting, Rational Ignorance, and Political Parties
Rational voter theory asserts that citizens generally cast votes based on a rational decision-making process (Downs 1957). The political opinion-making process involves a subjective cost–benefit analysis by voters. Citizens rationally consider the different policy platforms among the political candidates and political parties. Citizens vote for the politician who supports the set of policies that offer the greatest perceived political net benefit. Individuals vote for the political candidate whose policies most closely resemble their own political preferences. A citizen’s political preference is the most preferred political outcome.
However, becoming fully informed on political and economic issues, and developing well-thought-out opinions is time-consuming and costly. Individuals often do not devote enough time and other resources to become completely informed on all relevant politico-economic matters that affect them. Rational ignorance consequently occurs. Rational ignorance refers to a voter’s decision to remain partially uninformed on some political issues because the costs of becoming more politically aware exceed the added benefits from gaining a more-informed opinion.
Political parties play an important role in rational ignorance. Some citizens simply vote for their preferred political party. A voter’s preferred political party is the party that most closely aligns with the voter’s overall political viewpoint. Voting for the politician who is a member of the preferred political party is straightforward. This process is less costly than the alternative approach of developing a fully informed opinion about all the political candidates. Voting for the candidate of the preferred political party is less complex than becoming knowledgeable of all policy proposals from all candidates.
Normal Distribution of Voter Preferences: The Partisan Model and the Median Voter Model
Voters form political views and cast votes based on a subjective cost–benefit analysis of the issues, political candidates, and political parties. The median voter is the middle voter within the overall range of citizen political preferences. Figure 5.1 shows the distribution of voter preferences with respect to the median voter and the left and right political parties.

Figure 5.1 Political party platforms and the median voter model
The bell-shaped curve in Figure 5.1 is the distribution of voter preferences for a public policy, such as macroeconomic policy. The diagram shows a normal distribution of voter preferences as demonstrated by the bell-shaped curve. The frequency distribution of voter preferences is measured along the vertical axis, and the range of voter policy preferences is measured along the horizontal axis.
Voters with political preferences toward the right side of the horizontal axis are relatively conservative in political orientation. Voter preferences toward the left side of the horizontal scale are relatively liberal. Voter preferences are increasingly conservative moving from left to right along the horizontal axis. Voter preferences become more liberal moving from right to left. The vertical line at the center peak of the preference distribution is the median voter’s most preferred political outcome.
Partisan Influence Model and the Macroeconomy
Two vertical lines appear to the right and left of the median voter’s preference. The two lines signify the policy positions of the conservative and liberal political parties. The partisan influence theory asserts that the left and right political parties support policies to the left and right of the center of the voter preference distribution. These two partisan positions align with the preferences of the core constituencies of the left and right parties.
The political parties seek to maximize financial support and approval from their core constituencies. Elected officials place greater emphasis on partisan-related interests rather than the overall sentiment of all voters. The two main parties embrace polices that appeal to their core constituencies instead of the median voter’s preference. The policy stances of the two parties consequently remain stable at the left and right vertical lines. A partisan divide occurs in the policies of the two parties.
For example, a conservative macroeconomic preference places a strong emphasis on maintaining low inflation relative to unemployment. A liberal macroeconomic preference focuses on low unemployment compared to inflation. Partisan macroeconomic theory suggests that the president embraces policies that align with the partisan macroeconomic agenda. Democratic presidents support policies that emphasize low unemployment. Republican incumbents support policies that focus on low inflation.
Median Voter Model and the Macroeconomy
In addition to the partisan influence model, the other main framework for political party behavior is the median voter model. The median voter model considers the role of political parties and the objective of politicians to win elections. The median voter theory suggests that politicians modify their opinions and actions over time to align with the median voter’s most preferred political outcome. This happens regardless of the politician or the political party in power.
Let us once again refer to a normal distribution of citizen preferences. The initial political party preferences occur at the right and left vertical lines in Figure 5.1. Now, assume that the conservative political party seeks to increase its vote share in an upcoming election. The conservative party vote share is the fraction of the two-party vote in favor of the conservative political candidate. The liberal party vote share is the fraction of the two-party vote in favor of the liberal candidate. The two-party vote is the sum of votes for the conservative candidate plus the liberal candidate.
To increase the vote share for the conservative candidate, the conservative party shifts its policy stance to the left toward the median voter’s preference. The conservative political party consequently induces some centrist voters to switch their vote from the liberal candidate to the conservative politician. The liberal political party observes this strategy and responds by shifting its policy position more to the right toward the median voter so as not to lose votes. A political competition occurs between the two parties as each side seeks to increase its vote share. Each political party moves its policy position closer toward the center until both political parties end up with similar policies coinciding with the median voter’s preference.
In the long run, the political party that is elected becomes largely irrelevant in a competitive political market. To maximize votes and approval ratings, the two major political parties and the associated political candidates end up adopting similar policies that match the median voter’s most preferred outcome.
Consider the median voter model in terms of macroeconomic policy. The median voter’s macroeconomic preference is the median person’s opinion of ideal macroeconomic performance. This preference consists of an unemployment target and an inflation target. The targets reflect the median citizen’s opinion of ideal unemployment and ideal inflation.
Suppose the median voter’s preference consists of an inflation target of 3 percent and an unemployment target of 5 percent. The median voter’s economic well-being is maximized if actual economic performance ends up being equal to this preferred outcome. Alternatively, the median individual’s satisfaction declines if the economy ends up deviating from this median preference. In the median voter model, the president (regardless of political party) supports macroeconomic policies that attain the median voter’s inflation and unemployment targets. This policy strategy seeks to maximize approval ratings and increase reelection prospects.
Time-Consistent Macroeconomic Preference
The median voter model asserts that the president supports policies that attain the median voter’s macroeconomic preference. This enables the president to increase approval ratings and reelection votes. The median preference may be time consistent or time inconsistent. A time-consistent (or dynamically consistent) macroeconomic preference is farsighted. The preference is compatible with the long-run potential of the economy. A consistent macroeconomic preference is sustainable. The sustainable unemployment target is equal to the natural unemployment rate. The natural rate is the lowest level of unemployment the economy can maintain over an extended period of time.
Let us assume the median voter’s preference consists of an unemployment target equal to the natural rate (of say 5 percent) and an inflation target of 3 percent. This is point A in Figure 5.2. This occurs at the intersection between the long-run Phillips curve and the short-run Phillips curve, S1. The median voter’s macroeconomic preference is dynamically consistent and sustainable. The preference is consistent because it occurs at a point on the long-run Phillips curve. The economy can maintain this level of performance in the absence of economic shocks. The incumbent maximizes popularity and reelection votes by supporting macroeconomic policies that attain point A.
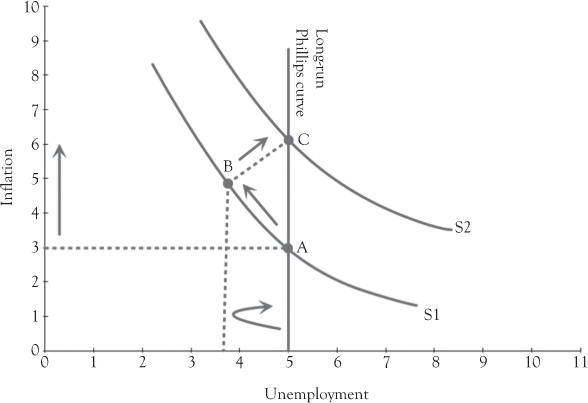
Figure 5.2 Macroeconomic time consistency versus inconsistency
Time-Inconsistent Macroeconomic Preference
Now, consider what happens if the median voter’s macroeconomic preference is dynamically inconsistent. The median voter’s preference is incompatible with the long-run capabilities of the economy. Dynamic inconsistency arises if the median voter’s unemployment target is less than the natural unemployment rate. An unemployment target less than the natural rate is shortsighted or unsustainable. Dynamic inconsistency occurs if the median voter does not recognize the long-run potential of the economy. The median voter may be uninformed about the level of macroeconomic performance that is possible over the long term.
Let us assume the median voter’s preference is inconsistent and that the president embraces policy to attain the median voter’s inconsistent macroeconomic preference. Stabilization policy that seeks to maintain an unemployment target that is less than the natural rate is not feasible. An inconsistent unemployment target triggers economic overheating and rising inflation. To show this result, suppose the economy is initially at point A in Figure 5.2. Let us also assume the median voter’s preference is equal to an unemployment target of 3.75 percent and an inflation target of 5 percent. This inconsistent preference is shown as point B in Figure 5.2.
Expansionary stabilization policy can temporarily attain this level of economic performance. Through expansionary policy, the economy moves up and to the left along the short-run Phillips curve S1 from point A to point B where the inconsistent preference is realized. Point B, however, is not sustainable. Point B is a temporary outcome that cannot be maintained. Pressures in the labor market build up. This causes inflationary expectations and the wage rate to rise. Workers seek higher wages to compensate for higher product prices associated with the movement from point A to point B. As wage costs go up, the Phillips curve shifts right from S1 to S2. The higher labor costs cause businesses to reduce output and jobs. This causes unemployment to rise and return to the sustainable natural rate of 5 percent. Additionally, firms shift the burden of higher labor costs to consumers in the form of higher product prices. Inflation rises to about 6 percent. The economy adjusts to point C in the long term.
Table 5.1 summarizes macroeconomic consistency versus macroeconomic inconsistency.
Table 5.1 Dynamic macroeconomic consistency and inconsistency
Median voter’s macroeconomic preference |
Median voter’s unemployment target |
Macroeconomic results |
Time-inconsistent macroeconomic preference |
Unemployment target is less than the natural unemployment rate |
Unsustainable unemployment target; economic overheating and rising inflation occur; the unemployment rate returns to the natural rate in the long run |
Time-consistent macroeconomic preference |
Unemployment target is equal to the natural unemployment rate |
Unemployment target is sustainable in the long run |
Macroeconomic Inconsistency and the Electoral Cycle
The electoral political business cycle effect may occur if macroeconomic inconsistency takes place. The electoral cycle effect assumes the median voter’s macroeconomic preference is dynamically inconsistent. The median voter’s unemployment target, in this case, is less than the natural rate. Consequently, the president may decide to embrace opportunistic policy to temporarily attain the median voter’s inconsistent preference. The president and the incumbent political party can increase reelection votes by adopting opportunistic policy that temporarily reduces unemployment below the natural rate in an election year. The president engineers an economic expansion prior to the election to increase reelection votes. This short-term favorable economic outcome, however, comes at the cost of greater inflation after the presidential election.
The opposite result occurs if the median voter’s macroeconomic preference is time consistent and farsighted. A decline in unemployment below the natural rate prior to an election causes a decrease (rather than increase) in the presidential reelection vote share. In this case, overly expansive macroeconomic policy is recognized as an attempt to create a temporary economic boom that comes at the cost of higher inflation after the election. If the median voter’s macroeconomic preference is farsighted, then macroeconomic opportunism by the president fails to increase reelection votes.
Bimodal Distribution of Preferences, Protest Vote Abstention, and the Partisan Influence Model
Let us consider the policy outcome that could develop in a bimodal distribution of voter preferences. In this case, the partisan effect may occur rather than the median voter effect. In this instance, two peaks or modes occur within the bimodal range of voter preferences. The two modes align with the policy preferences of the liberal and conservative core constituencies. Voter sentiment is split into two major camps that take place at the two modes to the left and right of the median voter’s preference.
The partisan effect based on a bimodal distribution of voter macroeconomic preferences is shown in Figure 5.3.

Figure 5.3 Bimodal distribution of voter preferences
In a bimodal distribution of voter preferences, the policy platforms of the left and right parties may not converge to the center as predicted by the median voter model. Instead, the political party platforms may remain stable at the two modes in the preference distribution.
In Figure 5.3, the conservative party preference is the right vertical line and the liberal party policy preference is the left vertical line. The policy preferences of the two parties do not converge to the median voter’s preference if protest vote abstention arises. Protest vote abstention occurs if far-wing voters abstain from voting as a protest against the political parties.
Protest vote abstention happens if a political party shifts its policies too close to the center. Some right-wing voters abstain from voting if the right party moves its policy too close to the middle. Some left-wing voters refrain from voting out of protest if the left party shifts its policy platform too close to the center. Consequently, to prevent a loss of votes from far-wing supporters, the two political parties maintain their policy platforms at the two peaks to the left and right of the median voter’s preference.
A related concept is rational vote abstention. A percentage of citizens refrain from voting if they consider their vote as inconsequential in an election outcome. Some citizens choose not to vote because the costs of voting outweigh the perceived influence of their vote on an election result. Rational vote abstention may or may not impact an election outcome. If rational vote abstention occurs evenly across the range of voters on both the political right and the political left, then the election outcome is unchanged.
If rational vote abstention is concentrated across a narrow range of voters, however, then the effect could impact an election result. For example, suppose rational vote abstention occurs primarily among liberal voters. The election outcome is consequently swayed in favor of the conservative candidate. If rational vote abstention mainly occurs among conservative voters, then the election vote outcome shifts more in favor of the liberal candidate.
Conclusion
This chapter discusses voter rationality and political parties in the median voter framework. We also consider dynamic consistency versus dynamic inconsistency in the expectational Phillips curve model. We discuss the median voter model and dynamic inconsistency in relation to the electoral cycle effect. Additionally, we examine the partisan macroeconomic model in the context of a normal distribution and a bimodal distribution of voter preferences. Finally, we discuss the influence of protest vote abstention and rational vote abstention on election outcomes. Chapter 6 examines the electoral cycle effect in more detail. Chapter 7 looks at the partisan influence model in greater detail. Chapter 8 examines the U.S. economy for evidence of partisan cycle and electoral cycle effects from 1961 to 2016.