
7
UART, JTAG, and SWD Exploitation

If you understand the protocols that interact directly with a system’s electronic components, you can target IoT devices at the physical level. The Universal Asynchronous Receiver-Transmitter (UART) is one of the simplest serial protocols, and its exploitation provides one of the easiest ways to gain access to IoT devices. Vendors typically use it for debugging, which means that you can often obtain root access through it. To accomplish this, you’ll need some specialized hardware tools; for instance, it’s common for attackers to identify the UART pins on a device’s printed circuit board (PCB) using a multimeter or logic analyzer. They then connect a USB-to-serial adapter to these pins and open a serial debug console from the attacking workstation. Most of the time, if you do this, you’ll be dropped to a root shell.
The Joint Test Action Group (JTAG) is an industry standard (defined in IEEE 1491.1) for debugging and testing increasingly complex PCBs. JTAG interfaces on embedded devices allow us to read and write memory contents, including dumping the entire firmware, which means it serves as a way to gain complete control of a target device. Serial Wire Debug (SWD) is a very similar, even simpler electrical interface than JTAG that we’ll examine here as well.
We spend most of this chapter walking through a lengthy practical exercise; you’ll program, debug, and exploit a microcontroller to bypass its authentication process using UART and SWD. But first we explain the inner workings of these protocols and show you how to identify UART and JTAG pinouts on a PCB using hardware and software tools.
UART
UART is a serial protocol, which means it transfers data between components one bit at a time. In contrast, parallel communication protocols transmit data simultaneously through multiple channels. Common serial protocols include RS-232, I2C, SPI, CAN, Ethernet, HDMI, PCI Express, and USB.
UART is simpler than many of the protocols you’ve likely encountered. To synchronize communications, the UART transmitter and receiver must agree on a specific baud rate (the rate of bits transmitted per second). Figure 7-1 shows the UART packet format.

Figure 7-1: UART packet format
Generally, the line is held high (at a logical 1 value) while UART is in the idle state. Then, to signal the start of a data transfer, the transmitter sends a start bit to the receiver, during which the signal is held low (at a logical 0 value). Next, the transmitter sends five to eight data bits containing the actual message, followed by an optional parity bit and one or two stop bits (with a logical 1 value), depending on the configuration. The parity bit, used for error checking, is rarely seen in practice. The stop bit (or bits) signify the end of transmission.
We call the most common configuration 8N1: eight data bits, no parity, and one stop bit. For example, if we wanted to send the character C, or 0x43 in ASCII, in an 8N1 UART configuration, we would send the following bits: 0 (the start bit); 0, 1, 0, 0, 0, 0, 1, 1 (the value of 0x43 in binary), and 0 (the stop bit).
Hardware Tools for Communicating with UART
You can use a variety of hardware tools to communicate with UART. One easy option is a USB-to-serial adapter, like the one we use in “Hacking a Device Through UART and SWD” on page 168. Other options include adapters with the CP2102 or PL2303 chips. If you are new to hardware hacking, we recommend getting a multipurpose tool that supports protocols other than just UART, such as the Bus Pirate, the Adafruit FT232H, the Shikra, or the Attify Badge.
You can also find a list of tools and their descriptions, as well as links to buy them, in “Tools for IoT Hacking” at the end of this book.
Identifying UART Ports
To exploit a device through UART, you first need to locate its four UART ports, or connectors, which typically come in the form of pins or pads (plated holes). The term pinout refers to the diagram of all the ports. We’ll use these terms interchangeably throughout this book. A UART pinout has four ports: TX (Transmit), RX (Receive), Vcc (Voltage), and GND (Ground). Start by opening the device’s external case and removing the PCB. Be warned that this might void your warranty.
These four ports often appear next to each other on the board. If you’re lucky, you might even find markings that indicate the TX and RX ports, as shown in Figure 7-2. In that case, you can be fairly certain that the set of four pins are the UART pins.

Figure 7-2: UART pins clearly marked as DBG_TXD and DBG_RXD on the PCB in a St. Jude/Abbott Medical Merlin@home Transmitter
In other cases, you might see four through-hole pads next to each other, like those in the TP-Link router in Figure 7-3. This might occur because vendors have removed the UART header pins from the PCB, which means that you might have to either perform some soldering to reach them or use test probes. (Test probes are physical devices that connect electronic test equipment to a device. They include a probe, cable, and terminating connector. We show a few examples of test probes in Chapter 8.)
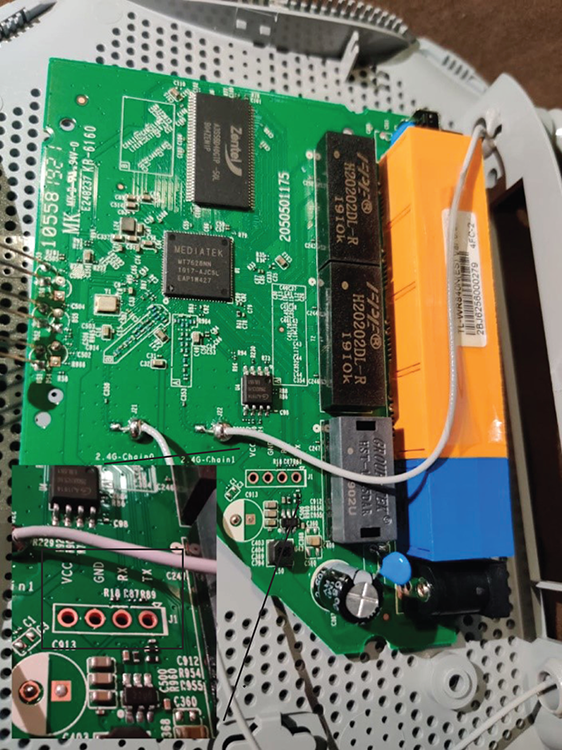
Figure 7-3: A PCB in a TP-Link TL WR840N router. On the bottom left, you can see a zoomed-in part of the PCB with the UART pads.
Also, keep in mind that some devices emulate UART ports by programming the General-Purpose Input/Output (GPIO) pins if there isn’t enough space on the board for dedicated hardware UART pins.
When UART pins aren’t marked as clearly as those shown here, you can typically identify them on a device in two ways: by using a multimeter or by using a logic analyzer. A multimeter measures voltage, current, and resistance. Having a multimeter in your arsenal when doing hardware hacking is highly important, because it can serve a variety of purposes. For example, we commonly use it to test for continuity. A continuity test sounds a buzzer when a circuit’s resistance is low enough (less than a few ohms), indicating that there’s a continuous path between the two points probed by the multimeter’s leads.
Although a cheap multimeter will do the job, we recommend that you invest in a robust and precise multimeter, if you plan to delve deeper into hardware hacking. True RMS multimeters are more accurate for measuring AC currents. Figure 7-4 shows a typical multimeter.

Figure 7-4: Common multimeter. Highlighted is the Continuity Test mode, which typically has an icon that looks like a sound wave (because of the buzzer that sounds when detecting continuity).
To identify UART pinouts using a multimeter, start by making sure the device is powered off. By convention, you should connect a black test lead to the multimeter’s COM jack. Insert a red lead in the VΩ jack.
Begin by identifying the UART GND. Turn the multimeter dial to the Continuity Test mode, which typically has an icon that looks like a sound wave. It might share a spot on the dial with one or more functions, usually resistance. Place the other end of the black lead on any grounded metallic surface (an area that has a direct conductive path to earth), be it a part of the tested PCB or not.
Then place the red probe on each of the ports you suspect might be part of the UART pinout. When you hear a beeping sound from the multimeter, you’ve found a GND pin. Keep in mind that the device might have more than one GND pin and you might have found one that isn’t necessarily part of the UART pinout.
Continue by identifying the Vcc port. Turn the multimeter dial to the DC voltage mode in and set it up to 20 V of voltage. Keep the multimeter’s black probe on a grounded surface. Place the red probe in a suspected pad and turn on the device. If the multimeter measures a constant voltage of either 3.3 V or 5 V, you’ve found the Vcc pin. If you get other voltages, place the red probe on another port, reboot the device, and measure the voltage again. Do the same for every port until you identify Vcc.
Next, identify the TX port. Keep the multimeter mode at a DC voltage of 20 V or less, and leave the black probe in a grounded surface. Move the red probe to the suspected pad and power cycle the device. If the voltage fluctuates for a few seconds and then stabilizes at the Vcc value (either 3.3 or 5), you’ve most likely found the TX port. This behavior happens because, during bootup, the device sends serial data through that TX port for debugging purposes. Once it finishes booting, the UART line goes idle. Recall from Figure 7-1 that an idle UART line remains at a logical high, which means that it has the Vcc value.
If you’ve already identified the rest of the UART ports, the nearby fourth pin is most likely the RX port. Otherwise, you can identify it because it has the lowest voltage fluctuation and lowest overall value of all the UART pins.
To identify the UART pins more accurately, use a logic analyzer, a device that captures and displays signals from a digital system. Many kinds of logic analyzers are available. They range from cheaper ones, such as the HiLetgo or the Open Workbench Logic Sniffer, to the more professional Saleae family (Figure 7-5), which support higher sampler rates and are more robust.
We’ll walk through the process of using a logic analyzer against a target device in “Using a Logic Analyzer to Identify the UART Pins” on page 176.
Identifying the UART Baud Rate
Next, you have to identify the baud rate the UART ports use. Otherwise, you can’t communicate with the device. Given the absence of a synchronizing clock, the baud rate is the only way for the transmitter and receiver to exchange data in sync.

Figure 7-5: Saleae is a family of professional logic analyzers.
The easiest way to identify the correct baud rate is to look at the TX pin’s output and try to read the data. If the data you receive isn’t readable, switch to the next possible baud rate until the data becomes readable. You can use a USB-to-serial adapter or a multipurpose device like Bus Pirate to do this, paired with a helper script, such as baudrate.py (https://github.com/devttys0/baudrate/) by Craig Heffner, to help automate this process. The most common baud rates are 9600, 38400, 19200, 57600, and 115200, all of which Heffner’s Python script tests by default.
JTAG and SWD
Like UART, the JTAG and SWD interfaces on IoT embedded devices can serve as a way to gain control of a device. In this section, we’ll cover the basics of these interfaces and how you can communicate with them. In “Hacking a Device Through UART and SWD” on page 168, we’ll walk through a detailed example of interacting with SWD.
JTAG
As manufacturers started producing smaller, denser components, testing them efficiently became harder. Engineers used to test hardware for defects using a bed of nails process, in which they placed the board on a number of fixtures arranged to mate with various parts of the board. When manufacturers began using multilayer boards and ball grid array packages, the fixtures could no longer access all nodes on the board.
JTAG solved this problem by introducing a more effective alternative to the bed of nails test: the boundary scan. The boundary scan analyzes certain circuitry, including embedded boundary-scan cells and registers for each pin. By leveraging these boundary scan cells, engineers can test that a certain point on the circuit board correctly connects to another point more easily than they could before.
Boundary Scan Commands
The JTAG standard defines specific commands for conducting boundary scans, including the following:
- BYPASS allows you to test a specific chip without the overhead of passing through other chips.
- SAMPLE/PRELOAD takes a sample of the data entering and leaving the device when it’s in its normal functioning mode.
- EXTEST sets and reads pin states.
The device must support these commands to be considered JTAG compliant. Devices might also support optional commands, like IDCODE (for identifying a device) and INTEST (for the internal testing of the device), among others. You might come across these instructions when you use a tool like the JTAGulator (described later in "Identifying JTAG pins" on page 166) for identifying JTAG pins.
The Test Access Port
Boundary scans include tests of the four-wire Test Access Port (TAP), a general-purpose port that provides access to the JTAG test support functions built into a component. It uses a 16-stage finite state machine that moves from state to state. Note that JTAG doesn’t define any protocol for the data coming in or out of the chip.
TAP uses the following five signals:
- Test clock input (TCK) The TCK is the clock that defines how often the TAP controller will take a single action (in other words, jump to the next state in the state machine). The clock’s speed isn’t specified by the JTAG standard. The device performing the JTAG test can determine it.
- Test mode select (TMS) input TMS controls the finite state machine. On each beat of the clock, the device’s JTAG TAP controller checks the voltage on the TMS pin. If the voltage is below a certain threshold, the signal is considered low and interpreted as 0, whereas if the voltage is above a certain threshold, the signal is considered high and interpreted as 1.
- Test data input (TDI) TDI is the pin that sends data into the chip through the scan cells. Each vendor is responsible for defining the communication protocol over this pin, because JTAG doesn’t define this. The signal presented at TDI is sampled on the rising edge of TCK.
- Test data output (TDO) TDO is the pin that sends data out of the chip. According to the standard, changes in the state of the signal driven through TDO should occur only on the falling edge of TCK.
- Test reset (TRST) input The optional TRST resets the finite state machine to a known good state. It’s active on low (0). Alternatively, if the TMS is held at 1 for five consecutive clock cycles, it invokes a reset, the same way the TRST pin would, which is why TRST is optional.
How SWD Works
SWD is a two-pin electrical interface that works very similarly to JTAG. Whereas JTAG was made primarily for chip and board testing, SWD is an ARM-specific protocol designed for debugging. Given the large prevalence of ARM processors in the IoT world, SWD has become increasingly important. If you find an SWD interface, you can almost always gain complete control of the device.
The SWD interface requires two pins: a bidirectional SWDIO signal, which is the equivalent of JTAG’s TDI and TDO pins and a clock, and SWCLK, which is the equivalent of TCK in JTAG. Many devices support the Serial Wire or JTAG Debug Port (SWJ-DP), a combined JTAG and SWD interface that enables you to connect either a SWD or JTAG probe to the target.
Hardware Tools for Communicating with JTAG and SWD
A variety of tools allow us to communicate with JTAG and SWD. Popular tools include the Bus Blaster FT2232H chip, as well as any tool with the FT232H chip, such as the Adafruit FT232H breakout board, the Shikra, or the Attify Badge. The Bus Pirate can also support JTAG if you load it with special firmware, but we don’t recommend using that functionality because it can be unstable. The Black Magic Probe, a specialized tool for JTAG and SWD hacking, has built-in GNU Debugger (GDB) support, which is useful because you won’t need intermediary programs like the Open On-Chip Debugger (OpenOCD) (discussed in “Installing OpenOCD” on page 171). A professional debugging tool, the Segger J-Link Debug Probe supports JTAG, SWD, and even SPI, and it comes with proprietary software. If you want to communicate with SWD only, you can use a tool like the ST-Link programmer, which we’ll use later in this chapter in “Hacking a Device Through UART and SWD” on page 168.
You can find additional tools, their descriptions, and links in “Tools for IoT Hacking.”
Identifying JTAG Pins
Sometimes a PCB has markings indicating the location of a JTAG header (Figure 7-6). But most times you’ll have to manually identify the header, as well as which pins correspond to the four signals (TDI, TDO, TCK, and TMS).
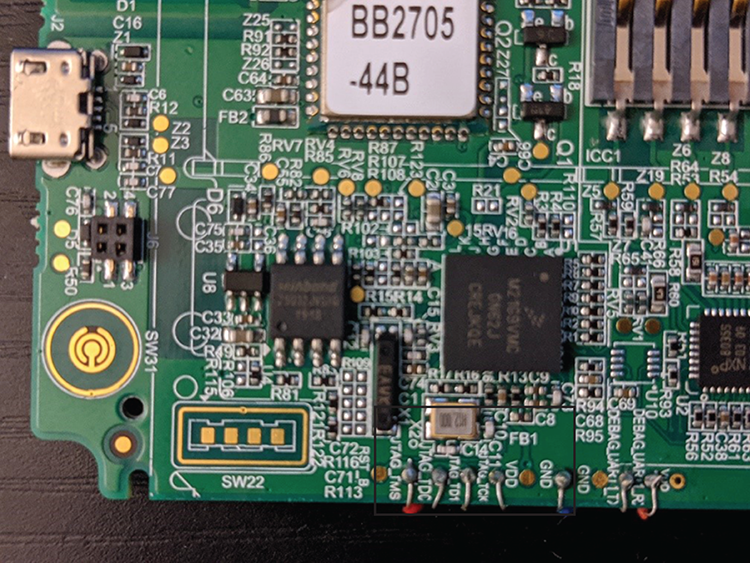
Figure 7-6: Sometimes the JTAG header is clearly marked on the PCB, as in this mobile Point of Sale (POS) device, where even the individual JTAG pins are labeled (TMS, TDO, TDI, TCK).
You can take several approaches to identify JTAG pins on a target device. The fastest but most expensive way to detect JTAG ports is by using the JTAGulator, a device created specifically for this purpose (although it can also detect UART pinouts). The tool, shown in Figure 7-7, has 24 channels that you can connect to a board’s pins. It performs a brute force of these pins by issuing the IDCODE and BYPASS boundary scan commands to every permutation of pins and waits for a response. If it receives a response, it displays the channel corresponding to each JTAG signal, allowing you to identify the JTAG pinout.

Figure 7-7: The JTAGulator (http://www.grandideastudio.com/jtagulator/) can help you identify JTAG pins on a target device.
To use the JTAGulator, connect it to your computer with a USB cable and then communicate with it over serial (for example, using the screen utility on Linux). You’ll see an example of interfacing over serial later in this chapter in “Connecting the USB to a Serial Adapter” on page 178. You can watch a demonstration of the JTAGulator by its creator, Joe Grand, at https://www.youtube.com/watch?v=uVIsbXzQOIU/.
A cheaper but much slower way of identifying JTAG pinouts is by using the JTAGenum utility (https://github.com/cyphunk/JTAGenum/) loaded on an Arduino-compatible microcontroller, like the STM32F103 blue and black pill devices we’ll attack later in this chapter in “Hacking a Device Through UART and SWD” on page 168. Using JTAGenum, you’d first define the pins of the probing device that you’ll use for the enumeration. For example, for the STM32 blue pill, we’ve selected the following pins (but you can change them):
#elif defined(STM32)       // STM32 bluepill,
 byte       pins[] = {  10 ,  11 ,  12 ,  13 ,  14 ,  15 ,  16 ,  17, 18 , 19 , 21 , 22  };
You’d have to reference the device’s pinout diagram, and then connect these pins with the test points on your target device. Then you’ll have to flash the JTAGenum Arduino code (https://github.com/cyphunk/JTAGenum/blob/master/JTAGenum.ino/) on the device and communicate with it over serial (the s command will scan for JTAG combinations).
A third way to identify JTAG pins is by inspecting the PCB for one of the pinouts shown in Figure 7-8. In some cases, PCBs might conveniently provide the Tag-Connect interface, which is a clear indication that the board has a JTAG connector, too. You can see what that interface looks like at https://www.tag-connect.com/info/. Additionally, inspecting the datasheets of the chipsets on the PCB might reveal pinout diagrams that point to JTAG interfaces.
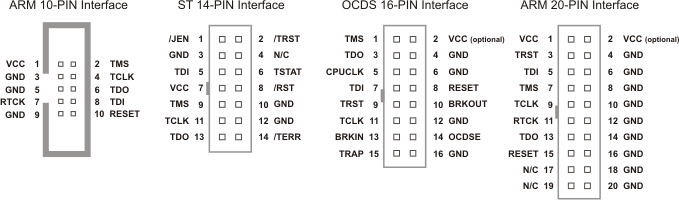
Figure 7-8: Finding any of these pin interfaces in the PCB, depending on the manufacturer (ARM, STMicroelectronics, or Infineon for OCDS), would be a good indication that you’re dealing with a JTAG connector.
Hacking a Device Through UART and SWD
In this section, we’ll exploit a microcontroller’s UART and SWD ports to retrieve the device memory and bypass the flashed program’s authentication routine. To attack the device, we’ll use two tools: a mini ST-Link programmer and a USB-to-serial adapter.
The mini ST-Link programmer (Figure 7-9) lets us interact with our target device through SWD.
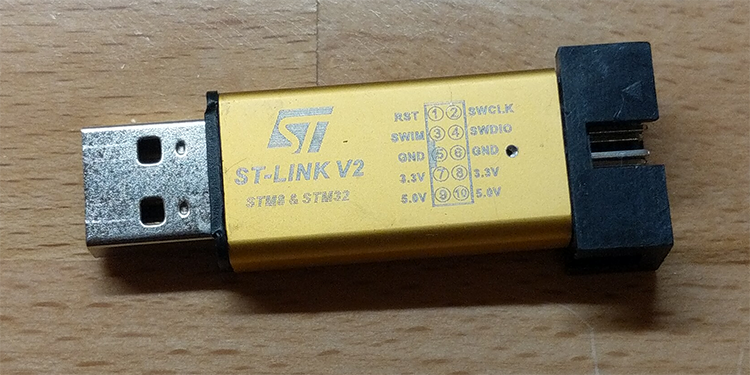
Figure 7-9: The mini ST-Link V2 programmer lets us interact with STM32 cores through SWD.
The USB-to-serial adapter (Figure 7-10) lets us communicate with the device’s UART pins through our computer’s USB port. This adapter is a transistor-transistor logic (TTL) device, which means it uses currents of 0 and 5 volts to represent the values 0 and 1, respectively. Many adapters use the FT232R chip, and you can easily find one if you search for USB-to-serial adapters online.

Figure 7-10: A USB-to-serial (TTL) adapter. This one can also switch between 5 V and 3.3 V.
You’ll need a minimum of ten jumper wires to connect the devices by their pins. We also recommend getting a breadboard, which is a construction base that you can use to hold the black pill steady. You should be able to purchase these hardware components online. We specifically selected the components used here because they’re easy to find and inexpensive. But if you wanted an alternative to the ST-Link programmer, you could use the Bus Blaster, and as an alternative to the USB-to-serial adapter, you could use the Bus Pirate.
As for the software, we’ll use Arduino to code the authentication program we’ll attack; we’ll use OpenOCD with GDB for debugging. The following sections show you how to set up this testing and debugging environment.
The STM32F103C8T6 (Black Pill) Target Device
The STM32F103xx is a very popular, inexpensive microcontroller family used in a large variety of applications in the industrial, medical, and consumer markets. It has an ARM Cortex-M3 32-bit RISC core operating at 72 MHz frequency, a flash memory of up to 1MB, static random-access memory (SRAM) of up to 96KB, and an extensive range of I/Os and peripherals.
The two versions of this device are known as the blue pill and the black pill (based on the board’s color). We’ll use the black pill (STM32F103C8T6) as our target device. The main difference between the two versions is that the black pill consumes less energy and is sturdier than the blue pill. You can easily order it online. We recommend getting a board that has presoldered headers and the Arduino bootloader flashed. That way, you won’t have to solder the headers and you’ll be able to use the device directly through USB. But in this exercise, we’ll show you how to load a program to the black pill without the Arduino bootloader.
Figure 7-11 shows the device’s pinout diagram. Notice that although some pins are 5 V-resistant, others aren’t; so we’ll have to send them no more than 3.3 V. If you’re interested in learning more about the internals of the STM32 microcontroller in general, you can find a very good reference at https://legacy.cs.indiana.edu/~geobrown/book.pdf.
Make sure you don’t connect any 5 V output to any of the black pill’s 3.3 V pins, or you’ll most likely burn them.

Figure 7-11: STM32F103C8T6 (black pill) pinout diagram
Setting Up the Debugging Environment
We’ll start by programming our target device using the Arduino Integrated Development Environment (IDE). The Arduino is an inexpensive, easy-to-use, open source electronics platform that lets you program microcontrollers using its Arduino programming language. Its IDE contains a text editor for writing code; a board and library manager; built-in functionality for verifying, compiling, and uploading the code to an Arduino board; and a serial monitor to display output from the hardware.
Installing the Arduino Environment
You can get the latest version of the Arduino IDE at https://www.arduino.cc/en/Main/Software/. For this demonstration, we’ll use version 1.8.9 on Ubuntu 18.04.3 LTS, but the operating system you use won’t matter. On Linux, download the package manually and follow the instructions at https://www.arduino.cc/en/guide/linux/. Alternatively, if you’re using a Debian-based distribution, such as Kali or Ubuntu, you can enter the following command in a terminal to install everything you’ll need:
# apt-get install arduinoAfter installing the IDE, download the latest Arduino STM32 core files from GitHub, install them in the hardware folder in the Arduino sketches directory, and run the udev rules installation script.
$ wget https://github.com/rogerclarkmelbourne/Arduino_STM32/archive/master.zip
$ unzip master.zip
$ cp -r Arduino_STM32-master /home/ithilgore/Arduino/hardware/
$ cd /home/ithilgore/Arduino/hardware/Arduino_STM 32-master/tools/linux
$ ./install.sh
Make sure you replace the username after /home/ with your own username.
If the hardware folder doesn’t exist, create it. To discover where the Arduino sketches are saved, run the Arduino IDE by entering arduino in a terminal or clicking the Arduino icon on your Desktop. Then click File▶Preferences and note the Sketchbook location file path. In this example, it’s /home/<ithilgore>/Arduino.
You’ll also need to install the 32-bit version of libusb-1.0 as follows because the st-link utility that comes bundled with the Arduino STM32 relies on it:
$ sudo apt-get install libusb-1.0-0:i386In addition, install the Arduino SAM boards (Cortex-M3). These are the cores for the Cortex-M3 microcontroller. Cores are low-level APIs that make specific microcontrollers compatible with your Arduino IDE. You can install these inside the Arduino IDE by clicking Tools▶Board▶Boards Manager. Then search for SAM Boards. Click Install on the Arduino SAM Boards (32-bits ARM Cortex-M3) option that should appear. We used version 1.6.12.
You can also find the latest installation instructions for Arduino STM32 at https://github.com/rogerclarkmelbourne/Arduino_STM32/wiki/Installation/.
Installing OpenOCD
OpenOCD is a free and open source testing tool that provides JTAG and SWD access through GDB to ARM, MIPS, and RISC-V systems. We’ll use it to debug the black pill. To install it in your Linux system, enter the following commands:
$ sudo apt-get install libtool autoconf texinfo libusb-dev libftdi-dev libusb-1.0
$ git clone git://git.code.sf.net/p/openocd/code openocd
$ cd openocd
$ ./bootstrap
$ ./configure --enable-maintainer-mode --disable-werror --enable-buspirate --enable-ftdi
$ make
$ sudo make install
Notice that you also install libusb-1.0, which you’ll need to enable support for Future Technology Devices International (FTDI) devices. Then compile OpenOCD from the source. This allows us to enable support for FTDI devices and the Bus Pirate tool.
To learn more about OpenOCD, consult its extensive user guide at http://openocd.org/doc/html/index.html.
Installing the GNU Debugger
GDB is a portable debugger that runs on Unix-like systems. It supports many target processors and programming languages. We’ll use GDB to remotely trace and alter the target program’s execution.
On Ubuntu, you’ll have to install the original gdb and gdb-multiarch, which extends GDB support for multiple target architectures, including ARM (the black pill’s architecture). You can do so by entering the following in a terminal:
$ sudo apt install gdb gdb-multiarchCoding a Target Program in Arduino
Now we’ll write a program in Arduino that we’ll load onto the black pill and target for exploitation. In an actual test, you might not have access to the device’s source code, but we’re showing it to you for two reasons. First, you’ll learn how Arduino code gets translated to a binary that you can upload onto the device. Second, when we perform debugging with OpenOCD and GDB, you’ll get to see how the assembly code corresponds to the original source code.
The program (Listing 7-1) uses the serial interface to send and receive data. It emulates an authentication process by checking for a password. If it receives the right password from the user, it prints ACCESS GRANTED. Otherwise, it keeps prompting the user to log in.
const byte bufsiz = 32; 1
char buf[bufsiz];
boolean new_data = false;
boolean start = true;
void setup() { 2
delay(3000);
Serial1.begin(9600);
}
void loop() { 3
if (start == true) {
Serial1.print("Login: ");
start = false;
}
recv_data();
if (new_data == true)
validate();
}
void recv_data() { 4
static byte i = 0;
static char last_char;
char end1 = '
';
char end2 = '
';
char rc;
while (Serial1.available() > 0 && new_data == false) { 5
rc = Serial1.read();
// skip next character if previous one was
or
and this one is
or
if ((rc == end1 || rc == end2) && (last_char == end2 || last_char == end1)) 6
return;
last_char = rc;
if (rc != end1 && rc != end2) { 7
buf[i++] = rc;
if (i >= bufsiz)
i = bufsiz - 1;
} else { 8
buf[i] = '�'; // terminate the string
i = 0;
new_data = true;
}
}
}
void validate() { 9
Serial1.println(buf);
new_data = false;
if (strcmp(buf, "sock-raw.org") == 0) a
Serial1.println("ACCESS GRANTED");
else {
Serial1.println("Access Denied.");
Serial1.print("Login: ");
}
}Listing 7-1: A serial communication program in Arduino for the STM32F103 chip
We begin by defining four global variables 1. The bufsiz variable holds the number of bytes for the character array buf,which stores the bytes coming through the serial port from the user or device interacting with the port. The new_data variable is a boolean that becomes true every time the main program loop receives a new line of serial data. The boolean variable start is true only upon the first iteration of the main loop, so it prints the first “Login” prompt.
The setup() function 2 is a built-in Arduino function that gets executed once when the program initializes. Inside this function, we initialize the serial interface (Serial1.begin) witha baud rate of 9600 bits per second. Note that Serial1 is different from Serial, Serial2, and Serial3, each of which corresponds to different UART pins on the black pill. The object Serial1 corresponds to pins A9 and A10.
The loop() function 3 is another built-in Arduino function that gets called automatically after setup(), looping consecutively and executing the main program. It continuously calls recv_data(), which is responsible for receiving and validating serial data. When the program has finished receiving all bytes (which happens when new_data becomes true), loop() calls validate(), which checks whether the received bytes constitute the correct passphrase.
The recv_data() function 4 begins by defining two static variables (which means their value will be retained between every call of this function): i for iterating through the buf array and last_char for storing the last character we read from the serial port. The while loop 5 checks whether there are any bytes available for reading from the serial port (through Serial1.available), reads the next available byte with Serial1.read,and checks whether the previously stored character (which is held in last_char) is a carriage return ‘
’ or new line ‘
’ 6. It does that so it can deal with devices that send a carriage return, new line, or both to terminate their lines when they send serial data. If the next byte doesn’t indicate the end of the line 7, we store the newly read byte rc in buf and increment the i counter by one. If i reaches the end of the buffer length, the program no longer stores any new bytes in the buffer. If the read byte signifies the end of the line 8, meaning the user on the serial interface most likely pressed ENTER, we null terminate the string in the array, reset the i counter, and set new_data to true.
In that case, we call the validate() function 9, which prints the received line and compares it with the correct password a. If the password is correct, it prints ACCESS GRANTED. Otherwise, it prints Access Denied and prompts the user to try logging in again.
Flashing and Running the Arduino Program
Now upload the Arduino program to the black pill. This process varies slightly depending on whether or not you purchased the black pill with the Arduino bootloader preflashed, but we’ll walk through both methods. You could also upload the program using a third method: a serial adapter, which allows you to flash your own bootloader (such as https://github.com/rogerclarkmelbourne/STM32duino-bootloader/), but we won’t cover this process here; you’ll find multiple resources online for doing this.
Either way, we’ll use the ST-Link programmer and write the program to the main flash memory. Alternatively, you could write it to the embedded SRAM if you encounter any problems with writing it to flash. The main problem with that approach is that you’ll have to reupload the Arduino program every time you power cycle the device, because the SRAM content is volatile, which means it gets lost every time you power off the device.
Selecting the Boot Mode
To make sure you upload the program to the black pill’s flash memory, you’ll have to select the correct boot mode. STM32F10xxx devices have three different boot modes, which you can choose from using the BOOT1 and BOOT0 pins, as shown in Table 7-1. Reference the pinout diagram in Figure 7-11 to locate these two pins on the black pill.
Table 7-1: Boot Modes for the Black Pill and Other STM32F10xxx Microcontrollers
| Boot mode selection pins | Boot mode | Aliasing | |
| BOOT1 | BOOT0 | ||
| x | 0 | Main flash memory | Selects the main flash memory as the boot space |
| 0 | 1 | System memory | Selects the system memory as the boot space |
| 1 | 1 | Embedded SRAM | Selects the embedded SRAM as the boot space |
Use the jumper pin that comes with the black pill to select the boot mode. A jumper pin is a set of small pins in a plastic box that creates an electrical connection between two pin headers (Figure 7-12). You can use the jumper pin to connect the boot mode selection pins to VDD (logical 1) or GND (logical 0).

Figure 7-12: A jumper pin, also known as a jumper shunt or shunt
Connect the jumper pin for both BOOT0 and BOOT1 of the black pill to the GND. If you wanted to write to SRAM, you would connect both to VDD.
Uploading the Program
To upload the program, first, make sure the jumpers for BOOT0 and BOOT1 are connected to the GND. Create a new file in the Arduino IDE, copy and paste the code from Listing 7-1 into it, and then save the file. We used the name serial-simple. Click Tools▶Board and select Generic STM32F103C series in the STM32F1 Boards section. Next, click Tools▶Variant and select STM32F103C8 (20k RAM, 64k Flash), which should be the default option. Check that Tools▶Upload method is set to STLink and, ideally, that Optimize is set to Debug (-g). This ensures that debug symbols appear in the final binary. Leave the rest of the options as-is.
If the black pill has the Arduino bootloader flashed, you can directly connect it to your computer via the USB cable without the ST-Link programmer. Then set the Upload method to STM32duino bootloader instead of STLink. But for learning purposes, we’ll use the ST-Link programmer, so you don’t need the bootloader preflashed.
To upload the program to the black pill, connect the ST-Link programmer to it. Use four jumper wires to link the SWCLK, SWDIO, GND, and 3.3 V pins of the ST-Link to the CLK, DIO, GND, 3.3 V pins of the black pill, respectively. These pins are located on the bottom part of the black pill’s pin header. Reference Figure 7-14 and Figure 7-15 to see what this looks like.
Using a Logic Analyzer to Identify the UART Pins
Next, identify the UART pins on the device. We showed you how to do this with a multimeter earlier in this chapter, but now we’ll use a logic analyzer to identify a UART TX pin. A TX pin transmits output, so it’s easy to recognize. You can use an inexpensive HiLetgo USB logic analyzer with eight channels for this exercise, because it’s compatible with the Saleae Logic software we’ll use. Download that software for your operating system from https://saleae.com/downloads/. (We used the Linux version in this example.) Then unzip the bundle to a local folder, browse to it in a terminal, and enter the following:
$ sudo ./LogicThis command will open Saleae Logic’s graphic interface. Leave it open for now.
Make sure any system you’re testing is powered off when you connect the logic analyzer’s probes to it to avoid short-circuiting. In this case, because the black pill is powered by the ST-Link programmer, temporarily disconnect the programmer from your computer’s USB port. Remember that if you power off the black pill after uploading the Arduino code to the SRAM instead of the flash, you’ll have to reupload the code to the black pill.
Use a jumper wire to connect one of your logic analyzer’s GND pins to one of the black pill’s GND pins so they share a common ground. Next, use two more jumper wires to connect the logic analyzer’s CH0 and CH1 channels (all channel pins should be labeled) to the black pill’s A9 and A10 pins. Connect the logic analyzer to a USB port on your computer.
In the Saleae interface, you should see at least a couple of channels in the left pane, each of which corresponds to one of the logic analyzer’s channel pins. You can always add more channels, if your logic analyzer supports them, so you can sample more pins at the same time. Add them by clicking the two arrows next to the green Start button to open the settings. You can then select how many channels you want to display by toggling the number next to each channel.
In the settings, change the Speed (Sample Rate) to 50 kS/s and the Duration to 20 seconds. As a rule, you should sample digital signals at least four times faster than their bandwidth. With serial communications, which are generally very slow, a 50 kS/s sampling rate is more than enough, although sampling faster than this does no harm. As for the duration, 20 seconds is enough time for the device to power on and start transmitting data.
Click the Start button to begin capturing the signals and immediately power on the black pill by connecting the ST-Link programmer to a USB port. The session will last for 20 seconds, but you can stop it at any time before then. If you don’t see any data on the channels, try power cycling the black pill while the session is on. At some point, you should see a signal coming from the channel corresponding to the A9 (TX) pin. Zoom in or out using your mouse wheel to inspect it more clearly.
To decode the data, click the + beside Analyzers in the Graphical User Interface (GUI)’s right pane, select Async Serial, choose the channel on which you’re reading the signal, and set the Bit Rate to 9600. (The bit rate in this case is the same as the baud rate.) Note that when you don’t know the bit rate, you can select Use Autobaud and let the software work its magic to detect the right one. You should now see the Login: prompt from the Arduino program as a series of UART packets in the signal you just captured (Figure 7-13).
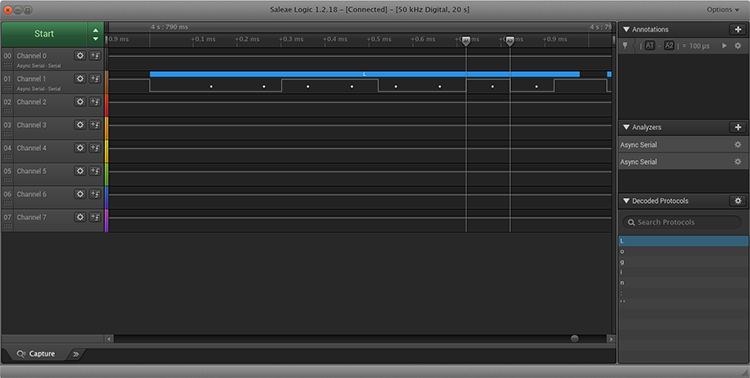
Figure 7-13: Decoding the UART data coming from the black pill’s TX pin using the Saleae Logic software. In the bottom right, you can see the Login: prompt that the Arduino program runs when the device boots.
Notice in Figure 7-13 how the device sends the letter “L,” which indicates the beginning of the login message. The communication starts with an idle line (at a logical 1 value). The black pill then sends a start bit with a logical 0 value, followed by the data bits, from least to most significant. In ASCII, the letter L is 0x4C, or 00110010 in binary, as you can see in the transmission. Finally, the black pill sends a stop bit (with a logical 1 value), before beginning the letter “o.”
We placed two timing markers (A1 and A2 in Figure 7-13) on either side of one random bit. Timing markers are annotations that you can use to measure the time elapsed between any two locations in your data. We measured a duration of 100 μs, which proves that the transmission has a baud rate of 9600 bits/sec. (One bit takes 1/9600 seconds to transmit, or 0.000104 seconds, which is roughly 100 μs.)
Connecting the USB to a Serial Adapter
To test the USB-to-serial adapter, let’s connect it to our computer. Some USB-to-serial adapters, including the one we used, come with a jumper pin preinstalled on the RX and TX pins (Figure 7-12). The jumper pin will short-circuit the RX and TX pin headers, creating a loop between them. This is useful for testing that the adapter works: connect it to your computer’s USB port and then open a terminal emulator program, such as screen or minicom, to that port. Try using the terminal emulator to send serial data to the connected devices. If you see the keystrokes echoed in the terminal, you know the adapter works. The reason is that your keyboard sends characters through the USB port to the adapter’s TX pin; because of the jumper, the characters get sent to the RX pin and then returned to the computer through the USB port.
Plug the adapter into your computer with the jumper pin in place, and then enter the following command to see which device file descriptor it was assigned to:
$ sudo dmesg
…
usb 1-2.1: FTDI USB Serial Device converter now attached to ttyUSB0
Typically, it will be assigned to /dev/ttyUSB0 if you don’t have any other peripheral devices attached. Then start screen and pass it the file descriptor as an argument:
$ screen /dev/ttyUSB0To exit the screen session, press CTRL-A followed by .
You can also provide the baud rate as a second argument. To find the current baud rate of the adapter, enter the following:
$ stty -F /dev/ttyUSB0
speed 9600 baud; line =0;
…
This output shows that the adapter has a baud speed of 9600.
Verify that the adapter is working and then remove the jumper pin, because we’ll need to connect the RX and TX pins to the black pill. Figure 7-14 shows the connections you have to make.
Connect the adapter’s RX pin to a TX pin on the black pill (pin A9, in this case). Then connect the adapter’s TX pin to the black pill’s RX pin (A10). Using A9 and A10 is important, because these pins correspond to the Serial1 interface we used in the Arduino code.
The USB-to-serial adapter must have the same GND as the black pill, because the devices use GND as a point of reference for voltage levels. The Clear to Send (CTS) pin should be set to GND as well, because it’s considered active when low (meaning at a logic level of 0). If it weren’t connected to GND, it would float high, indicating that the adapter isn’t clear to send bytes to the black pill.

Figure 7-14: Pin connections between the black pill, ST-Link, USB-to-serial adapter, and laptop
Connecting to a Computer
Once you’ve connected the black pill, ST-Link, and USB-to-serial adapter, connect the ST-Link to a USB port on your computer. Then connect the adapter to a USB port. Figure 7-15 shows an example setup.
Now that the setup is ready, return to the Arduino IDE. Enable verbose output by clicking File▶Preferences and selecting the Show verbose output during: compilation checkbox. Then click Sketch▶Upload to compile the program and upload it to the black pill.
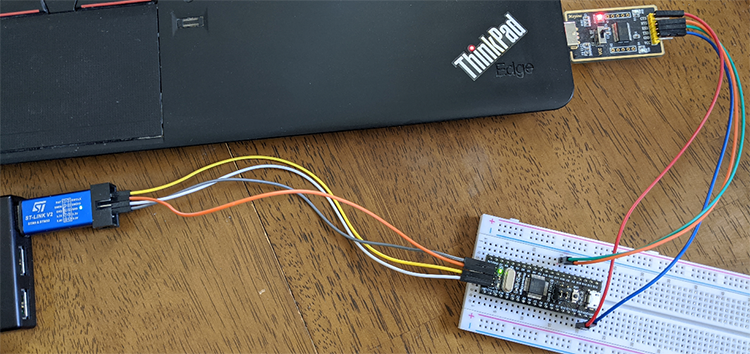
Figure 7-15: The black pill, ST-Link programmer, and USB-to-serial adapter are connected using jumper wires. Note that the black pill isn’t connected to any USB port; the ST-Link programmer powers it.
Because we enabled verbose output in the Arduino IDE, compiling and uploading the program should give you a lot of information about the process, including a temporary directory that stores the intermediate files necessary for compilation (Figure 7-16).

Figure 7-16: Verbose output from Arduino IDE when compiling and uploading the program. Highlighted is the temporary directory you’ll need.
On Linux, this directory typically looks like /tmp/arduino_build_336697, where the last number is a random identifier (yours will obviously be different) that changes with new builds. When you compile your program, take note of this directory, because you’ll need it later.
At this point, open the serial monitor console by clicking Tools▶Serial Monitor. The Serial Monitor is a pop-up window that can send and receive UART data to and from the black pill. It has similar functionality to screen, used earlier, but it’s built into the Arduino IDE for convenience. Click Tools▶Port to make sure you’ve selected the USB port to which your USB-to-serial adapter is connected. Check that the Serial Monitor’s baud rate is 9600, like we specified in the code. You should then see the Login: prompt from our Arduino program. Enter some sample text to test the program. Figure 7-17 shows a sample session.
If you enter anything other than sock-raw.org, you should get the Access Denied message. Otherwise, you should get the ACCESS GRANTED message.
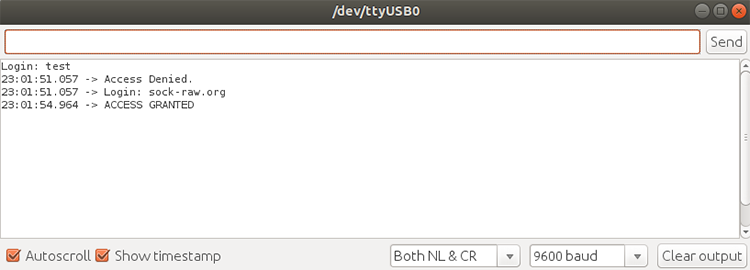
Figure 7-17: The Serial Monitor pop-up window in the Arduino IDE
Debugging the Target
Now it’s time for the main exercise: debugging and hacking the black pill. If you followed all of the previous steps, you should have a fully working debugging environment and the black pill should contain the Arduino program we wrote.
We’ll use OpenOCD to communicate with the black pill using SWD through the ST-Link programmer. We’ll leverage that connection to open a remote debugging session with GDB. Then, using GDB, we’ll walk through the program’s instructions and bypass its authentication check.
Running an OpenOCD Server
We’ll start OpenOCD as a server. We need OpenOCD to communicate with the black pill through SWD. To run it against the black pill’s STM32F103 core using the ST-Link, we have to specify the two relevant configuration files using the -f switch:
$ sudo openocd -f /usr/local/share/openocd/scripts/interface/stlink.cfg -f /usr/local/share/openocd/scripts/targets/stm32f1x.cfg
 [sudo] password for ithilgore:
Open On-Chip Debugger 0.10.0+dev-00936-g0a13ca1a (2019-10-06-12:35)
Licensed under GNU GPL v2
For bug reports, read
	http://openocd.org/doc/doxygen/bugs.html
Info : auto-selecting first available session transport "hla_swd". To override use 'transport select <transport>'.
Info : The selected transport took over low-level target control. The results might differ compared to plain JTAG/SWD
Info : Listening on port 6666 for tcl connections
Info : Listening on port 4444 for telnet connections
Info : clock speed 1000 kHz
Info : STLINK V2J31S7 (API v2) VID:PID 0483:3748
Info : Target voltage: 3.218073
Info : stm32f1x.cpu: hardware has 6 breakpoints, 4 watchpoints
Info : Listening on port 3333 for gdb connections
These configuration files help OpenOCD understand how to interact with the devices using JTAG and SWD. If you installed OpenOCD from source, as described earlier, these configuration files should be in /usr/local/share/openocd. When you run the command, OpenOCD will start accepting local Telnet connections on TCP port 4444 and GDB connections on TCP port 3333.
At this point, we’ll connect to the OpenOCD session with Telnet and begin issuing some commands to the black pill over SWD. In another terminal, enter the following:
$ telnet localhost 4444
Trying 127.0.0.1...
Connected to localhost.
Escape character is '^]'.
Open On-Chip Debugger
> 1reset init
target halted due to debug-request, current mode: Thread
xPSR: 0x01000000 pc: 0x08000538 msp: 0x20005000
> 2halt
> 3flash banks
#0 : stm32f1x.flash (stm32f1x) at 0x08000000, size 0x00000000, buswidth 0, chipwidth 0
> 4mdw 0x08000000 0x20
0x08000000: 20005000 08000539 080009b1 080009b5 080009b9 080009bd 080009c1 08000e15
0x08000020: 08000e15 08000e15 08000e15 08000e15 08000e15 08000e15 08000e15 08000e35
0x08000040: 08000e15 08000e15 08000e15 08000e15 08000e15 08000e15 08000a11 08000a35
0x08000060: 08000a59 08000a7d 08000aa1 080008f1 08000909 08000921 0800093d 08000959
> 5dump_image firmware-serial.bin 0x08000000 17812
dumped 17812 bytes in 0.283650s (61.971 KiB/s)
The reset init command 1 halts the target and performs a hard reset, executing the reset-init script that is associated with the target device. This script is an event handler that performs tasks like setting up clocks and JTAG clock rates. You can find examples of these handlers if you inspect the openocd/scripts/targets/directory’s .cfg files. The halt command 2 sends a halt request for the target to halt and enter debug mode. The flash banks command 3 prints a one-line summary of each flash memory area that was specified in the OpenOCD .cfg file (in this case, stm32f1x.cfg). It printed the black pill’s main flash memory, which starts at the address 0x08000000.This step is important, because it can help you identify which segment of memory to dump firmware from.Note that sometimes the size value isn’t reported correctly. Consulting the datasheets remains the best resource for this step.
We then send the 32-bit memory access command mdw 4, starting at that address, to read and display the first 32 bytes of flash memory. Finally, we dump the target’s memory from that address for 17812 bytes and save it into a file named firmware-serial.bin in our computer’s local directory 5. We got the number 17812 by inspecting the size of the Arduino program file loaded in the flash memory. To do this, issue the following command from the temporary Arduino build directory:
/tmp/arduino_build_336697 $ stat -c '%s' serial-simple.ino.bin
17812
You can then use tools like colordiff and xxd to see whether there are any differences between the firmware-serial.bin file that we dumped from the flash memory and the serial-simple.ino.bin file that we uploaded through the Arduino IDE. If you dumped the exact number of bytes as the size of the Arduino program, there should be no differences in the output of colordiff:
$ sudo apt install colordiff xxd
$ colordiff -y <(xxd serial-simple.ino.bin) <(xxd firmware-serial.bin) | less
We recommend you experiment with more OpenOCD commands; they’re all documented on its website. One useful command to try is the following:
> flash write_image erase custom_firmware.bin 0x08000000You can use it to flash new firmware.
Debugging with GDB
Let’s debug and alter the execution flow of the Arduino program using GDB. With the OpenOCD server already running, we can start a remote GDB session. To help us, we’ll use the Executable and Linkable Format (ELF) file created during the Arduino program compilation. The ELF file format is the standard file format for executable files, object code, shared libraries, and core dumps in Unix-like systems. In this case, it acts as an intermediate file during compilation.
Browse to the temporary directory returned during compilation. Make sure you change the random number part of the directory name to the one that you got from your own Arduino compilation. Then, assuming your Arduino program was named serial-simple, start a remote GDB session using gdb-multiarch with the arguments shown here:
$ cd /tmp/arduino_build_336697/
$ gdb-multiarch -q --eval-command="target remote localhost:3333" serial-simple.ino.elf
Reading symbols from serial-simple.ino.elf...done.
Remote debugging using localhost:3333
0x08000232 in loop () at /home/ithilgore/Arduino/serial-simple/serial-simple.ino:15
15       if (start == true) {
(gdb)
This command will open the GDB session and use the local ELF binary file (called serial-simple.ino.elf) created by Arduino during compilation for debug symbols. Debug symbols are primitive data types that allow debuggers to gain access to information, such as variables and function names, from the binary’s source code.
In that terminal, you can now issue GDB commands. Start by entering the info functions command to verify that the symbols have indeed been loaded:
(gdb) info functions
All defined functions:

File /home/ithilgore/Arduino/hardware/Arduino_STM32-master/STM32F1/cores/maple/HardwareSerial.cpp:
HardwareSerial *HardwareSerial::HardwareSerial(usart_dev*, unsigned char, unsigned char);
int HardwareSerial::available();
…
File /home/ithilgore/Arduino/serial-simple/serial-simple.ino:
void loop();
void recv_data();
void setup();
void validate();
…
Now let’s place a breakpoint on the validate() function, because the name implies that it does some sort of checking, which might be related to authentication.
(gdb) break validate
Breakpoint 1 at 0x800015c: file /home/ithilgore/Arduino/serial-simple/serial-simple.ino, line 55.
Because the debugging information recorded in the ELF binary informs GDB about what source files were used to build it, we can use the list command to print parts of the program’s source. You’ll rarely have this convenience in real reverse engineering scenarios, where you’ll have to rely on the disassemble command, which shows the assembly code instead. Here is the output of both commands:
 (gdb) list validate,
55     void validate() {
56       Serial1.println(buf);
57       new_data = false;
58
59       if (strcmp(buf, "sock-raw.org") == 0)
60         Serial1.println("ACCESS GRANTED");
61       else {
62         Serial1.println("Access Denied.");
63         Serial1.print("Login: ");
64       }
(gdb) disassemble validate
Dump of assembler code for function validate():
   0x0800015c <+0>: push   {r3, lr}
   0x0800015e <+2>: ldr    r1, [pc, #56] ; (0x8000198 <validate()+60>)
   0x08000160 <+4>: ldr    r0, [pc, #56] ; (0x800019c <validate()+64>)
   0x08000162 <+6>: bl     0x80006e4 <Print::println(char const*)>
   0x08000166 <+10>: ldr    r3, [pc, #56] ; (0x80001a0 <validate()+68>)
   0x08000168 <+12>: movs   r2, #0
   0x0800016a <+14>: ldr    r0, [pc, #44] ; (0x8000198 <validate()+60>)
   0x0800016c <+16>: ldr    r1, [pc, #52] ; (0x80001a4 <validate()+72>)
   0x0800016e <+18>: strb   r2, [r3, #0]
   0x08000170 <+20>: bl     0x8002de8 <strcmp>
   0x08000174 <+24>: cbnz   r0, 0x8000182 <validate()+38>
   0x08000176 <+26>: ldr    r0, [pc, #36] ; (0x800019c <validate()+64>)
…If you have only the assembly code, import the file (in this case serial-simple.ino.elf) into a decompiler like those that Ghidra or IDA Pro provide. This will help you tremendously, because it will translate the assembly code into C, which is much easier to read (Figure 7-18).

Figure 7-18: Using the decompiler in Ghidra to quickly read C code instead of assembly code
If you have only the hex file (for example, the firmware-serial.bin) as a result of dumping the firmware from the flash memory, you’ll first have to disassemble it using the ARM toolchain like this:
$ arm-none-eabi-objdump -D -b binary -marm -Mforce-thumb firmware-serial.bin > output.sThe output.sfile will contain the assembly code.
Next, let’s look at how we can bypass our target’s simple authentication process. Allow normal execution of the program to continue by issuing the continue command (or c for short):
(gdb) continue
Continuing.
The program is now waiting for serial input. Open the serial monitor from the Arduino IDE like we did on page 180, enter a sample password, like test123, and press ENTER. On the GDB terminal, you should see that the breakpoint for the validate function gets triggered. From then on, we’ll make GDB automatically display the next instruction to be executed each time the program stops by issuing the command display/i $pc. Then we’ll gradually step one machine instruction at a time using the stepi command until we reach the strcmp call. When we reach the Print::println call, we’ll use the next command to step over it, because it doesn’t concern us in this context (Listing 7-2).
Breakpoint 1, validate () at /home/ithilgore/Arduino/serial-simple/serial-simple.ino:55
55     void validate() {
(gdb) display/i $pc
1: x/i $pc
=> 0x800015c <validate()>:  push   {r3, lr}
(gdb) stepi
halted: PC: 0x0800015e
56         Serial1.println(buf);
3: x/i $pc
=> 0x800015e <validate()+2>:	ldr    r1, [pc, #56]	; (0x8000198 <validate()+60>)
(gdb) stepi
halted: PC: 0x08000160
0x08000160    56         Serial1.println(buf);
1: x/i $pc
=> 0x8000160 <validate()+4>:	ldr    r0, [pc, #56]	; (0x800019c <validate()+64>)
(gdb) stepi
halted: PC: 0x08000162
0x08000162    56         Serial1.println(buf);
1: x/i $pc
=> 0x8000162 <validate()+6>:	bl     0x80006e4 <Print::println(char const*)>
(gdb) next
halted: PC: 0x080006e4
57         new_data = false;
1: x/i $pc
=> 0x8000166 <validate()+10>:      ldr    r3, [pc, #56]	; (0x80001a0 <validate()+68>)
(gdb) stepi
halted: PC: 0x08000168
0x08000168    57         new_data = false;
1: x/i $pc
=> 0x8000168 <validate()+12>:      movs   r2, #0
(gdb) stepi
halted: PC: 0x0800016a
59	     if (strcmp(buf, "sock-raw.org") == 0)
1: x/i $pc
=> 0x800016a <validate()+14>:ldr    r0, [pc, #44]	; (0x8000198 <validate()+60>)
(gdb) stepi
halted: PC: 0x0800016c
0x0800016c    59         if (strcmp(buf, "sock-raw.org") == 0)
1: x/i $pc
=> 0x800016c <validate()+16>:      ldr    r1, [pc, #52]	; (0x80001a4 <validate()+72>)
(gdb) stepi
halted: PC: 0x0800016e
57          new_data = false;
1: x/i $pc
=> 0x800016e <validate()+18>:	strb	r2, [r3, #0]
(gdb) stepi
halted: PC: 0x08000170
59          if (strcmp(buf, "sock-raw.org") == 0)
1: x/i $pc
=> 0x8000170 <validate()+20>:      bl     0x8002de8 <strcmp>
(gdb) x/s $r0 1
0x200008ae <buf>:    "test123"
(gdb) x/s $r1 2
0x8003a48:    "sock-raw.org"
Listing 7-2: Stepping through our program’s validate function in GDB
The last two GDB commands (x/s $r0 1 and x/s $r1 2) display the contents of the registers r0 and r1 as strings. These registers should hold the two arguments passed to the strcmp() Arduino function, because according to the ARM Procedure Call Standard (APCS), the first four arguments of any function are passed in the first four ARM registers r0, r1, r2, r3. That means the r0 and r1 registers hold the addresses of the string test123 (which we supplied as a password) and the string of the valid password, sock-raw.org, against which it’s compared. You can display all the registers at any time in GDB by issuing the info registers command (or i r for short).
We can now bypass authentication in multiple ways. The easiest way is to set the value of r0 to sock-raw.org right before execution reaches the strcmp() call. You can easily do that by issuing the following GDB command:
set $r0=”sock-raw.org” Alternatively, if we didn’t know the correct passphrase’s string value, we could bypass the authentication by fooling the program into thinking that strcmp() had succeeded. To do that, we’ll change the return value of strcmp() right after it returns. Notice that strcmp() returns 0 if it succeeds.
We can change the return value using the cbnz command, which stands for compare and branch on non-zero. It checks the register in the left operand, and if it’s not zero, branches, or jumps, to the destination referenced in the right operand. In this case, the register is r0 and it holds the return value of strcmp():
   0x08000170 <+20>:	bl     0x8002de8 <strcmp>
   0x08000174 <+24>:	cbnz   r0, 0x8000182 <validate()+38>
Now we’ll step inside the strcmp() function by issuing another stepi when we reach it. Then we can step out of it by issuing a finish command. Immediately before the cbnz command executes, we’ll change the r0 value to 0, which indicates that strcmp() was successful:
(gdb) stepi
halted: PC: 0x08002de8
0x08002de8 in strcmp ()
3: x/i $pc
=> 0x8002de8 <strcmp>:      orr.w  r12, r0, r1

(gdb) finish
Run till exit from #0  0x08002de8 in strcmp ()
0x08000174 in validate () at /home/ithilgore/Arduino/serial-simple/serial-simple.ino:59
59	    if (strcmp(buf, "sock-raw.org") == 0)
3: x/i $pc
=> 0x8000174 <validate()+24>:      cbnz   r0, 0x8000182 <validate()+38>
(gdb) set $r0=0
(gdb) x/x $r0
0x0:   0x00
(gdb) c
Continuing.
When we do this, our program won’t branch to the memory address 0x8000182. Instead, it will continue by executing the instructions immediately after cbnz. If you now let the rest of the program run by issuing a continue command, you’ll see an ACCESS GRANTED message in the Arduino serial monitor, indicating that you successfully hacked the program!
There are even more ways to hack the program, but we’ll leave such experimentation as an exercise for you.
Conclusion
In this chapter, you learned how UART, JTAG, and SWD work and how you can exploit these protocols to gain complete access to a device. Most of the chapter walked through a practical exercise that used an STM32F103C8T6 (black pill) microcontroller as a target device. You learned how to code and flash a simple Arduino program that performs a very basic authentication routine through UART. Then you interfaced with the device using a USB-to-serial adapter. We leveraged an ST-Link programmer to access SWD on the target through OpenOCD and, finally, we used GDB to dynamically bypass the authentication function.
Exploiting UART—and especially JTAG and SWD—almost always means that you can gain complete access to the device, because these interfaces were designed to give manufacturers full debugging privileges for testing purposes. Learn how to leverage them to their fullest potential and your IoT hacking journey will become much more productive!