
Information Systems
Abstract
This part enters into the main territory of enterprise architecture for information systems which is as rich in technology specialties as the IT ecosystem is diverse. Most organizations fail to recognize the need for diverse specialization within architecture because they fail to understand the depth of complexity and the costs associated with mediocrity within each area of specialization. They also believe that a general practioner, which we will call a solution architect, is qualified and appropriate to address the complexities across a wide array of technology areas. In reality, this is equivalent to staffing a medical center primarily with general practioners that act as the specialists. A healthy organization maintains top specialists with which the general practioners can participate in getting expertise that is in alignment with a future state vision that reduces complexity and costs.
information systems architecture
technology portfolio management
organizing technologies into portfolios
enhanced technology portfolio management
stimulus-response predictive models
asymmetric massively parallel processing
Comprehensive R Archive Network
document management/content management
online transaction processing systems
relational database technology in Hadoop
relational algebraic operations
reducer size and replication rates
linear measures event modeling
relational database technology in Hadoop
data persistence layer metadata
configuration management metadata
ecosystem administrator metadata
parallel and distributed processing
reduced code set that eliminates large amounts of DBMS code
labeling images and objects within images
identifying correlations in genetic code
testing a scientific hypothesis
machine learning for problem solving (aka self-programming)
Committee of Sponsoring Organizations of the Treadway Commission
Office of Foreign Assets Control
United and Strengthening America by Providing Appropriate Tools Required to Intercept and Obstruct Terrorism
Office of Federal Contract Compliance Programs
Equal Employment Opportunity Act
Global Financial Markets Association
Regulation E of the Electronic Fund Transfer Act
Securities and Exchange Commission
Office of the Comptroller of the Currency
Commodity Futures Trading Commission
International Swaps and Derivatives Association
CFTC Interim Compliant Identifier
National Securities Clearing Corporation
Customer Identification Program
Society for the Worldwide Interbank Financial Telecommunication
records information management
Governance Risk and Compliance
application portfolio architecture
application architecture design patterns
software development life cycle
merger and acquisition life cycle
data center consolidation life cycle
corporate restructuring life cycle
populating business data glossary
business designated access rights
legal and compliance oversight
secure canned reporting data points
production to nonproduction data movement
architecture governance life cycle
analyze types of technological issues
analyze all business initiative types
postmortem architecture review
identify scope of business being divested
identify divested business capabilities
automation supporting divested capabilities
identify unstructured data of divested areas
identify business scope being acquired
identify business organization impact
analyze overlapping automation
identify development environment impact
identify IT organization impact
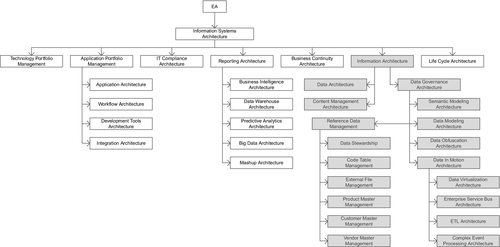
3.1 “Information Systems” Architecture and Governance
The global operating model for information systems architecture is one where there are various distinct architectural disciplines that require architectural standards, frameworks, and services to deliver the following:
■ align the many technical disciplines across IT with the strategic direction of the business,
■ provide representation of stakeholder interests across a large number of application development teams,
■ identify opportunities to executive management,
■ manage complexity across the IT landscape,
■ exploit the synergies across the various architectural disciplines of enterprise architecture,
■ optimize the return of business investment into automation,
■ act as an accelerator to the automation activities across each life cycle of the enterprise,
■ continually illustrate architecture’s return on investment.
Traditionally, information systems architecture has been simply referred to as enterprise architecture, without acknowledgment of there being a distinct set of architectural disciplines that belong to business architecture and operations architecture, or the distinction between information systems architecture and control systems architecture, or realization that there are a number of cross-discipline capabilities that span the aforementioned.
One may wonder why so many categories of architectural disciplines are valuable. After all, there are plenty of solution architects that are already assigned to application teams around the country and/or globe.
To understand this question more thoroughly, it is first important to look at the skill sets of solution architects and what their focus has been throughout their career, and what it is now.
Before the name “solution architect” came into fashion, solution architects would have been recognized the best and brightest programmer analysts and developers that implemented many of the applications within a large enterprise. Since solution architects are among the few that understand the majority of the critical application systems across the enterprise, they are valuable resources that cannot be readily replaced. In fact, it can take years to replace a typical solution architect as their accumulated knowledge of application systems is usually not documented to the extent that would be necessary to guide a substitute in a reasonable time frame.
Of the various roles across IT, solution architects have general to intermediate knowledge of many topics within technology. In fact, a typical solution architect can provide a fairly informative perspective on the widest variety of technologies of any type of resource across most any organization. So why not leverage solution architects to fill the role of enterprise architects? The answer can best be conveyed through a simple story.
A new management regime is introduced into a large enterprise. They reasonably set new business principles to leverage the economies of scale in negotiating with vendors for software licenses. They become aware of the fact that there are hundreds of different tools that are used for reporting and business intelligence (BI) purposes. However, they notice that none of these tools support the new Big Data space of technology.
A team of the top dozen solution architects from across the company are assembled, as well as two members from enterprise architecture that are subject matter experts (SMEs) in information architecture, itself an immensely vast architectural discipline.
Management proposes that a list of several Big Data technologies should be assembled for consideration to determine the best technology choice for the enterprise as a global standard.
[Rather than picking on specific vendors and products, as this is certainly not the intention of this book, we will give fictitious product names, although we will try to associate a few characteristics to them that are realistic from a high-level perspective where they are necessary to serve the purposes of this discussion.]
The team of solution architects schedule length daily meetings across a period of several months. The two enterprise architects divide their time so that only one of them has to be present for each given meeting, and they dial into the meetings when their schedule permits. It is also fair to state that the goal of the two enterprise architects is to have a good collaborative series of meetings with their architectural brethren.
Unlike the well-facilitated meetings, these meetings were loosely facilitated, often driven by who could call out the loudest. The two enterprise architects stated the importance of getting requirements from the various stakeholders, although no requirements were ever collected from any of the lines of business. To obfuscate the fact that requirements were not available, the team adopted a resolution to state to management specific phrases like, “What we are hearing from the business is that they want, or would like, to be able to do deep analytics.”
After many hours of meetings, the team elected the path that they wanted to take. It is a path that many architecture review boards commonly take, and if it is good enough for architecture review boards that make technology decisions every time they convene, then it must be an industry best practice. This is the approach where a team of generalists decide to leverage the feature list of every major product from its marketing materials, and capture it in a spreadsheet to be used as the master set of evaluation criteria.
Quite the feature list was assembled from scouring the marketing materials of the major Big Data products. In a number of cases, the features seemed to conflict with one another, particularly because some of the products had vastly different architectures, but why quibble over details. The weeks flew by.
Now that the feature list, which was being loosely used as business requirements, was assembled, the team proceeded to the next step of matching the candidate products to the master feature list to determine which products had more features than other products. However, not all products matched up to features on the basis of a clear yes or no. Some products partially had some of the features, and it had to be determined how much to award each product. More weeks flew by.
Finally, all of the products were mapped to the master feature list, with their varying degrees noted in the scoring system. However, a simple count of features that a given product had seemed somewhat unfair. Certainly, some features in this long list were more important than others, so now it had to be determined how much weight to assign each feature. More weeks flew by.
Eventually, the team had a new weighted score for each of the products. It should be noted that the weightings did not alter the relative ranking of the products, although it did bring some of them closer together in total score. Now many months later, the solution architects were quite pleased with their accomplishment, which selected the most expensive product from among the candidate products. But what did the enterprise architects think of it?
In fact, the enterprise architects could have saved 9 months off the process and countless man hours of effort because it was obvious to them that the outcome had to be the biggest, most mature, most expensive product of the bunch. It should always make sense that the most expensive product would have the most features and would have been the one that had been around the longest to build up those features. Newer products generally have to be less expensive to get market share, and they take years to accumulate a litany of features. But was the most expensive product the right choice from the perspective of a SME in information architecture?
The best choice from the perspective of the information architecture SMEs was actually the least expensive product, which ironically did not even make the top three in any of the scorings performed by the solution architects, and was summarily dismissed. However, it was less expensive by a factor of nearly 20 to 1 over a 5-year period ($5MM versus $100MM).
In fact, from a software internals perspective, it had the most efficient architecture, least complicated to install, setup and use, required less expensive personnel to manage, administer, and utilize it, with a significantly shorter time to deployment. It was also more suitable to be distributed across the many countries, many of which had medium to small data centers, and small budgets.
In all fairness to the solution architects, they played by the rules they were given. The actual recommendation from the two enterprise architects was to select two products. What we had found from being on conference calls with reference clients of the various products was that the least expensive product accomplished the job better than the most expensive one about 95% of the time. There were, however, 5% that needed some feature of the most expensive product. Clients indicated that the technology footprint for the most expensive product was therefore limited to the few areas that required those features, and that represented significant savings.
It is also fair to say that this author was very lucky to have been familiar with much of the internal design of the various products. However, it was that subject matter expertise that made it obvious early on as to which product a SME in the architectural discipline of database technology would select.
The point we make is a simple one. There is a benefit to having an SME in any of the architectural disciplines that represent areas of technology that are either already in use or will be in use across the IT landscape. Enterprise architects are SMEs in one or more particular areas of technology, as compared to a solution architect who is an expert in one or more applications and a generalist in the many technologies that those applications use.
Still another area of benefit has to do with the various corporate stakeholders from across the organization. These include the heads of departments such as Legal, Compliance, Auditing, and Chief Customer Officer, as well as external stakeholders such as outsourcing partners, customers, investors and regulators.
Since it is unrealistic to expect each stakeholder to interact with many solution architects, not to mention the fact that they may all have different interpretations of the various stakeholder interests, it is up to the few enterprise architects to incorporate the interests of the various stakeholders into the standards and frameworks of the architectural discipline in which they are an SME.
Equally as important, there are valuable synergies among architectural disciplines that offer opportunities of incorporating improved standards and frameworks that materialize simply from having enterprise architects who are SMEs in their respective discipline explain their disciplines to and collaborate with one another. This leads to added data security and data privacy benefits, such as easy and automatic data masking for ad hoc reporting.
Therefore, in the modern information systems architecture, technology challenges are addressed by instantiating the architectural disciplines that correspond to the areas of technology in use, or are planned to be in use, around the globe. Although the number of pertinent architectural disciplines for any company will vary, approximately 30 disciplines form a basic set that we discuss below. In addition, the specific architectural disciplines that may need to be instantiated at a given point in time can vary depending upon the technologies in use and the activities that are in progress or soon to start across the enterprise.
The operating model for information systems architecture is one where the expert defines the scope of their architectural discipline, and then identifies the hedgehog principle that drives the particular discipline, and a small number of additional metrics-driven principles that provide the ability to measure efficacy of the architectural discipline across the IT landscape.
Each SME must also determine the current state, future state, and a transition plan to get from the current state to the future state. Each SME must also present their discipline to their peers of SMEs for the other architectural disciplines. Each SME would identify the standards and frameworks that they propose and why, develop and refine these artifacts, and then mentor local governance boards, solution architects, and application development teams across the IT community.
Although this will be addressed in more detail later, local governance boards, solution architects, and application development teams should jointly participate in a process that determines whether designs and implementations are in compliance with the standards and frameworks, and to request exceptions, as well as a process to escalate requests for exceptions when it is believed that the exception should have been granted and/or the standard changed.
That said, even though architectural standards would be developed with the objective of controlling costs across the enterprise, there must still be a process in place to request exceptions to evaluate opportunities for improvement. If an exception does not violate the interests of another stakeholder and is clearly advantageous cost-wise over the potential life of the design, then the exception should be approved. Likewise, if the standard can be improved to better control costs or protect the interests of stakeholders across the enterprise, then the process to update the standard should be engaged.
We will now discuss a set of candidate architectural disciplines to be evaluated for inclusion into a modern information systems architecture practice.
3.1.1 Technology Portfolio Management
Technology portfolio management (TPM) is the discipline of managing the technology assets of an enterprise in a manner that is somewhat analogous to managing a portfolio of securities, whose focus is to optimize present and future value while managing risk.
At the onset, this is somewhat more challenging than one might expect as financial securities have consistent measurement criteria and technology products do not, at least not without a good amount of work as no industry standard has yet been established.
The challenge is that consistent measurement is only possible when comparing technologies that belong to the same area of technology and provide the same or overlapping capabilities. The development of standard categories is only beginning to emerge with tools for administrating TPM, such as the typical TPM tools. That said, the small number of categories that have been identified out of the box by the typical TPM tools is simply not granular enough to support the needs of large organizations, as the high-level categories should correspond directly with the architectural discipline that is most closely aligned to its core capability.
Once allocated to their associated architectural discipline, the subcategories, and in some cases, the sub-subcategories of technologies are best determined by the SME responsible for the particular architectural discipline.
For example, the subcategories for many operations and infrastructure components can be any combination of the hardware environment categories, such as mainframe; mid-range application server, database server, network server, or security server.
An example within the architectural discipline of workflow automation, technologies can be categorized as business process modeling notation (BPMN) tools, business process modeling (BPM) technologies, or workflow automation (WFA) tools, which we will discuss in the section that addresses the architectural discipline of workflow automation.
One approach to begin managing a portfolio of technology is to first develop an inventory of technologies in use across your company. This is not always easy as there may be technologies purchased and administered by business that may not be apparent to IT personnel. A thorough review of procurement contracts globally and incoming annual maintenance fees to accounts payable are typically required.
As the list of technologies is being assembled from across the globe, a variety of information associated with each technology can be gathered, noting that much of this information can further evolve repeatedly over time. The basic information that one would start with should include information from the last point in time payment was effected.
This should include exact name of the product, the name of the vendor, a vendor supplied product identifier, the product versions purchased, when each version was acquired, the platforms it was acquired for, and date of last update to the records of this product, and a high-level statement of the product’s capabilities.
One should also analyze each application system and the particular technologies that support them in production, as well as the technologies that support them in the development and deployment life cycle. To do so however, there needs to be a clear understanding of the distinction in definition between an application and a technology.
To do this we must first be careful with the use of terms. The term “business capability” refers to the business functions that are performed within a given department using any combination of manual procedures and automation. A department receives a “request” corresponding to a “business capability” that it is responsible to perform, such as the business capability for accepting and processing a payment, or the business capability of effecting a payment.
Just as business departments perform business capabilities, IT departments perform business capabilities as well, such as the business capability of a Help Desk providing advice and support to users for personal computer equipment and software.
A given business capability may be performed manually, with automation, or using a combination of manual operations with automation. The automation itself, however, may be an application, such as a funds transfer application which executes business rules specific to the business capability of funds transfer, or a technology, such as the Internet which executes generic capabilities of the particular technology.
As such, the business rules of an application must be maintained by an application development team. The application development team can be within the enterprise either onshore or offshore; it may be outsourced to a vendor.
So here’s the critical distinction that we are making. A technology does not contain business-specific business rules that support a business capability, whereas an application does contain business-specific business rules. Therefore, there are numerous software products that are technologies, such as rules engines, spreadsheets, and development tools (e.g., MS Access). These are simply technologies. However, once business rules are placed within a given instance of such a technology, then that instance becomes an application, which should be managed and maintained by an application development team as a production asset.
So to clarify, once a spreadsheet contains complex formulas that is used to support a business capability, that instance of that spreadsheet is an application that should be tested, its source should be controlled, it should be backed up for recovery purposes, and it should be considered as an inventory item in a disaster recovery (DR) plan.
However, if the spreadsheet is simply a document or a report, such as any word processing document like an MS Word file or Google Doc that do not contain business rules, then those instances are simply electronic documents and cannot be classified and managed as an application.
This means that the each application must also be analyzed to determine the specific technologies that ultimately support the automation needs of a given business capability. This includes network software, database software, operating systems, and security software, as well as the various types of drivers that integrate different components together.
Also included should be document management systems, and the development and testing tools, as well as monitoring tools that support the development as well as maintenance process for supporting automation upon which business capabilities rely.
3.1.1.1 Organizing Technologies into Portfolios
Portfolios of technologies represent a way to group technologies so that they are easier to manage. In general, the better the framework of portfolios, the more evenly distributed the technologies should be into those portfolios.
Organizing technologies into portfolios may be approached either bottom up, by first identifying the inventory of technologies and then attempting to compartmentalize them into portfolios, or top down. Once an inventory of technologies has been established, no matter how large it may be, the process of identifying the portfolio that they belong to may be conducted.
The number of technologies can be large; we have seen it even in the thousands. Although a number of classification schemes can be used to identify portfolios, the approach that we have seen that has been best for us is to classify them into portfolios that most closely match the a particular architectural discipline.
It is important to classify technologies into portfolios that correspond directly with architectural disciplines for a number of reasons. First and foremost is that there is a major difference in the result of managing technologies using a team of generalists, such as by individual solution architects, versus having an SME managing the portfolio in which they are expert.
This approach has been the best we’ve seen for managing a large portfolio of existing technologies, and when it comes to the selection of new technologies, or the selection of a future state set of technologies, it is also best.
As discussed earlier, a team of generalists, who know a great deal about many architectural disciplines, but no one discipline to the extent that they could be considered an expert, will repeatedly demonstrate a propensity to select the most expensive technology for any given capability. The approach that they take can be quite methodical, although flawed.
The approach of most generalists is to begin by getting a list of the leading technologies for a given capability from a major research company. Depending upon how this list is used, this can be the first misstep for a couple of reasons.
First, the criteria that research companies use are necessarily a best guess as to what the important characteristics are to an average enterprise, although it is difficult to define what an average enterprise may be. Unless your enterprise meets the criteria of being close to the average, it will not likely be as pertinent to your organization as you might like. Your enterprise may have particular strategies and technology direction that can easily outweigh the criteria used by an average organization.
Second, one must frequently take into account the relationship that research companies have with vendors, as some vendors represent large cash streams to the research company who sometimes hire research companies for consulting services. The advice of these firms may not be intentionally slanted at all, but we have seen at least one situation where the recommendation of a major research company was the result of deception, negligence, or incompetence.
Unfortunately, generalists are at an unfair disadvantage to detect questionable research, whereas an SME will tend to spot it immediately.
The next potential misstep performed by generalists is that they tend to use the product feature list from marketing literature as a substitute for requirements and evaluation criteria. This has a number of problems associated with it. While the evaluation criteria itself may not conform to the evaluation criteria most appropriate for your enterprise, the potentially bigger issues are that the feature list identified within the marketing literature is likely to be slanted toward the evaluation criteria used by the research company, and the evaluation criteria of the research company may actually be influenced by the vendor to favor themselves during the product evaluation process while working with the research analyst.
The final potential misstep performed by generalists is that they may not understand the all-in costs of a technology over the life of the technology. Introductory discounts and prices can distort the true cost structure, and the business benefits ofthe technology are often not realized due to tool complexity and hidden costs.
Vendor marketing personnel are the best at what they do. They are familiar with many of the financial ROI analysis approaches used by large organizations. Although most technical people do not enjoy performing a detailed financial analysis of a technology that is under evaluation, it is extremely important that this step is performed carefully in an impartial manner.
3.1.1.2 Architecture ROI Framework
When it comes to analyzing the all-in cost of each vendor technology, the SME will already have valuable insight into what other customers have experienced with a given technology, why and what the costs and benefits are. Even armed with that knowledge, it is still advisable for the SME to make use of a framework to evaluate the various aspects from an architectural perspective using an architecture ROI framework.
An architecture ROI framework can contain a number of categories with which to evaluate costs and benefits. Foremost, the appropriate SMEs should determine each technology’s compatibility with the application strategy, technology strategy, and data strategy. If the technology is not compatible with strategy of the enterprise, the technology can be rejected and the architecture ROI need not be performed.
If, however, the technology is compatible with the strategy of the enterprise, then we recommend that the architecture ROI framework minimally addresses the following with the minimum of a 3-year projection:
■ costs include new application licensing, maintenance, implementation, and decommissioning
■ savings include decommissioned application license reduction, reallocation, and maintenance
■ infrastructure impact
■ costs include new infrastructure purchases, maintenance, installation and setup, decommissioning
■ savings include decommissioned infrastructure reduction, reallocation, annual charges, and infrastructure avoidance
■ personnel impact
■ costs include additional employees, time and materials consultant labor, SOW costs, travel expenses, training costs, conference fees, membership fees, and overtime nonexempt charges
■ savings include employee hiring avoidance, employee attrition, employee position elimination, consultant hiring avoidance, consultant personnel reduction, training avoidance, travel expense avoidance, conference fee avoidance, and membership fee avoidance
■ vendor impact
■ costs include hosting fees, service subscription fees, usage fee estimates, setup fees, support fees, appliance fees, and travel
■ savings include hosting fee reduction, service subscription fee reduction, usage fee reduction, appliance fee reduction, and travel expense reduction
■ operational workflow impact
■ costs include increased rate of inbound incidents/requests, estimated increase in processing time, and average incident/request cost increase
■ savings include decreased rate of incoming incidents/requests, estimated decrease in processing time, and average incident/request cost decrease
■ business impact
■ costs include estimated business startup costs, estimated losses from periodic loss of business capabilities, estimated loss from customer dissatisfaction, and estimated exposure from regulatory noncompliance
■ savings include value of additional business capabilities, value of improved customer satisfaction, and value of enhanced regulatory reporting
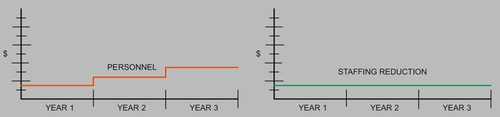
Additionally, each cost and benefit should have a visual illustration of a 3- to 5-year projection associated with it, such as in the cost illustration in red, and savings illustration in green, shown in Figure A.
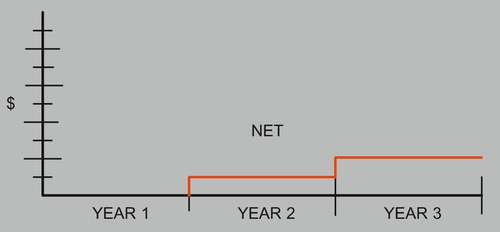
Once the figures have been reasonably verified, then it is time to prepare subtotals for each category followed at the end by a grand total chart to depict the net costs and savings of all categories, showing an architecture ROI cost, as illustrated in Figure B.
The assumption associated with the architecture ROI framework is that it does not consider:
■ net present value (NPV) to account for the future value of money,
■ internal rate of return (IRR) to compare two or more investments,
■ personnel severance costs as negotiated by HR,
■ the distinction between airfare and lodging rates, and
■ subjective measures of earnings and capital assumptions.
At this point, the architecture ROI is ready to go to finance to be included into their financial framework.
In conclusion, one or few experts will select technologies that will provide the greatest business value, as it is more likely to satisfy the capabilities actually required, to be less complex, be a vendor whose core capability more closely corresponds to what is needed to satisfy the pertinent business capability, and to have a better understanding of the all-in cost over the life of the technology.
Another important reason to classify technologies into portfolios that correspond directly with architectural disciplines is that it is much easier to identify a point of responsibility for a given technology that can perform the role and add real value to the users of the particular technology.
Once the appropriate portfolios for classifying technologies have been determined, it is a straightforward process to allocate those technologies that have a clear focus. It should be noted that some technologies have such a number of capabilities such that they begin to spread into multiple architectural disciplines. When this occurs, it is important to take note which capabilities a technology was acquired and approved for. Identifying which capabilities that a technology is to be used for is another role that experts within architectural disciplines are well suited for.
3.1.1.3 Enhanced TPM
After each technology has been allocated to the most appropriate architectural discipline, there are a few of basic steps to follow that will help with managing the content of that portfolio. Depending upon the particular architectural discipline, technologies can be further organized in useful ways.
If we consider the architectural discipline “Content Management Architecture” as an example, the technologies that could be allocated to that discipline can be organized into enterprise content management systems (aka document management systems) may include:
■ Web content management systems,
■ mobile content management,
■ collaboration management,
■ component content management,
■ media content management (e.g., audio, video), and
■ image management systems.
By organizing technologies of a portfolio by further allocating them in a diagram into such technology categories, it now becomes easy to visually illustrate technologies by these technology categories to readily depict gaps, overlaps, and oversaturation of technologies within each technology category of the particular portfolio.
The characteristics used to create technology subcategories within each portfolio are best determined by the SME that manages the particular architectural discipline. To speak to it generally however, the characteristics of the subcategories used should provide a good distribution of the technologies that have been allocated to the specific architectural discipline.
When the technologies belonging to a particular portfolio have been organized in such a manner, the SME is better positioned to identify technology strategy that is optimal for the particular portfolio.
Now that the various technologies have been organized into subcategories within their associated architectural discipline, it is time to consider technology metadata and metrics. Since all architectural disciplines need to acquire many of the same metadata about their respective technologies, it is best to develop a shared process and repository developed by the architectural discipline TPM.
As one would expect, products that have a high concentration of adoption within a line of business are not readily subject to a change in technology direction, whereas technologies that have few users and instances within a line of business can be subject to a rapid change of technology direction.
Basic metadata can include vendor name, technology name, supported hardware and operating system environments, approved usage, whether there are any special considerations for failover or DR, and the degree to which it is compatible with each line of business application strategy, technology strategy, and data strategy.
Basic metrics can include licenses purchased, licenses consumed, annual maintenance fees, cost of additional licenses, lines of business that use the technology, the level of experience across the users, degree of user training required, number of outstanding product issues, the frequency of product patches and new releases, and the number of hours consumed to provide administration for the product.
With this information, the SME can take into consideration, the costs associated with the potential disruption of each potential change to determine the most beneficial future state for the organization within each line of business. It then becomes possible to develop a roadmap to achieve the intended future state which optimizes business value, ultimately affecting the competitiveness of the company within the marketplace, as these practices accumulatively influence the infrastructural costs of the enterprise.
Additionally, publishing these artifacts as part of a policy of full transparency is the best way to illustrate the direction and strategy of technology within each technology portfolio. Imparting knowledge of the future state roadmap and the supporting metrics of a technology portfolio communicates all of the necessary information in the appropriate context as opposed to generalists assigning a status of buy, hold, or divest to each technology to drive toward the future direction with minimal knowledge and a lack of gathered information.
One last interesting topic to consider in TPM is to understand the circumstances when technologies drive the application strategy and when applications drive the technology strategy.
Although there are always exceptions, it is much more common to see a particular line of business drive the entire IT infrastructure relative to their line of business because applications for a given line of business have mostly evolved on some platforms more than in others. For example, an Investments line of business within an insurance company is far more likely to be Windows and Microsoft centric than IBM mainframe or Oracle centric, whereas HR within a large company is more likely to be Oracle UNIX centric than Microsoft centric. Once the suite of applications within a given line of business determines the dominant applications and their associated environments, the technology stack simply follows their lead.
In contrast, there are still occasions when technology leads the selection of applications and environment. This may help to explain IBM’s motivation to get into the Big Data space so that IBM hardware can play more of a central role in the high-end Hadoop world within large enterprises.
3.1.2 Reporting Architecture
Developing reports in the early years of IT was rather easy, especially since the volume of data available in a digital form at that time was relatively low. As the volume of information increased soon, it became valuable to report on historical data and the depiction of trends, statistics, and statistical correlations.
It was not long before reports went from batch to online transaction processing (OLTP) reporting, with applications generating reporting journals, which were simply flat file records generated during normal processing to support easy reporting afterward. The earliest advancements in the analysis of larger amounts of data were propelled by the business advantages that could be had within the most competitive industries, such as among the advertising and financial investment firms.
Soon new terms emerged; some of these terms emerged out of necessity, as the term “reporting” would prove too general and extremely ineffective within Internet search engines. Hence, a variety of more specific terms entered the language.
These included:
■ online analytical processing (OLAP),
■ BI,
■ nonstatistical analysis (e.g., neural networks),
■ data mining,
■ predictive analytics (aka forecasting models),
■ operational data stores (ODS),
■ data warehouse (DW),
■ data marts (DM),
■ geographic information systems (GIS), and more recently,
■ Big Data, and
■ mashup technology.
New techniques using hardware were developed in an attempt to deal with the ability of the already existing hardware to process large amounts of data.
These included the emergence of:
■ approximately a dozen levels of a redundant array of independent disks (RAID),
■ solid state drives,
■ vector processing,
■ parallel processing,
■ supercomputers,
■ multiprocessing,
■ massively parallel computing (MPP),
■ massively parallel processing arrays (MPPA),
■ symmetric multiprocessing (SMP),
■ cluster computing,
■ distributed computing,
■ grid computing,
■ cloud computing, and
■ in memory computing.
To further advance the handling of larger quantities of data, file access methods and file organizations gave way to database technologies, with a variety of database types, such as:
■ multidimensional,
■ spatial, and
■ object oriented.
Alongside these technologies came a variety of database architectures, such as:
■ network,
■ inverted list,
■ relational,
■ columnar-relational hybrids, and
■ true columnar (where relational database management system overhead is eliminated).
Although this can seem overly complex initially, it is not difficult to understand any reporting software architecture as long as you begin at the foundation of the technology, which is to first establish a good understanding of the I/O substructure and its performance specifications. Performance specifications vary with the type of operation, but they basically consist of two types of access, which are sequential access and random access.
From the foundation you build up to understanding programs that access the data, called access methods, as well as the way that they organize data on storage media, called file organizations.
Once access methods and file organizations are understood, then you are ready to understand the types of indexes, database architectures, and the architectures of database management systems including how they manage buffers to minimize the frequency with which the CPU must wait for data to move to and from the storage devices through the I/O substructure.
An expert in this discipline should be able to accurately calculate how long it will take to do each type of report by estimating the amount of time it takes for each block of data to traverse through the various parts of the I/O substructure to the CPU core. In this manner an expert can tell if a given technology will be sufficient for the particular type of report and quantity of data.
3.1.2.1 Data Warehouse Architecture
Before the volume of data grew beyond the capacity of standard reporting technologies data was read directly from their associated production transaction system files and databases. As data volume grew a problem emerged in that reporting and transactional activity shared the same production files and databases. As this resource contention grew, the need to replicate data for reporting purposes away from transactional systems grew.
When transactional systems were relatively few, replication of data for reporting was first implemented with the generation of files that could each would be used to create a particular report. With the growth in number of these files a more consolidated approach was sought, and from that the concept of the data warehouse emerged as a means to support many different reports.
As the variety of transaction system grew, along with the volume of data and number of reports, so did the complexity of the data warehouse. Soon more than one data warehouses were needed to support reporting requirements.
The complexity of creating and maintaining additional data warehouses creates opportunities for data inconsistencies across data warehouses. This led the industry to conclude that manageable collections of transaction systems should have their data integrated into ODS where it should be easier to resolve data inconsistencies because they were from similar transaction systems. Once the first wave of consolidation issues had been resolved then multiple ODSs could be further consolidated into a data warehouse.
With numerous transaction systems acting as the source of data bound for data warehouses, ODSs served as an intermediate step that could act as a mini-data warehouse for a collection of related transaction systems. These mini-data warehouses were easier to implement because the database designs of related transaction systems tended to be less disparate from one another than more distantly related transactions systems. Additionally, a number of reports could be supported from the layer of ODS databases, thereby reducing the load and complexity placed upon a single consolidated data warehouse.
With the emergence of an ODS layer, the data warehouse could return to its role of supporting the consolidated reporting needs of the organization that any could only be otherwise supported using a combination of one or more ODSs. In this approach, ODSs would house the details associated with their collection of transaction system databases, and the data warehouse would house the details associated with the collection of the ODS layer.
Needless to say, housing such a large accumulation of detail data from across several transaction systems poses a major challenge to database technologies that were designed to best address the needs of transaction processing.
Using database technology designed for transactional processing, the ability to read the detail data necessary to calculate basic totals and statistics in real time was soon lost. Data warehouses needed either a new technique to support the types of reports that focused on data aggregation, or it needed a new breed of hardware, software and databases that could support analytical processing, and a new breed of hardware, software and database technologies were born.
Data warehouse architecture deals with an array of complexities that occur in metadata, data and databases designs.
In metadata, issues include anomalies such as:
■ multiple terms that mean the same thing,
■ one term that has multiple meanings,
■ terms that do not represent an atomic data point such as compound fields,
■ terms that have incorrect, missing, or useless definitions.
In data, issues include anomalies such as:
■ sparseness of data where few values were populated for specific fields,
■ invalid data like birth dates in the future,
■ invalid or inconceivable values like a month of zero,
■ partial loss of data due to truncation,
■ invalid formats like alphabetic characters in a numeric field,
■ invalid codes like a state code of ZZ,
■ one field populated with data belonging to a different field like surname in first name,
■ application code is required to interpret the data.
In individual databases, issues include anomalies such as:
■ children records with no association to parent records
■ children associated with the wrong parent
■ duplicate records having the same business data
■ schema designs that do not correctly correlate to the business
■ indexes that point to incorrect rows of data
■ loss of historical data
In multiple databases, issues include anomalies such as:
■ inconsistent code values for the same idea like New Jersey = “99” or “NJ”
■ incompatible code values for the same idea like New Jersey = Northeast US
■ non matching values for the same fields like the same person having different birth dates
■ incompatible structures that intended to represent the same things
The process of untangling metadata, data, and database issues may require tracing the data back to the online forms and batch programs that populated the values to be able to decipher the source and meaning of the data, often requiring knowledge of data discovery techniques, data quality expertise, data cleansing, data standardization and data integration experience.
3.1.2.2 BI Architecture
BI architecture is generally a discipline that organizes raw data into useful information for reporting to support business decision making, frequently using forms of data aggregation, commonly referred to as online analytical processing (OLAP).
OLAP comprises a set of reporting data visualization techniques that provide the capability to view aggregated data, called aggregates (aka rollups), from different perspectives, which are called dimensions. As an example aggregates, such as “sales unit volumes” and “revenue totals” may be viewed by a variety of dimensions, such as:
■ “geographic region,”
■ “sales representative,”
■ “product,”
■ “product type,”
■ “customer,”
■ “customer type,”
■ “delivery method,” or
■ “payment method.”
The choice of aggregates and dimensions is specified by the user, and the results are displayed in real time.
To deliver results in real time however, the initial approach to support data aggregation techniques was somewhat primitive in that all of the desired aggregates and dimensions that would be needed had to be predicted in advance and then precalculated typically during batch process usually performed overnight. This also means that although the responses were in real time, the data was from the day before and would not include anything from today until the next day.
Since unanticipated business questions cannot be addressed in real time, there is sometimes the tendency to overpredict the possible aggregates and dimensions and to precalculate them as well. This technique has grown to such an extent that the batch cycle to precalculate the various aggregates by the desired dimensions has become so time consuming that it frequently creates pressure to extend the batch window of the system.
Data mart load programs literally have to calculate each aggregate for each dimension, such as totaling up all of the “sales unit volumes” and “revenue totals” by each “calendar period,” “geographic region,” “sales representative,” “product,” “product type,” “customer,” “customer type,” “delivery method,” “payment method,” and every combination of these dimensions in a long running overnight batch job.
Precalculated aggregates were stored in a variety of representations, sometimes called data marts, star schemas, fact tables, snowflakes, or binary representations known as cubes.
The feature that these approaches had in common was that dimensions acted as indexes to the aggregates to organize the precalculated results. A number of books have been written on this approach where they will also refer to a number of OLAP variants, such as MOLAP, ROLAP, HOLAP, WOLAP, DOLAP, and RTOLAP.
In contrast, the new breed of hardware, software, and databases approaches this problem now in new ways. The two major approaches include a distributed approach to have many servers working on the many parts of the same problem at the same time, and an approach that simply compresses the data to such an extent that the details of billion rows of data can be processed in real time on inexpensive commodity hardware, or trillions of rows of data in real time at a somewhat higher cost on mainframes.
As a result, physical data marts and the need to precalculate them are no longer necessary, with the added advantage that these new technologies can automatically support drill-down capabilities to illustrate the underlying detail data that was used to determine the aggregated totals.
The new breed of specialized hardware is typically referred to as an appliance, referring to the fact that the solution is an all included combination of software and hardware. Appliance solutions are higher priced, often significantly so in the millions of dollars, and have higher degrees of complexity associated with them particularly in areas such as failover and DR. That said, BI architecture encompasses more than just the capabilities of data aggregation.
BI can be expansive encompassing a number of architectural disciplines that are so encompassing themselves that they need to stand alone from BI architecture. These include topics such as data mining, data visualization, complex event processing (CEP), natural language processing (NLP), and predictive analytics.
Data mining is an architectural discipline that focuses on knowledge discovery in data. Early forms of data mining evaluated the statistical significance between the values of pairs of data elements. It soon grew to include analysis into the statistical significance among three or more combinations of data elements.
The premise of data mining is that one ever knows in advance what relationships may be discovered within the data. As such, data mining is a data analysis technique that simply looks for correlations among variables in a database by testing for possible relationships among their values and patterns of values. The types of relationships among variables may be considered directly related, inversely related, logarithmically related, or related via statistical clusters.
One challenge of data mining is that most statistical relationships found among variables do not represent business significance, such as a correlation between a zip code and a telephone area code. Therefore, a business SME is required to evaluate each correlation.
The body of correlations that have no business significance must be designated as not useful so that those correlations may be ignored going forward. The correlations that cannot be summarily dismissed are then considered by the business SME to evaluate the potential business value of the unexpected correlation.
Hence, examples of some potentially useful correlations may include the situations, such as a correlation between the numbers of times that a customer contacts the customer service hotline with a certain type of issue before transferring their business to a competitor, or a correlation among the value of various currencies, energy product prices, and precious metal commodity prices.
An active data mining program can cause business executives to reevaluate the level of importance that they place upon information when it is illustrated that valuable information for decision making lays hidden among vast quantities of business data. For example, data mining could discover the factors that correspond to the buying patterns of customers in different geographic regions.
Data visualization is an architectural discipline closely related to BI architecture that studies the visual representation of data, often over other dimensions such as time. Given the way that human brain works, taking data that exists as rows of numbers into different visual patterns across space, using different colors, intensities, shapes, sizes, and movements, can communicate clearly and bring to attention the more important aspects. Some of the common functions include drill downs, drill ups, filtering, group, pivot, rank, rotate, and sort. There are hundreds of ways to visualize data and hundreds of products in this space, many of which are highly specialized to particular use cases in targeted applications within specific industries.
A partial list of visual representations includes:
■ terrain maps,
■ architectural drawings,
■ floor plans,
■ shelf layouts,
■ routes,
■ connectivity diagrams,
■ bubbles,
■ histograms,
■ heat maps,
■ scatter plots,
■ rose charts,
■ cockpit gauges,
■ radar diagrams, and
■ stem and leaf plots.
3.1.2.3 Predictive Analytics Architecture
Predictive analytics is another architectural discipline that encompasses such a large space that it is worthy of its own discipline. Predictive analytics encompasses a variety of techniques, statistical as well as nonstatistical, modeling, and machine learning. Its focus, however, is identifying useful data, understanding that data, developing a predictive or forecasting capability using that data, and then deploying those predictive capabilities in useful ways across various automation capabilities of the enterprise.
Usually, the breakthroughs that propel a business forward originate on the business side or in executive management. There are a handful of factors that can lead to breakthroughs in business, where competitive advantages in technology can suddenly shift to one company within an industry for a period of time until the others catch up.
The basic types of competitive breakthroughs involve innovations in products, processes, paradigms, or any combination of these. Breakthroughs in paradigms are the most interesting as for the most part they facilitate a different way of looking at something. Some of the companies that have done particularly well involving breakthroughs in paradigms are companies such as Google, Apple, Facebook, and Amazon.
In a number of cases, however, a breakthrough in paradigm can be caused by mathematics, such as the mathematical developments that eventually led to and included the Black-Scholes options pricing model, which is where most agree that the discipline of quantitative analysis emerged.
The ability of a statistical model to predict behavior or forecast a trend is dependent upon the availability of data and its correct participation in the statistical model. One advantage that statistical models have to offer is their rigor and ability to trace the individual factors that contribute to their predictive result. Statistical methods however require individuals to be highly skilled in this specialized area.
The architectural discipline of predictive analytics is deeply engrained in statistics and mathematics, with numerous specialty areas.
Some examples of a specialty area include:
■ longitudinal analysis, which involves the development of models that observe a particular statistical unit over a period of time,
■ survey sampling models, which project the opinions and voting patterns of sample populations to a larger population, and
■ stimulus-response predictive models, which forecast future behavior or traits of individuals.
While knowledge of statistical methods is essential for this discipline, it should not be without knowledge of nonstatistical methods, such as neural network technology (aka neural nets).
Neural networks are nonstatistical models that produce an algorithm based upon visual patterns. To be useful, numerical and textual information are converted into a visual image. The role of the algorithm is ultimately to classify each new visual image as having a substantial resemblance to an already known image.
Similar to statistical models, the ability of a neural network to predict behavior or forecast a trend is dependent upon the availability of data and its participation in the nonstatistical model to properly form the “visual image.”
Neural nets are essentially complex nonlinear modeling equations. The parameters of the equations are optimized using a particular optimization method. There are various types of neural nets that use different modeling equations and optimization methods. Optimization methods range from simple methods like gradient descent to more powerful ones like genetic algorithms.
The concepts of neural networks and regression analysis are surprisingly similar. The taxonomy of each is different, as is usually the case among the disciplines of artificial intelligence.
As examples, in regression analysis, we have independent variables; in neural networks, they are referred to as “inputs.” In regression analysis, you have dependent variables; in neural nets, they are referred to as “outputs.” In regression analysis, there are observations; in neural nets, they are referred to as “patterns.”
The patterns are the samples from which the neural net builds the model. In regression analysis, the optimization method finds coefficients. In neural nets, the coefficients are referred to as weights.
Neural network “training” results in mathematical equations (models) just like regression analysis, but the neural network equations are more complex and robust than the simple “polynomial” equations produced by regression analysis. This is why neural networks are generally better at recognizing complex patterns.
That said, it should also be noted that it is often a trial-and-error process to identify the optimum type of neural network and corresponding features and settings to use given the data and the particular problem set. This tends to drive the rigorous statistician insane. Although early neural networks lacked the ability to trace the individual factors that contributed to the result, which also drove many a statistician insane, modern neural networks can now provide traceability for each and every outcome.
Early neural nets required highly specialized personnel; however, the products and training in this space have become user friendly for business users and even IT users to understand and use.
An early adopter of neural nets was American Express. Early on credit card applications were evaluated manually by clerical staff. They would review the information on the credit card application and then based upon their experience judge whether or not the applicant was a good credit risk.
The paradigm breakthrough that AMEX created was that they envisioned that the data on credit card applications could be converted to digital images that in turn could be recognized by a neural network. If the neural net could learn the patterns of images made by the data from the credit card applications of those that proved good credit risks, as well as patterns corresponding from bad credit risks, then it could potentially classify the patterns of images made by the data from new credit card applications as resembling good or bad credit risks correctly, and in a split second.
AMEX was so right. In fact, the error rate in correctly evaluating a credit card application dropped significantly with neural nets, giving them the ability to evaluate credit card applications better than any company in the industry, faster, more accurately, and at a fraction of the cost. At that time, AMEX was not a dominant global credit card company, but they rapidly became the global leader and continue to endeavor to maintain that status.
Regardless of the particular technique that is adopted, the use of predictive analytics has become essential to many businesses. Some insurance companies use it to identify prospective customers that will be profitable versus those that will actually cause the company to lose money.
For example, predictive analytics have been successfully deployed to determine which customers actively rate shop for insurance policies. If customers attain an insurance policy and then defect to another carrier within a relatively short period of time, then it ends up costing the insurance company more than they have made in profits for the given time period.
Today, retailers use predictive analytics to identify what products to feature to whom and at what time so as to maximize their advertising expenditures. Internet providers use predictive analytics to determine what advertisements to display, where it should be displayed, to whom. There are numerous applications across many industries, such as pharmaceuticals, health care, and financial services.
3.1.2.4 Big Data Architecture
The term “big data” means different things to different people. In its most simple form, big data refers to sufficient amounts of data that it becomes difficult to analyze it or report on it using the standard transactional, BI, and data warehouse technologies. Many of the “big data”-specific technologies, however, require significant budgets and usually require an extensive infrastructure to support. As such, it is critical for enterprise architecture to oversee it with the appropriate business principles to protect the interests of the enterprise.
In the context of control systems, big data is generally understood as representing large amounts of unstructured data. In this context, the true definition of unstructured data refers to the types of data that do not have discrete data points within the data that can be designed to map the stream of data such that anyone would know where one data point begins and ends after which the next data point would begin.
In a control system, the concept of a “record” housing unstructured data is different, as it represents a specific continuum of time when the data was recorded. In contrast, a record within an information system context will typically represent an instance of something.
In the context of information systems, big data is generally understood to be structured data and semistructured data, which is often referred to as unstructured data, as there are few examples of true unstructured data in an information system paradigm.
That said, it is important to clearly define what is meant by structured, unstructured, and semistructured data.
Structured data is the term used when it is clear what data elements exist, where, and in what form. In its most simple form, structured data is a fixed record layout; however, there are variable record layouts, including XML that make it clear what data points exist, where, and in what form.
The most common form of structured data is file and database data. This includes the content of the many databases and files within an enterprise company where there is a formal file layout or database schema. This data is typically the result of business applications collecting books and records data for the enterprise.
The next most common form of structured data refers to the content of machine generated outputs (e.g., logs), that are produced by various types of software products, such as application systems, database management systems, networks, and security software. The ability to search, monitor, and analyze machine generated output from across the operational environment can provide significant benefit to any large company.
Unstructured data is the term used when it is not clear what data elements exist, where they exist, and the form they may be in. Common examples include written or spoken language, although heuristics can often be applied to discern some sampling of structured data from them.
The most unstructured data does not even have data elements. These forms of unstructured data include signal feeds from sensors involving streaming video, sound, radar, radio waves, sonar, light sensors, and charged particle detectors. Often some degree of structured data may be known or inferred with even these forms of unstructured data, such as its time, location, source, and direction.
Semistructured data is the term used when it is clear that there is some combination of structured and unstructured data, which often represents the largest amount of data in size across most every enterprise. As an example, I have frequently seen as much 80% of the data across all online storage devices within a financial services company be classified as semistructured data.
The most common forms of semistructured data include electronic documents, such as PDFs, diagrams, presentations, word processing documents, and spreadsheet documents, as distinct from spreadsheets that strictly represent flat files of structured data. Another common form of semistructured data includes messages that originate from individuals, such as e-mail, text messages, and tweets.
The structured component of the data in semistructured data for files is the file metadata, such as the file name, size, date created, date last modified, date last accessed, author, total editing time, and file permissions. The structured component of the data in e-mails includes the e-mail metadata, such as the date and time sent, date and time received, sender, receiver, recipients copied, e-mail size, subject line, and attachment file names, and their metadata.
The unstructured component of the data in semistructured data refers to the content of the file and/or body of the message. This form of unstructured data, however, can be transformed into structured data, at least in part, which is discussed in more detail within the discipline of NLP architecture, where automation interprets the language and grammar of messages, such as social media blogs and tweets, allowing it to accurately and efficiently extract data points into structured data. Opportunities to strategically convert the unstructured component of semistructured data to structured data provide significant competitive advantages.
Big data deals with any combination of structured, unstructured, and semistructured data, and the only thing in common between the ways that big data deals with extremely large volumes of data is that it does not rely upon file systems and database management systems that are used for transaction processing.
Regarding the more precise definition of big data, it is the quantity of data that meets any or all of the following criteria:
■ difficult to record the data due to the high velocity of the information being received,
■ difficult to record the data due to the volume of information being received,
■ difficult to maintain the data due to the frequency of updates being received—although this tends to eliminate MapReduce as a viable solution,
■ difficult to deal with the variety of structured, unstructured, and semistructured data,
■ difficult to read the necessary volume of data within it to perform a needed business capability within the necessary time frame using traditional technologies,
■ difficult to support large numbers of concurrent users running analytics and dashboards,
■ difficult to deal with the volume of data in a cost-effective manner due to the infrastructure costs associated with transaction processing technologies.
3.1.2.4.1 OldSQL vs. NoSQL vs. New SQL
3.1.2.4.1.1 OldSQL
The term OldSQL refers to the traditional transactional database management systems, regardless of their particular architecture (e.g., hierarchical, such as IMS, network, such as IDMS, inverted list, such as Adabas, or relational, such as SQL Server, DB2, Oracle, and Sybase). In relation to one another, all of these databases are forms of polymorphic data storage. This simply means that although the data is stored using different patterns, the information content is the same.
These products have developed from traditional file access methods and file organizations, such as IBM’s DB2 database management system, which is built upon VSAM.
These OldSQL databases were designed to handle individual transactions, such as airline reservations, bank account transactions, and purchasing systems which touch a variety of database records, such as the customer, customer account, availability of whatever they are purchasing, and then effect the purchase, debiting the customer, crediting the company, and adjusting the available inventory to avoid overselling. Yes, if you were thinking that airline reservation systems seem to need help, you are correct although the airlines intentionally sell a certain number of additional seats than they have to compensate for some portion of cancellations and passengers that do not show up on time.
OldSQL databases have dominated the database industry since the 1980s and generally run on elderly code lines. The early database management systems did not have SQL until the emergence of SQL with relational databases. The query language of these early transaction systems was referred to as data manipulation language (DML) and was specific to the brand of database. These codes lines have grown quite large and complex containing many features in a race to have more features than each of their competitors, which all now feature SQL as a common query language.
A longer list of transaction database features includes such things as:
■ SQL compilers,
■ authorization controls,
■ SQL query optimizers,
■ transaction managers,
■ task management,
■ program management,
■ distributed database management,
■ communications management,
■ trace management,
■ administrative utilities,
■ shutdown,
■ startup,
■ system quiescing,
■ journaling,
■ error control,
■ file management,
■ row-level locking,
■ deadlock detection and management,
■ memory management,
■ buffer management, and
■ recovery management.
As one can imagine, having large numbers of sophisticated features means large amounts of code that takes time to execute and manage lists of things like locks that all contribute to overhead that can slow a database down, such as having to maintain free space on a page to allow for a record to expand without having to move the record to another page, or to add another record to the page that is next in sort sequence or naturally on the same page due to a hashing algorithm.
3.1.2.4.1.2 NoSQL
A number of nontraditional database and BI technologies have emerged to address big data more efficiently. At a high level, these new breed of database management system architectures often take advantage of distributed processing and/or massive memory infrastructures that can use parallel processing as an accelerator.
Interestingly, they are called NoSQL because they claim that the SQL query language is one of the reasons why traditional transactions systems are so slow. If this were only true, then another query language could be simply developed to address that problem. After all, SQL is merely a syntax for a DML to create, read, update, and delete data.
Vendors of NoSQL database products are slowly moving their proprietary query languages closer and closer to SQL as the industry has caught on to the fact that speed and query language are unrelated. To adjust to this, the term NoSQL now represents the phrase “not only SQL.”
The aspects that do slow down OldSQL include:
■ many extra lines of code that get executed to support many features that are specific to transaction systems,
■ row-level locking and the management of lock tables,
■ shared resource management, and
■ journaling.
Aside from stripping away these features, NoSQL databases usually take advantage of parallel processing across a number of nodes, which also enhances recoverability through various forms of data redundancy.
Aside from SQL, there is another unfounded excuse given for the poor performance of OldSQL transaction databases, namely, “ACID.” I am often amazed at how frequently ACID compliance is often falsely cited as something that hinders performance.
To explain what ACID is in simple terms, if I purchase a nice executive looking leather backpack from Amazon to carry my 17 inch HP laptop through the streets of Manhattan, and Amazon only has one left in stock, ACID makes sure that if someone else is purchasing the same backpack from Amazon that only one of us gets to buy that backpack.
To briefly discus what each letter in ACID stands for:
■ Atomicity refers to all or nothing for a logical unit of work,
■ Consistency refers to adherence of data integrity rules that are enforced by the database management system,
■ Isolation refers to the need to enforce a sequence of transactions when updating a database, such as two purchasers both trying to purchase the last instance of an item, and
■ Durability refers to safeguarding that information will persist once a commit has been performed to declare successful completion of a transaction.
The topic of big data is rather vast much like big data would imply. Some of the topics it includes are the following:
■ infrastructure design of multinode systems
■ where each node is a server, or
■ SMP,
■ MPP, or
■ asymmetric massively parallel processing (AMPP) systems, which is a combination of SMP and MPP.
■ large-scale file system organization,
■ large-scale database management systems that reside on the large-scale file system,
■ data architectures of Hadoop or Hadoop like environments,
■ metadata management of the file system and database management system,
■ distributed file system (DFS) failures and recovery techniques,
■ MapReduce, its many algorithms and various types of capabilities that can be built upon it.
MapReduce is an architectural discipline in itself. Some of the topics that a MapReduce Architect would have to know include:
■ reduce tasks,
■ Hadoop Master controller creating map workers and reduce workers,
■ relational set operations,
■ communication cost modeling to measure the efficacy of algorithms,
■ similarity measures,
■ distance measures,
■ clustering and networks,
■ filtering, and
■ link analysis using page rank.
And then of course, it has close ties to various other architectural disciplines, such as reporting architecture, data visualization, information architecture, and data security.
3.1.2.4.1.3 NewSQL
NewSQL is the latest entrant of database management system for OLTP processing. These modern relational database management systems seek to provide the same scalable performance of NoSQL systems for OLTP workloads while still maintaining the ACID guarantees of a traditional database system.
As for features that give NewSQL high performance and usefulness, NewSQL:
■ scales out to distributed nodes (aka sharding),
■ renders full ACID compliance,
■ has a smaller code set,
■ includes fewer features, and
■ supports transactional processing.
3.1.2.4.2 Big Data—Apache Software Foundation
The focus of big data has recently moved to the software frameworks based on Hadoop, which are centrally managed by a U.S.-based nonprofit corporation incorporated in Delaware in June 1999 named Apache Software Foundation (ASF). The software available from ASF is subject to the Apache License and is therefore free and open source software (FOSS).
The software within the ASF is developed by a decentralized community of developers. ASF is funded almost entirely from grants and contributions, and over 2000 volunteers with only a handful of employees. Before software can be added to the ASF inventory, its intellectual property (IP) must be contributed or granted to the ASF.
The ASF offers a rapidly growing list of open source software. Rather than listing them, to give an idea as to what types of open source offering they have, consider the following types of software and frameworks:
■ archival tools,
■ Big Data BigTable software,
■ BPM and workflow software,
■ cloud infrastructure administration software,
■ content management/document management software,
■ database software,
■ documentation frameworks,
■ enterprise service bus (ESB) software,
■ file system software,
■ integration services,
■ job scheduling software,
■ machine learning/artificial intelligence software,
■ search engines,
■ security software,
■ software development software,
■ version control software,
■ Web software, and
■ Web standards.
A handful of companies represent the major contributors in the ASF space. They all base their architectures on Hadoop which in turn are based upon the Google’s MapReduce and Google File System (GFS) papers.
Hadoop, or more formally Apache Hadoop, as a term refers to the entire open source software framework that is based in the Google papers. The foundation of this framework is a file system, Hadoop Distributed File System (HDFS). HDFS as a file system is fairly rudimentary with basic file permissions at the file level like in UNIX, but able to store large files extremely well, although it cannot look up any one of those individual files quickly. It is important to be aware of the fact that IBM has a high-performance variant of HDFS called GPFS.
On top of HDFS, using its file system is a type of columnar database, HBase, which is a type of NoSQL database analogous to Google’s BigTable, which is their database that sits on top of the GFS. HBase as a database is fairly rudimentary with an indexing capability that supports high-speed lookups. It is HBase that supports massively parallelized processing via MapReduce. Therefore, if you have hundreds of millions of rows or more of something, then HBase is one of the most well-known tools which may be well suited to meet your needs. Yes, there are others, but that’s the topic for yet another book.
To focus on the Apache Foundation, the number of software components and frameworks that are part of the Apache Software Framework (ASF) that integrates with HDFS and HBase is roughly 100. We will not go through these, except for the few that are most important in our view. However, first let’s ask the question, “Do we need a hundred software components and frameworks, and are the ones that exist the right ones?” The way to understand this is to first follow the money. To do this, we should look at how companies make money from software that is free.
The pattern for this model is Red Hat in November 1999 when it became the largest open source company in the world with the acquisition of Cygnus, which was the first business to provide custom engineering and support services for free software.
A relatively small number of companies are developing software for the ASF in a significant way so that they can position themselves to provide paid custom engineering and support services for free software. Many of the software components in the ASF open source space are not what large enterprises tend to find practical, at least not without customization.
When one of these companies illustrates their view of the Hadoop framework, we should not be surprised if the components that are more prominently displayed are components that they are most qualified to customize and support or include software components that they license. Hence, the big data software framework diagram from each vendor will, for practical purposes, look different.
There are also a relatively large number of companies, which are developing licensed soft-ware in this space, sometimes only after the software enters a production environment. Instead of vying for paid custom engineering and support services, the goal of these companies is to sell software in volume.
If we now return to the question, “Do we need a hundred software components and frameworks, and are the ones that exist the right ones for a large enterprise?” the answer may resonate more clearly.
First, of the roughly 100 components of the ASF, there are ones that are extremely likely to be more frequently deployed in the next several years, and those that are likely to decline in use.
We will begin by defining a handful of candidate ASF components:
■ R Language—a powerful statistical programming language that can tap into the advanced capabilities of MapReduce,
■ Sqoop—provides ETL capabilities in the Hadoop framework (though not the only one),
■ Hive—a query language for data summarization, query, and analysis,
■ Pig—a scripting language for invoking MapReduce programs, and
■ Impala—provides a SQL query capability for HDFS and HBase.
Let’s speculate regarding the viability of a sampling of the ASF:
Let’s being with “R.” The “R Programming Language” was created at the University of Auckland, New Zealand. It was inspired by two other languages “S” and “Scheme” and was developed using C and FORTRAN. “R” has been available as open source under the GNU General Public License (aka GNU GPL or GPL) and Free Software Foundation (FSF), which are organizations distinct from the ASF. The GPU offers the largest amount of free software of any free or open source provider.
To provide an example of what R Language looks like, let’s create the following real life scenario with a little background first.
Prime numbers are taught to us in school as being whole numbers that cannot be factored with other whole numbers (aka integer) other than the number 1 or itself. In other words, if we take a whole number such as the number 18, it is not a prime number simply because it can be factored as 9 times 2, or 3 times 6, which are all whole numbers. In contrast, the number 5 is a prime number because it cannot be factored by any whole number other than 1 or 5. Using this definition, the list of prime numbers begins as 1, 2, 3, 5, 7, 11, 13, 17, and 19. That said, some include the number 1, some exclude it. This is where prime number theory basically begins and ends, although I disagree that it should end here.
In my view, there is a second rule involving prime numbers that is not yet recognized, except for by myself. To me, prime numbers are not only whole numbers that cannot be factored with other whole numbers other than by the number 1 or itself, but prime numbers also represent volume in three-dimensional space whose mean (aka average) is always an integer (Luisi Prime Numbers).
Hence, primes in my view are a relationship among spatial volumes of a series of cubes beginning with a cube of 1 by 1 by 1. It also excludes all even numbers as being nonprimes, thereby eliminating the number “2.” Visually in one’s mind the sum of the volume of each prime divided by the number of cubes is always a simple integer.
To provide an example of what R language looks like, let’s code for the mean of primes, which can be stated in pseudo code as the AVERAGE (first prime**3, second prime**3, and so on to infinity) is always a simple integer.
To go one step further, let’s say that this new mathematical theory intends to say that any other number added on the end of the sequence that is the next “potential” prime number will only have a remainder of zero when the number added to the prime number series is the next prime number in the sequence. Since this is my theory, I choose to call these numbers “Luisi Prime Numbers,” which can be useful when we discuss NP-complete and NP-hard problems.
Although “Mersenne Prime Numbers” are among the largest presently known prime numbers, the Luisi Prime Numbers are a major improvement over Mersenne Prime Numbers as Mersenne Prime Numbers are simply based on testing for a prime that is the number two raised to some exponential power and subtracting one from it. The first four Mersenne Prime Numbers are “3” (based on 22 − 1), “7” (based on 23 − 1), “31” (based on 25 − 1), and “127” (based on 27 − 1), which miss all the prime numbers in between one less than a power of two such as 11, 13, 17, 19, 23, and so on.
I could begin to test out the basic theory easily enough with R Language as follows:
| place in variable ‘x’ the first prime number | |
| cube the prime number list | |
| print the vector in variable ‘x’ | |
| print the vector in variable ‘y’ | |
| average the cube of the 1 prime number | |
| mean (y) with no receiving variable | |
| place in variable ‘x’ a vector of prime numbers | |
| cube the prime number list | |
| print the vector in variable ‘x’ | |
| print the vector in variable ‘y’ | |
| average the cube of the 2 prime numbers | |
| mean (y) with no receiving variable | |
| place in variable ‘x’ a vector of prime numbers | |
| cube the prime number list | |
| print the vector in variable ‘x’ | |
| print the vector in variable ‘y’ | |
| average the cube of the 3 prime numbers | |
| mean (y) with no receiving variable | |
| And so on, at least until I learn how to create a do loop in R | |
| place in variable ‘x’ a vector of prime numbers | |
| cube the prime number list | |
| print the vector in variable ‘x’ | |
| print the vector in variable ‘y’ | |
| average the cube of the 9 prime numbers | |
| mean (y) with no receiving variable | |
As is the practice for certain types of open source software, a company named Revolution Analytics began offering support for the R programming language and additionally developed three paid versions, including:
■ Enterprise Workstation, and
■ Enterprise Server.
The popularity of R grew rapidly in the analytics community, and it now uses a large library of R extensions that have been assembled under “The Comprehensive R Archive Network (CRAN),” with an inventory presently in excess of 5500 R extensions.
In my opinion, “R” will enjoy increased use within the industry. Although it is not obvious or intuitive how to use R as a programming language in the short term, once the developer understands it, it is an extremely efficient way to develop software that takes advantage of the powerful capabilities of MapReduce.
Next are the ETL capabilities of “Sqoop.” A strong competitor to Sqoop is the ETL product space, which has an attractive distributed architecture for their conventional ETL and has an open source version in both the Hadoop and conventional space.
Last are “Hive,” “Pig,” and “Impala.” These components have a variety of limitations pertaining to their access and security capabilities as well as runtime restrictions involving available memory, but new versions are on the way. There are also emerging products that use a free license preproduction and licensed in production, that support full SQL, including insert, update, and delete capabilities as well as support for data security using “grant” and “revoke.”
Since support is necessary for any set of automation that supports important business capabilities, particularly in a large enterprise, it should be clear that the option for technology to be free is realistically not an option, except for the small company or home user.
3.1.2.4.3 Competing Hadoop Frameworks
I should note that this is among the few chapters where vendor names are used. To remain vendor agnostic, the names are being used simply for a historical perspective, without any preference shown for any vendor over another and purely with a journalistic perspective.
For the most part, there are six major competing frameworks in the Hadoop space and then a myriad of additional companies that offer products within these or similar frameworks. Of the six major frameworks, they include the following.
3.1.2.4.3.1 Cloudera
Although Yahoo developed Hadoop in 2006, the first company to form after Yahoo developed, it was Cloudera in 2009. It was formed by three engineers, one each from Google, Yahoo, and Facebook.
Cloudera has a framework that features their licensed components and the open source components that they are competent to support and customize for other organizations.
The way Cloudera depicts their framework, they organize their components into five major groups:
■ Cloudera Navigator,
■ Cloudera Manager,
■ Cloudera Distribution including Apache Hadoop (CDH), and
■ Connectors (e.g., Microstrategy, Netezza, Oracle, Qlikview, Tableau, Teradata)
(See the most current version of the diagram on www.cloudera.com).
3.1.2.4.3.2 Hortonworks
Two years later, 2011, the next one that formed was Hortonworks. Hortonworks received over 20 engineers from the Hadoop team of Yahoo and partnered with Microsoft, Informatica, and Teradata. One of their differentiators from the other frameworks is that Hortonworks is the only one that is staunchly open source.
Due to the fact that Hortonworks has a framework that features only open source components, all of their revenue comes from support, customization, and consulting services of the Apache Foundation stack. The Hortonworks approach is to provide all of their contributions involving the Hadoop framework to the Apache Foundation to support and customize these products and frameworks for other organizations. As a result, Hortonworks version of Hadoop is the trunk version of Hadoop.
The way Hortonworks depicts their framework, they organize their components into five major groups:
■ Hortonworks Operational Services,
■ Hortonworks Data Services,
■ Hortonworks Core,
■ Hortonworks Platform Services, and
■ Hortonworks Data Platforms (HDP)
(See the most current version of the diagram on www.hortonworks.com).
3.1.2.4.3.3 MapR
Around the same time in the same year, 2011, the company MapR formed as a team with EMC and Amazon to distribute an EMC-specific distribution of Apache Hadoop. A specific distribution refers to the fact that a branch has been taken off the trunk, which is a version of Hadoop has been selected which becomes a stable version of Hadoop off of which MapR may develop additional components.
In theory, even though a branch has been selected off the trunk, the ability to take a new more current branch of Hadoop always exists and it should always be compatible.
The differences seen in the MapR framework are due to the MapR specifically licensed software components that they have developed.
The way MapR depicts their framework, they organize their components into three major groups:
■ Apache Projects with fifteen Apache Foundation open source components,
■ MapR Control System, and
■ MapR Data Platform
(See the most current version of the diagram on www.mapr.com).
MapR offers three different versions of Hadoop known as M3, M5, and M7, with each successive version being more advanced with more features. While M3 is free, M5 and M7 are available as licensed versions, M7 having the higher price point.
3.1.2.4.3.4 IBM
By November 2011, IBM announced its own branch of Hadoop called IBM BigInsights within the InfoSphere family of products.
The way IBM depicts their framework, they organize their components into six major groups:
■ Optional IBM and partner offerings,
■ Analytics and discovery,
■ Applications,
■ Infrastructure,
■ Connectivity and Integration, and
■ Administrative and development tools
(See the most current version of the diagram on www-01.ibm.com/software/data/infosphere/biginsights/).
The IBM BigInsights framework includes:
■ Text analytics—providing advanced text analytics capabilities,
■ BigSheets—providing a spreadsheet like interface to visualize data,
■ Big SQL—providing a SQL interface to operate MapReduce,
■ Workload Optimization—providing job scheduling capabilities,
■ Development tools—based on Eclipse, and
■ Administrative Tools—to manage security access rights.
The framework offered by IBM has fewer open source components depicted as compared to licensed components as IBM is in the process of integrating a number of their products into the Big Data ecosystem to provide enterprise grade capabilities, such as data security using their Infosphere Guardium product to potentially support data monitoring, auditing, vulnerability assessments, and data privacy.
3.1.2.4.3.5 Microsoft
The fifth framework is that of Microsoft’s HDInsight. This framework is unique in that it is the only one that operates in Windows directly instead of Linux. (See the most current version of the diagram on www.windowsazure.com/en-us/documentation/services/hdinsight/?fb=en-us.)
HDInsight supports Apache compatible technologies, including Pig, Hive, and Sqoop, and also supports the familiar desktop tools that run in Windows, such as MS Excel, PowerPivot, SQL Server Analysis Services (SSAS), and SQL Server Reporting Services (SSRS), which of course are not supported in Linux.
In the interest of full disclosure, we should note that Microsoft SQL Server also has various connectors that allow it to access Hadoop HBase on Linux through Hive.
3.1.2.4.3.6 Intel
The sixth framework is that of Intel’s distribution of Apache Hadoop, which is unique for it being built from the perspective of its chip set. Intel states in its advertising that it achieves:
■ up to a 30-fold boost in Hadoop performance with optimizations for its CPUs, storage devices, and networking suite,
■ up to three and a half fold boost in Hive query performance,
■ data obfuscation without a performance penalty, and
■ multisite scalability.
3.1.2.4.3.7 Summary
All six are outstanding companies. As for architectural depictions, if you view their respective framework diagrams, they all share a common challenge. They all demonstrate an inconsistent use of symbols and diagramming conventions.
If these diagrams were drawn using a consistent set of symbols, then they would communicate the role of each component relative to each other component and more rapidly understood.
In any event, these are the basic types of components that each framework contains. From here, one can color code the Apache Foundation components that are available through free open source licenses versus the components that are available through other open source providers and/or paid licenses.
It is important to note that companies should choose carefully which framework they will adopt. The reason for this is that if you choose a framework with proprietary components, any investment that you make in those proprietary components is likely to be lost.
When in doubt, the best choice is to not choose a framework or employ proprietary components until the implications have been determined and a strategic direction has been set. Each vendor offering proprietary components within their big data framework has an attractive offering. The ideal solution would be to have the ability to integrate combinations of proprietary components from each of the vendors, but presently that option is not in alignment with the marketing strategy of the major vendors.
There are also products and vendors that operate under the covers to improve the performance of various components of the Hadoop framework. Two examples of this class of component are Syncsort for accelerating sort performance for MapReduce in Hadoop and SAS for accelerating statistical analysis algorithms, both of which are installed on each node of a Hadoop cluster.
3.1.2.4.4 Big Data Is Use Case Driven
As one can already sense, there are perhaps an unusually large number of products within the big data space. To explain why this is the case, we only need to look at the large variety of use case types that exist. As one would expect, certain use case types are best handled with technologies that have been designed to support their specific needs.
The common use case types for big data include, but are not limited to:
■ Document management/content management,
■ Knowledge management (KM) (aka Graph DB),
■ Online transaction processing systems (NewSQL/OLTP),
■ Data warehousing,
■ Real-time analytics,
■ Predictive analytics,
■ Algorithmic approaches,
■ Batch analysis,
■ Advanced search, and
■ Relational database technology in Hadoop.
3.1.2.4.4.1 Data Discovery Use Case Type
Data discovery falls into one of three basic types of discovery, which include:
■ class discoveries, and
■ association discoveries.
Novelty discoveries are the new, rare, one-in-a-million (billion or trillion) objects or events that can be discovered among Big Data, such as a star going supernova in some distant galaxy.
Class discoveries are the new collections of individual objects or people that have some common characteristic or behavior, such as a new class of customer like a group of men that are blue-collar workers but also particularly conscious of their personal appearance or hygiene, or a new class or drugs that are able to operate through the blood-brain barrier membrane utilizing a new transport mechanism.
Association discoveries are the unusual and/or improbable co-occurring associations, which may be as simple as discovering connections among individuals, such as can be illustrated on Linked-in or Facebook.
Big Data offers a wealth of opportunity to discover useful information among vastly large amounts of objects and data.
Among the entrants for this use case type are included any of the technologies that have either some variant of MapReduce across a potentially large number of nodes or certain architectures of quantum computing.
3.1.2.4.4.2 Document Management/Content Management Use Case Type
Document management is a type of use case that usually requires a response to a query in the span of 3-5 seconds to an end user, or a response in hundreds of milliseconds to an automated component which may deliver its response directly to an end user or a fully automated process. The use case type of document management/content management refers to an extensive collection of use cases that involve documents or content that may involve structured, unstructured, and/or semistructured data.
These can include:
■ official documents of government agencies
■ legislative documents of congress
■ content generated by politicians and staff
■ government contracts
■ business document management
■ loan applications and documents
■ mortgage applications and documents
■ insurance applications and documents
■ insurance claims documents
■ new account forms
■ employment applications
■ contracts
■ IT document management
■ presentation files
■ spreadsheet files
■ spreadsheet applications
■ desktop applications
■ standards documents
■ company policies
■ architectural frameworks
■ customer document management
■ copies of birth certificates
■ marriage, divorce, and civil union certificates
■ insurance policies
■ records for tax preparation
Once the specific use case(s) of document management/content management have been identified, then one has the ability to start listing requirements. Basic document requirements start with simple things, such as the maximum size of a document and the number of documents that must be managed but it continues into an extensive list that will determine the candidate Big Data products that one may choose from.
Potential document management/content management requirements include:
■ maximum document ingestion rate
■ maximum number of documents
■ file types of documents
■ expected space requirements
■ maximum concurrent users retrieving documents
■ document update/modification requirements
■ peak access rate of stored documents
■ number of possible keys and search criteria of documents
■ local or distributed location of users
■ multi-data center
■ fault tolerance
■ developer friendly
■ document access speed required
In fact, the potential list of requirements can extend into every nonfunctional type of requirement listed in the nonfunctional requirements section discussed later in this book.
Needless to say, there are many Big Data products in the space of document management/content management, each with their own limits on document size, number of keys, index ability, retrieval speed, ingestion rates, and ability to support concurrent users.
Among the entrants for this use case type are included:
■ MarkLogic,
■ MongoDB,
■ Cassandra,
■ Couchbase,
■ Hadoop HDFS, and
■ Hadoop HBase.
The use case of document management however can become much more interesting.
As an example, let’s say that your organization has millions of documents around the globe in various document repositories. It is also rather likely that the organization does not know what documents it has across these repositories and cannot locate the documents that they think they have.
In this type of use case, there are big data tools that can crawl through documents that can propose an ontology for use to tag and cluster documents together into collections. If done properly, these ontology clusters can then be used to give insight into what documents actually represent so that it can be determined which documents are valuable and which are not.
3.1.2.4.4.3 KM Use Case Type (aka Graph DB)
Imagine the vast storage available within Hadoop as a clean white board that not only spans an entire wall of a large conference room, but as one that continues onto the next wall. To a great extent, Hadoop is such a white board, just waiting for Big Data architects to create an architecture within that massive area that will support new and/or existing types of use cases with new approaches and greater ease.
KM is a use case type that itself has many use case subtypes. To illustrate the extremes, let’s say the continuum of KM ranges from artificial intelligence use cases that require massive amounts of joins across massive amounts of data to collect information in milliseconds as input into various types of real-time processes, to use cases that require even more massive amounts of knowledge to be amassed over time and queried on demand within minutes. It is this latter end of the KM continuum that we will explore now.
This use case subtype begins with the ingestion of documents and records from around the globe into the bottom tier (aka Tier-1), including files, documents, e-mails, telephone records, text messages, desktop spreadsheet files, desktop word processing files, and so on.
Each one of the files ingested will create a standard wrapper around each part of discrete content consisting of a header and footer that houses metadata about the content, such as its:
■ frequency of extraction,
■ object type,
■ file type,
■ file format,
■ schema for structured data,
■ extraction date, and
■ ingestion date.
This bottom level of the Hadoop architecture framework can accommodate any number of documents, and with the metadata wrappers around them, they can be easily searched and indexed for inspection by applications that are driven by artificial intelligence techniques or by human SMEs. The essential point of the wrappers is that the metadata within those wrappers has oversight by a data dictionary that ensures metadata values are defined and well understood, such as file types and so on.
Another important way to think about the bottom layer of the architecture is that this layer houses “data,” as opposed to “information,” “knowledge,” or “wisdom.”
In contrast, the middle layer of this Hadoop framework (aka Tier-2) houses “information.” It houses information one fact at a time in a construct that is borrowed from the resource description framework (RDF), called “triples.” Triples are a subset of the RDF, which is a type of rudimentary data model for metadata that houses knowledge, in this particular case gleaned from the “data” collected in the bottom layer (see the below diagram).
Triples belong to a branch of semantics and represent an easy way to understand facts that are composed of three parts.
Each triple includes one:
■ predicate, and
■ object.
The “subject” of the triple is always a noun. Rules must be established to determine the setoff things that are permissible to use as a “subject.” The subject can be something as simple as a person or organization, or it may include places or things, as in a noun is a person place or a thing.
The “predicate” of a triple is always a trait or aspect of the “subject” expressed in relationship to the “object,” which is another noun. The set of permissible predicates must be appropriately managed to ensure that they are consistent, defined, and well understood. Rules must also be established to determine the setoff things that are permissible to use as an “object.”
This represents a collection of use cases that are closely aligned to intelligence gathering activities on individuals and organizations. The resulting KM capabilities offer a variety of commercial and government capabilities.
Imagine the applications for triples, such as:
■ “Peter” attends “downtown NYC WOW”
■ “Fred” “attends” “downtown NYC WOW”
■ “Peter” “makes-shipments-to” “Jim”
■ “Peter” “owns” “Firearms Inc.”
Although triples can be stored in HDFS, they can also be stored in HBase, or any other Big Data database using any effective technique or combination of techniques for accelerating storage and retrieval. There are competitions (e.g., IEEE) for being able to manage and effectively use billions of triples.
The top level of our Hadoop architecture contains our catalog and statistics about the other two layers of the architecture. It can reveal how many triples exist, how many times each predicate has been used including which ones have not been used, and so on. As such, the top level (aka Tier-3) contains knowledge about our information (Tier-2) and our data (Tier-1).
At a high level, this architectural framework supports the ingestion of data, while simultaneously building information about the data using “headless” processes and SMEs, for use by business users to ask questions about the information being gleaned by the “headless” processes and SMEs.
3.1.2.4.4.4 Data Warehousing (DW) Use Case Type
Data warehousing is a type of use case that usually requires a response to a query in the span of 3-5 seconds to an end user. The use case type of data warehousing refers to an extensive collection of use cases that involve content that usually involves structured data but may also involve unstructured, and/or semistructured data.
These can include use cases found within the industry sectors of:
■ loan underwriting
■ insurance fraud detection
■ insurance anti-money laundering (aka AML) detection
■ know your customer (aka KYC)
■ global exposure
■ science-based industries
■ pharmaceutical testing
■ pharmaceutical market research
■ genetics research
■ marketing
■ merger and acquisition (M&A) decision making
■ divestiture decision making
■ direct and mass marketing campaign management
■ customer analytics
■ government
■ intelligence community
■ human disease management
■ livestock disease management
■ agricultural disease management
Once the specific use case(s) of data warehousing (DW) have been identified, then one has the ability to start listing specific requirements. Similar to document management, the requirements for basic data warehousing also begins with simple things, such as the number of source systems, the topics of data, the size of the data, and the maximum number of rows, but it also continues into an extensive list that will determine the candidate Big Data products that one may choose from.
Potential data warehouse requirements include:
■ maximum data ingestion sources
■ maximum data ingestion rate
■ identifying the optimal source for each data point
■ data quality issues of each source
■ data standardization issues of each source
■ data format issues of each source
■ database structure issues of each source
■ data integration issues of each source
■ internationalization (e.g., Unicode, language translation)
■ index support
■ drill downs
■ sharding support
■ backup and restorability
■ disaster recoverability
■ concurrent users
■ query access path analysis
■ number of columns being returned
■ data types
■ number of joins
■ multi-data center support
In fact, the potential list of requirements for data warehousing can also extend into every nonfunctional type of requirement listed in the nonfunctional requirements section discussed later in this book.
Needless to say, there are many Big Data products in the space of data warehousing on both the Hadoop and non-Hadoop side of the fence, each with their own limitations on data size, number of keys, index ability, retrieval speed, ingestion rates, and ability to support concurrent users.
3.1.2.4.4.5 Real-Time Analytics Use Case Type
Real-time analytics is a type of use case that usually requires a response to a query in the span of 1-5 seconds to an end user, or a response in milliseconds to an automated component which may deliver its response directly to an end user or a fully automated process. The use case type of real-time analytics refers to an extensive collection of use cases that involve content that usually involves structured data but may also involve unstructured and/or semistructured data.
These can include use cases found within the industry sectors of:
■ operational risk
■ operational performance
■ money desk cash management positions
■ securities desk securities inventory (aka securities depository record)
■ financial risk
■ market risk
■ credit risk
■ regulatory exception reporting
■ trading analytics
■ algorithmic trading (i.e., older versions of algorithmic trading)
■ real-time valuation
■ government
■ homeland security
■ human disease management
■ marketing
■ dynamic Web-based advertising
■ dynamic smartphone-based advertising
■ dynamic smartphone-based alerts and notifications
■ social media monitoring
Once the specific use case(s) of real-time analytics have been identified, then one has the ability to start listing specific requirements for the applicable use cases. Similar to document management and data warehousing, the requirements for basic real-time analytics begin with simple things, such as the number of source systems, the volume of data, the size of the data, and the maximum number of rows, but it also continues into an extensive list that will determine the candidate Big Data products that one may choose from.
Potential real-time analytics requirements include:
■ types of real-time data analytics
■ number of concurrent dashboards
■ number of concurrent pivots
■ number of concurrent data mining requests
■ number of concurrent advanced analytics
■ maximum space required
■ maximum data ingestion sources
■ maximum data ingestion rate
■ identifying the optimal source for each data point
■ number of additional metrics to be generated
■ temporal requirements for additional metrics to be generated
■ data quality issues of each source
■ data standardization issues of each source
■ data format issues of each source
■ database structure issues of each source
■ data integration issues of each source
■ internationalization (e.g., Unicode, language translation)
■ index support
■ drill downs
■ sharding support
■ backup and restorability
■ disaster recoverability
■ concurrent users
■ query access path analysis
■ number of columns being returned
■ data types
■ maximum number of joins
■ multi-data center support
Again, the potential list of requirements for real-time analytics can also extend into every nonfunctional type of requirement listed in the nonfunctional requirements section discussed later in this book.
There are many Big Data products in the space of real-time analytics, although at present they are mostly on the non-Hadoop side of the fence, each with their own limitations on data size, ingestion rates, retrieval speed, costs, and ability to support concurrent users.
In fact, the usual suspects in this use case type include:
■ HP Vertica,
■ Greenplum, and
■ Teradata.
3.1.2.4.4.6 Predictive Analytics Use Case Type
Predictive analytics is a type of use case that usually requires a response to a query in the span of milliseconds or nanoseconds to an automated component which may deliver its response directly to an end user or a fully automated process when the predictive analytic is fully operationalized.
The use case type of predictive analytics refers to an extensive collection of use cases that involve some set of predictive data points that are being rendered to a statistical or nonstatistical mathematical model, or high-speed CEP engine.
These can include use cases found within the industry sectors of:
■ capital markets fraud detection
■ wholesale banking fraud detection
■ retail banking fraud detection
■ market risk forecasting
■ market opportunity forecasting
■ operational defect forecasting
■ marketing
■ customer lifetime value (LTV) scoring
■ customer defection scoring
■ customer lifetime event scoring
■ government
■ terrorist group activity forecasting
■ terrorist specific event forecasting
■ engineering and manufacturing
■ equipment failure forecasting
■ commerce
■ open source component forecasting
■ 3D printer component design forecasting
■ employee collusion forecasting
■ supplier collusion forecasting
■ customer collusion forecasting
Once the specific use case(s) of predictive analytics have been identified, one has the ability to start listing specific requirements for the applicable use cases. Similar to prior use case types, the requirements for predictive analytics begins with simple things, such as the number of sources, the volume of data, the size of the data, and the maximum number of rows, but again it continues into an extensive list that will determine the candidate Big Data products that one may choose from.
Potential predictive analytics requirements include:
■ transaction rates within the operational system
■ learning set size
■ learning set updates
■ traceability
■ integrate ability
■ deploy ability
Again, the potential list of requirements for predictive analytics can also extend into every nonfunctional type of requirement listed in the nonfunctional requirements section discussed later in this book.
There are many Big Data products in the space of predictive analytics; they are mostly on the non-Hadoop side of the fence, each with their own limitations on operational execution speeds, learning rates, result accuracy, and result traceability.
As a sampling among the entrants for this use case type include:
■ Fair Isaac’s HNC predictive models offering,
■ Ward Systems,
■ Sybase CEP engine, and
■ SAS CEP and statistical package offering.
3.1.2.4.4.7 Algorithm-Based Use Case Type
Algorithm based is a type of use case that does not require real-time or near real-time response rates.
The use case type of algorithm-based Big Data refers to an extensive collection of use cases that involve some set of advanced algorithms that would be deployed by quants and data scientists.
These can include use cases found across industries (e.g., science-based industries, financial services, commerce, marketing, and government) involving the following types of algorithms:
■ matrix vector multiplication,
■ relational algebraic operations,
■ selections and projections,
■ union, intersection, and difference,
■ grouping and aggregation,
■ reducer size and replication rates,
■ similarity joins, and
■ graph modeling.
If these sound strange to you, and there are many more that are even more unusual, I would not worry, as these terms are generally used by experienced quants and/or data scientists.
The types of candidate requirements that one encounters in this specialized area are generally the set of formulas and algorithms that will support the required function.
Some options for this use case type include:
■ IBM Netezza for hardware-based algorithms,
■ Hadoop HDFS for advanced MapReduce capabilities, and
■ Hadoop HBase also for advanced MapReduce capabilities.
3.1.2.4.4.8 Online Transaction Processing (NewSQL/OLTP) Use Case Type
Online transaction processing (NewSQL/OLTP) is a type of use case that usually requires a response to a query in the span of 1-3 seconds or milliseconds to an automated component which may deliver its response directly to an end user or a fully automated process.
The use case type of NewSQL OLTP refers to a collection of use cases that involve some set of transaction processing involving Big Data volumes of data and/or transaction rates.
These can include use cases found within the industry sectors of:
■ global Web-based transaction systems
■ global inventory systems
■ global shipping systems
■ consumer Products and Services
■ in-home medical care systems
■ marketing
■ RFID supply chain management
■ Opportunity-based marketing
■ smartphone and tablet transaction systems
■ Google glasses applications
■ government
■ homeland security
Additional nonfunctional requirements can include:
■ peak transactions per second
■ maximum transaction lengths
■ system availability
■ system security
■ failover
■ DR
■ complex transaction access paths
■ internationalization (e.g., Unicode and language translation)
■ full text search
■ index support
■ sharding support
The potential list of requirements for NewSQL OLTP can also extend into any number of nonfunctional type of requirement listed in the nonfunctional requirements section discussed later in this book.
There are several Big Data products in the space of NewSQL OLTP.
Among the candidates for this use case type are:
■ Clustrix,
■ Google Spanner,
■ NuoDB,
■ SQLFire, and
■ VoltDB.
3.1.2.4.4.9 Batch Analytics Use Case Type
Batch analysis is a type of use case that usually requires a response to a query in minutes or hours.
The use case type of batch analysis refers to a collection of use cases that involve volumes of data reaching into the petabytes and beyond.
These can include use cases found within the industry sectors of:
■ anti-money laundering
■ insurance fraud detection
■ credit risk for banking
■ portfolio valuation
■ marketing
■ market analytics
■ government
■ terrorist activity forecasting
■ terrorism event forecasting
■ science-based
■ commerce
■ employee collusion detection
■ vendor collusion detection
■ customer collusion detection
The batch analysis type of use case is often the least costly type of use case as it often has fixed sets of large amounts of data with ample time for Big Data technologies to work the problem.
That said, the potential list of requirements for batch analytics can also extend into any number of nonfunctional type of requirement listed in the nonfunctional requirements section discussed later in this book.
There are several Big Data products in the space of batch analytics.
Among the candidates for this use case type are:
■ Hadoop HBase.
3.1.2.4.4.10 GIS Use Case Type
GIS is a type of use case that ranges from batch to real time.
The use case type of GIS refers to a collection of use cases that involve Big Data volumes of data reaching into the terabytes of geographical information and beyond.
This can include use cases involving:
■ emergency service
■ crime analysis
■ public health analysis
■ liner measures event modeling
■ roadway projects
■ traffic analysis
■ safety analysis
■ routing
■ towing services
■ snow removal services
■ refuse removal services
■ police, fire, and ambulance services
■ topological
■ elevation data
■ orthophotography
■ hydrography
■ cartography
■ hazardous materials tracking
■ taxable asset tracking (e.g., mobile homes)
The GIS type of use case includes nonfunctional requirement types, such as:
■ ACID compliance
■ full spatial support (i.e., operators involving physical proximity)
■ inside
■ between
■ behind
■ above
■ below
■ flexibility
That said, the potential list of requirements for batch analytics can also extend into any number of nonfunctional type of requirement listed in the nonfunctional requirements section discussed later in this book.
There are several products in the space of GIS analytics.
Among the candidates for this use case type are:
■ PostGIS
■ geographic support
■ built on PostgreSQL
■ Oracle Spatial
■ spatial support in an Oracle database
■ GeoTime
■ temporal 3D visual analytics (i.e., illustrating how something looked over time)
3.1.2.4.4.11 Search and Discovery Use Case Type
Search and Discovery is a type of use case that usually requires a response to a query or many subordinate queries in the span of 1-3 seconds or milliseconds.
The use case type of Search and Discovery refers to a collection of use cases that involve some set of searching involving Big Data volumes of data.
These can include use cases found across industries involving:
■ internal data source identification and mapping
■ external data source identification and mapping
■ discovery (i.e., searching for data categories across the data landscape of a large enterprise)
■ e-discovery
There are few competitors in this space, including:
■ Lucidworks (i.e., built on Solr with an enhanced GUI for common use cases)
■ Solr
■ Splunk (i.e., for machine generated output)
3.1.2.4.4.12 Relational Database Technology in Hadoop Use Case Type
In contrast to the technique of a relational database management system operating outside Hadoop, such as SQL Server Polybase with access to data within HDFS using something like Hive, Pig, or Impala, a relatively recent type of use case is that of supporting a full relational database capability within and across a Hadoop cluster.
This use case type is particularly interesting as it facilitates real-time queries over extremely large relational databases to be deployed across a Hadoop cluster in HDFS, using MapReduce behind the scenes of a standard SQL interface.
There are few competitors in this space as well including:
■ Splice Machine (full SQL), and
■ Citus Data (append data only).
The architecture of this class of product is that it essentially requires software on each node of the Hadoop cluster to manage the SQL interface to the file system.
There are several advantages of this use case type especially where full SQL is supported, including:
■ use of existing SQL trained personnel,
■ ability to support extremely large relational database tables,
■ distributed processing that leverages the power of MapReduce,
■ a full complement of SQL capabilities, including
■ select, insert, update, and delete
3.1.2.4.4.13 Big Data Is Use Case Driven—Summary
The most important point I hope you take away here is that approaching Big Data tool selection from the tool side, or trying to make one product support the needs of all use cases, is clearly the wrong way to address any problem.
It would be like a pharmaceutical company suggesting on television that you try a particular drug that they manufacture for any and every aliment you have, when you need to begin by consulting a physician with the symptoms and then work toward a potential solution that meet your particular set of circumstances, such as not creating a conflict with other medications you may already be taking.
Unfortunately, the tool approach is too frequently adopted as people have a tendency to use the one or few tools that they are already familiar or enamored with. As architects, we should never bypass the step of collecting requirements from the various users, funding sources, and numerous organizational stakeholders.
Those who adopt a tool as their first step and then try to shoehorn it into various types of use cases usually do so to the peril of their organization. The typical result is that they end up attempting to demonstrate something to the business that has not been properly thought through. At best, the outcome is something that is neither as useful and as cost-effective as it could have been, nor as useful an educational experience for the organization that it could have been. At worst, the outcome represents a costly exercise that squanders organizational resources and provides management with a less than pleasant Big Data technology experience.
That said, there is much value in exercising a variety of Big Data tools as a means to better understand what they can do and how well they do it. New products in the Big Data space are being announced nearly every month and staying on top of just the marketing information perspective of each product requires a great deal of knowledge and energy. More important than the marketing materials however is the ability to understand how these products actually work and the ability to get the opportunity to experiment with the particular products in which the greatest potential utility exists to meet your needs.
If you have a Big Data ecosystem sandbox at your disposal, then you are in luck within the safety of your own firewalls, but if you are not fortunate enough to have a Big Data ecosystem sandbox at your disposal, then the next best thing or possibly better is to be able to rent resources from a Big Data ecosystem sandbox externally to your enterprise, such as from Google, Amazon, or Microsoft, where you may be able to rent access to whatever Big Data product(s) you would like to experiment with using your data in a secure environment.
3.1.2.4.5 Organizing Big Data into a Life Cycle
The landscape of Big Data tools is reminiscent of when DOS commands were the only command interface into the world of the personal computer. At that time, humans had to mold their thinking to participate in the world of the computer, whereas Finder and Windows eventually molded the computer to what humans could instinctively understand so that it could interact more effectively in our world.
Although the landscape for Big Data will continue to rapidly evolve into the near future, its proper deployment will continue to be anything but trivial for some time into the future. Before we get into what a proper deployment model looks like, let’s first look at an “ad hoc” deployment model.
3.1.2.4.5.1 Ad hoc Deployment
Each ad hoc deployment is actually quite simple, at least initially. It generally begins with the identification of a possible use case.
The use case that is chosen is usually an interesting one that advertises to solve some problem that could not previously be solved, such as the challenge of consolidating customers across an area of an insurance company, where the number of insurance policy applications makes it particularly labor intensive to consolidate each additional few million customers on a roadmap to a hundred million customers.
A popular big data database tool is chosen, such as MongoDB or Cassandra, and a partial solution is achieved within a 6-month time frame with relatively low cost and effort. We all know the way this story continues. It is increasingly difficult and expensive to compete the customer consolidation effort, so folks lose interest in that project and then start looking for the next ad hoc big data project.
This ad hoc process is repeated for either the same use case in other countries and for new use cases, all of which also achieve partial solutions within short time frames with relatively low cost and effort. As we advance forward in time, we find ourselves with numerous partially completed efforts cluttering the IT landscape, with each delivering great business benefit to small pockets of customers and business users across that as an aggregate are ultimately inconsequential to the overall capabilities and efficiency of the organization.
3.1.2.4.5.2 Big Data Deployment
Big Data deployment should be driven by a set of principles that serve to help frame the discussion.
Big Data deployment principles include:
■ deployment of big data technologies follow a defined life cycle
■ metadata management is a consideration at each step of the life cycle
■ iterations of a big data life cycle generate lessons learned and process improvement
■ projects involving Big Data must adhere to the same ROI standards as any other
■ deployments of Big Data require the same if not additional governance and oversight
■ Big Data should leverage shared services, technologies, and infrastructures
■ operational frameworks should quarantine business users to only “approved” use cases
Now that we have a basic set of principles to help provide considerations for the deployment of Big Data, we will organize our discussion into sections for:
■ Build, and
■ Operate.
3.1.2.4.5.3 Big Data Deployment—Plan
The “Plan” phase of Big Data begins with business selecting the business use case type(s) that they need to advance the business in the direction they wish to go or to address specific a business pain point. Either way, they will need to quantify the business value of what they wish to accomplish.
Associated with business use case type(s), there are a list of technologies that specialize within that area of Big Data. Although the list of technologies is constantly evolving with new licensed and open source possibilities, that list should be reassembled every couple of months.
If products that have been incorporated into the Big Data ecosystem are no longer the better choice, a retirement plan will have to be developed to decommission it from the ecosystem. Given the fact that Big Data technologies are so volatile, the process of decommissioning products should become a core competence of every organization that does not wish to accumulate an inventory of young yet obsolete products, and its associated infrastructure.
At this juncture, the business in partnership with enterprise architecture must identify the nonfunctional requirement types that must be provided for use case types under consideration distinct from the nonfunctional requirement types that are merely nice to have (see the section 8.1.1).
Given the nonfunctional requirement types that are unambiguously required, candidate technologies will be disqualified as unable to support mandatory nonfunctional requirement types. The product or products that remain should be fully eligible to address the particular Big Data use case types. If more than one product is eligible, then they should all continue through the process to the ROI assessment.
In the event that new Big Data technologies must be introduced into the ecosystem, the architecture team should develop frameworks to incorporate the new Big Data technology into the ecosystem, and the operations area should be consulted to begin determining the new support costs for the eligible technologies.
The activities up to this point are supported by the business area, enterprise architecture, and operations staff as part of the services that they provide, and may not be a formal project.
By this time however, a project with a project manager should be formed encompassing the following activities under a modest planning budget:
■ specific business use cases are determined by business analysts
■ business value is determined for each business use case by business
■ business requirements are recorded by business analysts
■ candidate systems of record are identified as potential data sources
■ specific business users and/or business user roles are identified for each use case
■ interests of various stakeholders are incorporated into standards
■ compliance
■ legal
■ chief data officer
■ assess the capacity of the environment
■ operations provides costs and schedules for
■ adding capacity to an existing Big Data technology or
■ standing up a new technology
■ business analysts identify specific sources of data to support each use case
– data will be fully refreshed each time
– data will be appended to existing data
– data will be updated
– data will be deleted
■ eligible technologies undergo an architecture ROI assessment
■ stakeholders assess the implications of the particular combination of data sources
■ auditing
■ compliance
■ chief data officer
■ data owner
■ approval to leverage data from each data source for each use case is acquired
■ auditing
■ compliance
■ chief data officer
■ data owner
■ detailed nonfunctional requirements are recorded by business analysts
■ enterprise architecture presents product recommendation
■ vendor management determines cost associated with
■ product licensing and/or open source support
■ training
■ architecture ROI is leveraged to complete the ROI analysis
■ finance ROI
■ product selection is finalized
■ IT management
■ identify funding requirements for
– software costs (e.g., licenses and/or open source support agreements)
– hardware costs
– data owner application development (AD) support
• data transport to landing zone
– Big Data application development (AD) team support
• determine whether files will be encrypted
• determine whether files will be compressed
• metadata data quality checks
• field data types and lengths are present
• file data quality checks
• record counts and check sums
• special character elimination
• row-level data quality checks
• metadata row-level validations
• prime key validations
• prime foreign key validations
• foreign key validations
• column data quality checks
• data cleansing
– range and min-max edits
• data standardization
• data reformatting/format standardization
• data restructuring
• data integration/data ingestion
– testing and migration team support
– Big Data architecture support
– Big Data operations setup
– helpdesk setup
– business support costs
■ operate phase
– ongoing helpdesk support
– business operational costs
■ future decommission phase
■ present the project to the planning board
■ funding assessment
■ funding rejection
■ returned for re-planning
3.1.2.4.5.4 Big Data Deployment—Build
The “Build” phase of Big Data begins with an overall project manager coordination multiple threads involving oversight and coordination of the following groups, each led by a domain project manager:
■ operations—operations project manager,
■ vendor(s)—vendor project manager(s),
■ business—business project manager,
■ data source application development teams—data source AD team project manager(s),
■ Big Data application development team—Big Data AD team project manager, and
■ test/migration team—test/migration team project manager.
The operations team supports the creation of a development, user acceptance test (UAT), and production environment with the capacity required to support the intended development and testing activities. Prior to production turnover operations will test system failover, and the various other operational administrative tasks that fall to them.
Vendors support the architecture, design, and implementation of the products they support, including installation and setup of the software in the development, UAT, production environment, and the training and mentoring of business users and IT staff in the use and administration of the product, and participate in the testing of operational procedures for the administration of the system.
Business supports the business analysts and the Big Data AD team in their efforts to profile the data so that data cleansing, data standardization, data reformatting, and data integration decisions can be made to best support the needs of the business for their use cases. During this process, business will also identify the metadata and metrics about process that will help accomplish their objectives. The business will also test the set of administrative functions that they are responsible for to support their use cases.
Ultimately, business must evaluate the extent to which data quality checks of each type should be performed based upon the use case, its business value, and business data associated with each use case.
The data source AD team(s) support the identification of required data within their source systems and then develop the software to extract the data either as a one-time effort or in accordance with the schedule of extracts to meet the needs of one or more specific use cases that have been approved. The data is then transported to the required location for additional processing by the Big Data AD team.
The Big Data AD team coordinates the receipt of data from the various data owners and works with the business and business analysts to profile and process the data for ingestion into the Big Data product set in the development environment. Once the appropriate metadata and metrics are also identified and collected, this AD team will conduct unit testing to ensure that the various components of data and technology can perform their function. When unit testing is complete, the data and software are passed to the test and migration team as a configuration of software and data. The Big Data AD team will also test the set of administrative functions that they are responsible for to support the Big Data capabilities.
The test and migration team accepts the data and software from the Big Data AD team and identifies the components as a configuration that will undergo user acceptance testing and then migration to production. Prior to this however, the test migration team works with the business and business analysts to develop a test plan that will ensure that all of the components operate together as they should to support each and every use case.
The configuration management components of the Big Data project include:
■ software products that are used including their versions
■ applications including
■ Flume interceptors
■ HBase coprocessors
■ user-defined functions
■ software syntax
■ parameters and associated software product or application
■ programming code and associated software product or application
■ data transformation code
– field-level cleansing and edits
– data standardization
– reformatting and restructuring
■ inbound data sources and outbound data targets
■ schemas including their versions
■ approved business use cases
■ complete description of each use case
■ description of permissible production data
■ individual approver names and dates
Once the system has been tested by business users and possibly business analysts in the user acceptance environment, the test results are reviewed by the various stakeholders. Included within these tests are test cases to confirm the appropriate nonfunctional requirements of the Big Data application have been met, such as security, usability, and data obfuscation requirements.
These overall lists of stakeholders that must render their approval include:
■ business users who participated in testing each use case
■ IT development management,
■ legal,
■ auditing,
■ compliance,
■ chief data officer,
■ data owner(s) of the sourced data,
■ test and migration management, and
■ IT operations management
3.1.2.4.5.5 Big Data Deployment—Operate
The “Operate” phase of Big Data begins with the “go live” decision of the stakeholders, where the various components of the configuration are migrated from the configuration management folders representing UAT environment to the production environment including the data used in UAT. Once migrated, an initial test is performed in production to test the production infrastructure including startup and shutdown, job scheduling capabilities, and the administrative functions that each respective area is responsible for.
If critical issues arise, the system may remain unavailable for production use until at least the critical issues are resolved.
When successful, the data used for testing will be removed and a full complement of production data will be introduced using the normal operational processes associated with production. At this point, the production system is made available for production operation for use by the business.
3.1.2.4.5.6 Big Data Deployment—Summary
The important thing to note after following a proper Big Data deployment plan is that the appropriate stakeholders have confirmed that the compliance and regulatory needs have been met, and that the proper audit controls have been put in place.
At this point, if there is an audit from a regulator, everyone has performed the due diligence required of them, including the approval of specific use cases, use of specific data sources, and most importantly the combination of specific data sources and data for use in specific use cases.
There are quite a number of considerations and complexities when establishing Big Data development, integration test, UAT, and production environment, and few vendors with a handle on this space that would be suitable for a financial services company or large enterprise with rigorous regulatory oversight and mandates across the globe.
3.1.2.4.6 Metadata of a Big Data Ecosystem
There are 20 basic topic areas of metadata that pertain to Big Data, and within those, there are hundreds of metadata data points.
The basic topic areas of Big Data include:
■ use case planning/business metadata,
■ use case requirements metadata (e.g., data and applications),
■ internal data discovery metadata/locating the required data across the enterprise,
■ external data discovery metadata/locating the required data from external data providers,
■ inbound metadata,
■ ingestion metadata,
■ data persistence layer metadata,
■ outbound metadata,
■ technology metadata,
■ life cycle metadata,
■ operations metadata,
■ data governance metadata,
■ compliance metadata,
■ configuration management metadata,
■ team metadata (e.g., use case application team, technology provisioning application team, data provisioning application team)
■ directory services metadata,
■ ecosystem administrator metadata,
■ stakeholder metadata,
■ workflow metadata, and
■ decommissioning metadata.
As a sampling of the metadata contained within, let’s explore the first several topics of metadata.