
C H A P T E R 11
Code Analysis
This chapter provides an overview of many static and dynamic tools, technologies, and approaches, introducing both general technologies and specific tools with an emphasis on improvements they can suggest and how they can provide continuous, automated monitoring.
Software improvements are the result of a three-phase cycle: Analyze, Improve, and Monitor. Figure 11-1 presents a conceptual model for this cycle. The Analyze phase is about understanding the situation. The Improve phase is about taking action based on the conclusions of that analysis. The Monitor phase involves the recurring activities that prompt further analysis. This cycle is not a rigid methodology of discrete phases but a framework for ongoing software improvement.
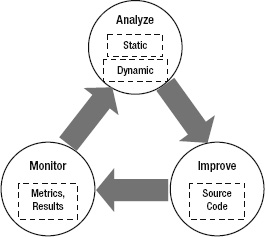
Figure 11-1. The Analyze, Improve and Monitor phases
The system is analyzed in two primary ways: static analysis and dynamic analysis. With static analysis the system is evaluated without needing to run the program. This is done by inspecting the source code, the assemblies, or other components of the system. Dynamic analysis requires the system to run while the memory usage, performance timings, executed queries, or other profile of the system is captured. Dynamic analysis often takes place by analyzing the data after the run or by comparing two previous runs that took place at different times or under different conditions. An effective Analyze phase points out areas for investigation and improvement.
In the Improve phase source code changes suggested either directly or indirectly in the Analysis phase are made. Improvements to the architecture, design, or other aspects of the system also happen at this point. Tuning, refactoring, and remediation are all implemented within the Improve phase.
The Monitor phase may consist of informal or scheduled code reviews or system testing. Monitoring can be either objective or highly subjective, but the usual outcome is that analysis takes place. For example, if system testing reveals unacceptably slow load times then, as a result, the development team initiates performance analysis. Ideally, there ought to be established metrics and expected results with deviations from the acceptable limits triggering analysis. The best monitoring involves both manual and exploratory review coupled with frequent, structured assessment. The Monitoring phase should use components that are continuous and automated.
The concept of the application lifecycle management (ALM), as presented and discussed in Chapter 2, covers seven important aspects of software development: requirements, design, coding, testing, deployment, maintenance, and project management. These aspects repeat during the stages of any iterative and incremental methodology. As an individual developer or team leader, you will find yourself playing a role, to varying degrees, in each of these aspects of the lifecycle. In this chapter, tools and techniques will be linked to the overall story of ALM by describing which member of the development team would use each tool and technique and at which stage in the lifecycle.
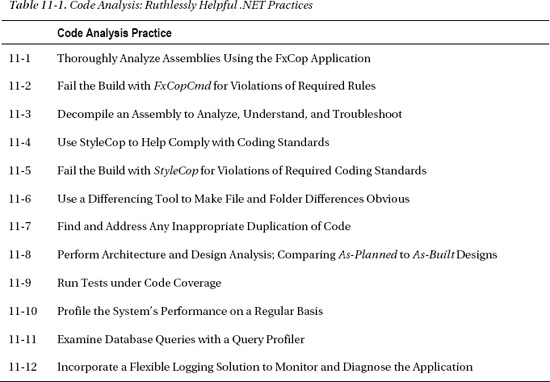
This chapter will introduce and emphasize two specific tools: FxCop and StyleCop. Both of these tools are particularly helpful with respect to maintainability, which is an important theme in this book. The list of practices covered in this chapter is summarized in Table 11-1.
Case Study
You are a .NET developer at Lender Inc. working on the next generation of the Student Loan Origination System (SLOS) software application.
__________
1 Review the metaphor and consequences of “Technical Debt” described in Chapter 2.
BACKGROUND
Your plan is to use static and dynamic analysis tools to assess the situation and find issues to take to the project manager. You start this analysis by
- Using FxCop to enforce the .NET Framework Guidelines
- Using StyleCop to enforce the coding standards
- Using Visual Studio Code Metrics to compute code metrics
- Using Visual Studio to profile performance and memory usage
Your plan also includes monitoring within the build process, breaking the build if there are any violations of already raised issues.
Static Analysis
Static analysis looks at the code and the assemblies while they are “at rest.” Static analysis does not require the program to run. For source code, static analysis is able to determine how well the code follows a set of coding standards. For assemblies, static analysis determines how well the assemblies follow accepted rules for .NET managed code. When the code or the assemblies do not meet expectations the result is a list of violations that reference the standard or rule that is violated. These rules, guidelines, recommendations, and standards come from various sources that may include the following:
- Microsoft's .NET Framework Design Guidelines
- C# coding standards
- Code quality formula
- System architecture and design documents
The purpose of static analysis is to answer important questions about how well the software is built. These questions may include the following:
- Is the code easy to read and maintain?
- Is the complexity of the code under control?
- Do the assemblies perform well?
- Is the code dependable and secure?
- Are best practices and system design objectives being followed?
- Does the system have the desired structure?
Static analysis takes either the source code or the assemblies as input for analysis. Based on these inputs the tool evaluates one or more of the following aspects:
- Adherence to library development guidelines
- Readability, maintainability, and coding standards
- Code quality metrics
- As-built design, structure, and dependencies
MSDN offers the Design Guidelines for Developing Class Libraries for development focused on building .NET reusable libraries.2 Frameworks and assemblies intended to reach a broad number of .NET developers should follow these guidelines. FxCop is a tool that performs this analysis.
__________
2 The .NET Framework guidelines are presented in Krzysztof Cwalina and Brad Abrams, Framework Design Guidelines: Conventions, Idioms, and Patterns for Reusable .NET Libraries, Second Edition (Upper Saddle River, NJ: Addison-Wesley Professional, 2008).
Coding standards are intended to improve readability, consistency, and maintainability. StyleCop defines a widely-used coding standard. StyleCop is a static analysis tool that provides developers an effective way to follow the coding standard. It also gives projects a way to customize and report violations of the coding standard.
There are many tools available to calculate code metrics for your .NET code. If you have Visual Studio 2010 Ultimate or Premium then you already have the means to calculate code metrics. These tools provide a way to monitor code quality as part of the build process.
Static analysis tools that evaluate the system architecture and design reveal the structure, design, and dependencies of the built system. The analysis work involves matching up the system design as it is built to the intended design. The individual developer uses static analysis while coding to ensure that the development work is consistent with the design objectives. The team leader uses static analysis to review and monitor the team's development work against design objectives. Improvements come by resolving the differences and making decisions about whether to conform to the design or change the design to reflect a better choice.
Assembly Analysis
After the source code is built it is possible to explore and analyze compiled .NET assemblies. The processes of assembly inspection, disassembling, and decompiling generally describe the techniques to explore and analyze assemblies. It is useful to examine assemblies for the purposes of analysis to support the following:
- Investigate a compiled assembly and use rules to determine if guidelines are violated.
- Inspect an assembly to browse classes, methods, and properties, and decompile to equivalent C# code.
One approach is to disassemble the assembly file by reading the bytes and converting the bytes into the Microsoft intermediate language (IL). In effect, this reverses the packaging actions of Ilasm.exe. Within the program database (PDB) file are mappings between IL and source code, names of local variables, and other source-level debugging information. Even without the PDB, a decompiler can parse the IL, reverse-engineering it into statements and blocks, and ultimately translating it into C#, or some other higher-level language.
FxCop
The Visual Studio Code Analysis tool, available in Ultimate and Premium editions and through Team Foundation Server, can reveal potential quality issues in the code.3 There are many rules organized into rule sets targeted to specific goals, such as enforcing best practices for maintainable code. This static code analysis facility is integrated into these versions of Visual Studio and Team Foundation Server. For those who do not use Visual Studio Ultimate or Premium then Microsoft's FxCop application is available. If the build server is not Team Foundation Server then FxCopCmd can run this analysis within build and CI processes. Both the Visual Studio Code Analysis tool and FxCop are founded upon a body of guidance that is generally referred to as the .NET Framework Guidelines.
Microsoft developed the.NET Framework Design Guidelines for Developing Class Libraries to help develop better .NET software internally. The guidelines were published and the Microsoft tool that checked compliance to the guidelines, FxCop, was also made available. Initially, the FxCop application was a stand-alone tool set. Now, available in Visual Studio 2010 Ultimate and Premium editions under the project Code Analysis tab, in the project's properties. After a .NET managed code assembly is built, either Code Analysis or FxCop inspects the assemblies to determine if any of the configured rules are violated.
__________
3 Learn more about analyzing code by using Code Analysis at MSDN: http://msdn.microsoft.com/enus/library/dd264939.aspx.
The latest version of FxCop, both an application and a command-line tool, can be used for analysis outside Visual Studio and as part of the automated build processes. The latest version of the FxCop setup program is part of the Microsoft Windows SDK for Windows 7 and .NET Framework 4 version 7.1 (see the Introduction for details on pulling out the FxCop setup).
This section is not intended to walk you through FxCop and explain how to use the application; there are books and Internet postings with good examples and walkthroughs describing how to use FxCop. The focus of this section is on using FxCop as part of a code analysis, improvement, and monitoring strategy. For example, FxCopCmd generates a report that can be used to monitor violations and fail the build if critical violations occur.
![]() Note If you are not familiar with the FxCop application, take some time to learn more about FxCop. Appendix A provides a list of resources for learning and using FxCop.
Note If you are not familiar with the FxCop application, take some time to learn more about FxCop. Appendix A provides a list of resources for learning and using FxCop.
For the SLOS project, the plan is to create two FxCop projects. One project is configured to reveal all violations based on the rules defined by Microsoft's Minimum and Recommended .NET Framework Guidelines.4 The second targets only the Lender.Slos.Financial.dll assembly developed by GC and uses only the rules that have already been raised by the project manager. These raised rules are part of the mandatory rules that GC must follow.
![]() Practice 11-1 Thoroughly Analyze Assemblies Using the FxCop Application
Practice 11-1 Thoroughly Analyze Assemblies Using the FxCop Application
The FxCop application provides a way to understand the broad condition of the managed code assemblies and various ways to drill into the details of each rule violation. The FxCop desktop application allows you to define a project and select the target assemblies to analyze. You can specify the rules that ought to be followed, specific to your project. You can run the analysis to reveal and explore the violations occurring within the project. You can evaluate the violations and report or suppress the violations based on their priority and significance to the project. Project priority and significance are important; for some projects, for example, globalization rules may be critical. On the Financial Rewrite project they are not.
FxCop provides both a tool to analyze the software and detailed guidance on where and how to improve the source code. It provides the means to monitor the situation with reports and metrics. Many CI servers provide the facilities to display FxCop output as html reports. However, there are real challenges to using FxCop within the build process. The objective is to fail the build if the critical rules are violated.
__________
4 MSDN provides the Microsoft Minimum Recommended Rules Code Analysis Rule Set: http://msdn.microsoft.com/en-us/library/dd264893.aspx.
With brownfield applications it is not realistic to fail the build when any FxCop violation occurs.5 There are simply too many rules in which the priority and significance vary widely from rule to rule, from project to project. However, “mandatory” rules can be established that, if violated, ought to fail the build. Even early in a greenfield project, not every FxCop rule should be mandatory; some are simply not relevant to that project. MSDN provides guidance on various rule sets, such as basic correctness and extended design. It is best to take a wide-reaching set that includes all potentially relevant rules. As the project proceeds, specific rules will become voluntary as the priority and significance decrease. You can still track violations of the voluntary rules in a separate FxCop project, but only allow mandatory rule violations to fail the build. The mandatory rules should include
- Rules that are critical to the project and focus on important problems
- Rules where violations have been resolved and recurrence needs to stop
- Relevant and significant rules that are currently not being violated
For the SLOS project, the plan is to create an FxCop project that targets only the Lender.Slos.Financial.dll, which is developed by GC. The mandatory rules that the project uses are those rules that have been raised as an issue. This project starts with the first three rules reported to GC by the project manager and slowly grows, adding in new rules week-by-week as the mandatory rules that GC must follow are detailed. Once all the rules currently violated are configured in the FxCop project file then all the remaining rules in the Microsoft Minimum Recommended Rules Code Analysis Rule Set are added. Throughout this time, the FxCop project file is used by the command-line tool to analyze the targets and generate the report.
The real trick comes in failing the build when only the mandatory rules are violated. By design, the command-line tool is intended to automate the analysis and reporting performed by FxCop. However, FxCop does not evaluate the output; it reports. FxCop cannot interpret the relevance and significance of the project's rules. Thankfully, the primary FxCop output is an XML file, which the build script can evaluate and then fail the build if FxCop reports mandatory rule violations.
For the remainder of this section, let's walk through and discuss the general approach to failing the build when mandatory rules are violated.
__________
5 Brownfield application development ought to have a “technical debt” reduction plan as described in Chapter 2, including arrangements to reduce FxCop violations over time.
WALKTHROUGH: FAILING THE BUILD FOR FXCOP VIOLATIONS
When FxCop is opened, the project is defined by selecting the Targets to analyze. For the Financial Rewrite project there is only one target assembly, Lender.Slos.Financial.dll.
- To begin, launch FxCop and choose Project
 Add Targets …
 - Add the
Lender.Slos.Financial.dllassembly by browsing to the folder containing the assembly. The result is shown in Figure 11-2.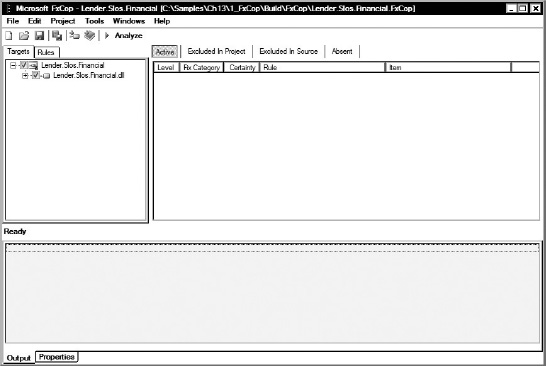
Figure 11-2. The FxCop target assembly
Lender.Slos.Financial.dlladded to the project - To set the project options, select Project Options …
- In the first tab (General), provide a project name of Lender.Slos.Financial. Within the “Save messages” area uncheck the checkbox next to Active. Unchecking this option prevents the active violations from being saved to the project file. This is shown in Figure 11-3.
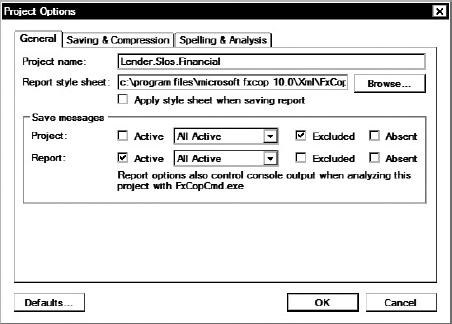
Figure 11-3. The General options tab in FxCop Project Options dialog box
 Note The second tab on the Project Options dialog is Saving & Compression. No changes are needed on this tab.
 - In the third tab (Spelling & Analysis), change the project options to those shown in Figure 11-4.
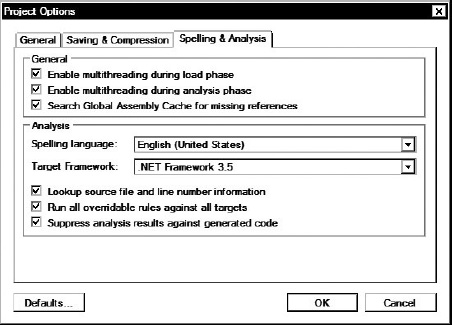
Figure 11-4. The Spelling & Analysis options tab in FxCop Project Options dialog box
- Now that the FxCop project options are set, press the OK button.
- Save the FxCop project using the File Save As … menu. Save the FxCop project file in the C:SamplesCh111_FxCopBuildFxCop folder with the filename Lender.Slos.Financial.Mandatory.FxCop.
- Run the analysis by selecting Project Analyze from the menu. The results are shown in the results pane within the Active tab.
- Expand the
Lender.Slos.Financial.dlltarget to reveal the class within the assembly. - Within the Active area, scroll down the list of violations to the “Rethrow to preserve stack detail” violation near the bottom of the list, which is shown in Figure 11-5.
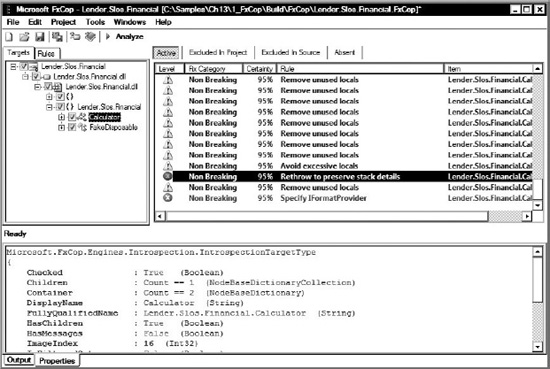
Figure 11-5. The “Rethrow to preserve stack detail” violation in the C
alculatorclass - Double-click the “Rethrow to preserve stack detail” violation to view the Message Details including the violation Level and Source. The violation details are shown in Figure 11-6.
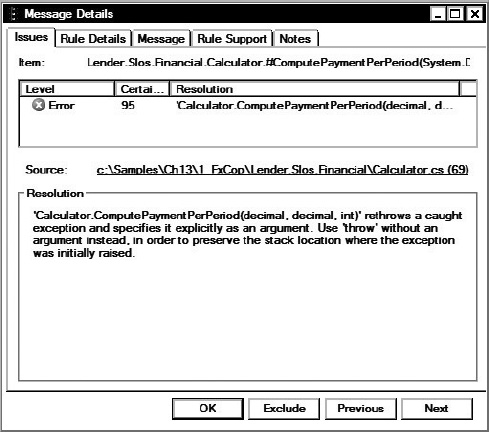
Figure 11-6. The Message Details dialog for the “Rethrow to preserve stack detail” violation
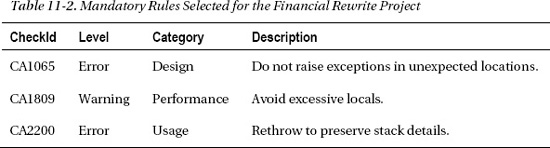
For the Financial Rewrite project let's select three rules as the “mandatory” rules. These violations have been taken up with GC and GC must now follow these rules. The first group of three mandatory rules is listed in Table 11-2.
Only these mandatory rules should be selected in the FxCop project's Rules tab. Start by deselecting all the rules. Find the three mandatory rules—rules are sorted alphabetically within a category—and select each of the three rules.
Since only these three rules are selected, they are the only active violations, as shown in Figure 11-7.
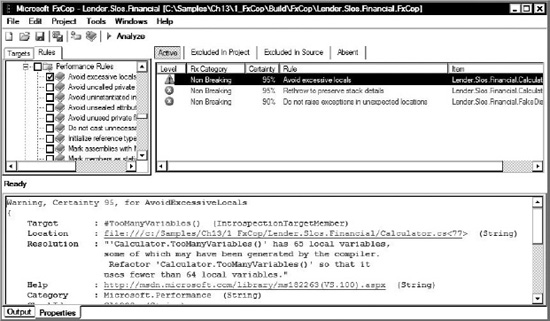
Figure 11-7. Violations of the mandatory rules
Save the FxCop project and exit the application.
This new FxCop project is now narrowly focused on just the three mandatory rules. The build script is now able to use FxCopCmd to use this project file to analyze the Lender.Slos.Financial.dll assembly against the mandatory rules.
The next thing to complete is calling FxCopCmd from within the build script. Within the sample code the runner.msbuild file has a target named FxCopAnalysis. This target can process the set of preferred and mandatory FxCop projects defined in the FxCopAttribute item group.
<Target Name="FxCopAnalysis" DependsOnTargets="Preconditions" >

    <Message Text="Processing FxCopXmlReport file '%(FxCopAttribute.ProjectFile)'" />


    <Exec Condition="Exists('%(FxCopAttribute.ProjectFile)')"

          Command=""$(FxCopRoot)FxCopCmd.exe"

/project:%(FxCopAttribute.ProjectFile) /fo /out:%(FxCopAttribute.XmlOutput)"

          WorkingDirectory="." />


</Target>
Running the FxCopAnalysis target generates one or more XML reports. The build script can use the XML output to determine if any mandatory rule set violations exist.
In the sample runner.msbuild file there is the FxCop task that inspects the XML output file specified in the FxCopMandatoryXmlOutput property. This technique combines the use of XPath and the XmlRead task from the MSBuild Community task library, which is covered in Chapter 9, to count the violations. Here is a snippet of the build script that inspects the mandatory XML output:
<Target Name="FxCop"
DependsOnTargets="FxCopAnalysis"
Condition="Exists('$(FxCopMandatoryXmlOutput)')"
>
<XmlRead ContinueOnError="True"
XmlFileName="$(FxCopMandatoryXmlOutput)"
XPath="string(count(//Issue[@Level='CriticalError']))"
>
<Output TaskParameter="Value"
PropertyName="FxCopCriticalErrors"
/>
</XmlRead>
...
<Error Text="FxCop encountered $(FxCopCriticalErrors) Critical Errors"
Condition="$(FxCopCriticalErrors) > 0"
/>
...
/>
The sample code is under the C:SamplesCh111_FxCop folder and provides a working example of using this approach for the Financial Rewrite project.
By using the FxCop application together with FxCopCmd in the build process the complete Analyze, Improve, and Monitor cycle is achieved. Both monitoring goals are achieved: the CI server can report the FxCop violations for all relevant rule sets and the build script can fail the build when violations of mandatory rules occur. This is a powerful approach for brownfield application development where slow and steady improvement and remediation is accomplished by gradually addressing rule violations and building up a mandatory rule set.
Just beyond the scope of this section, it is important to note that FxCop can be extended with custom rules.6 For example, a custom rule can enforce design rules, such as no source code from the persistence-layer assembly is allowed to directly call any method in a presentation-layer assembly. There are quite a few static analysis tools that look for quality- and security-related problems. Since it does not follow logic across method calls (intra-procedural analysis), FxCop is one of the simplest of its kind. For more powerful tools see Microsoft Code Analysis Tool .NET (CAT.NET), the HP Fortify tools, and other static analysis tools that look for quality- and security-related problems across the application.
__________
6 Learn more about writing custom FxCop rules at http://www.binarycoder.net/fxcop/html/index.html.
Decompiler
The purpose of using a .NET assembly browser and decompiler is to analyze the packaged deliverables. There are many reasons to use an assembly as the starting point for investigation, including
- Debug an assembly without having the source code.
- Understand an incomplete, unclear, or otherwise inadequately-documented API.
- Compare changes between different versions of assemblies.
- Recover lost source code.
- Determine how well the code obfuscator has disguised the code.
![]() Practice 11-3 Decompile an Assembly to Analyze, Understand, and Troubleshoot
Practice 11-3 Decompile an Assembly to Analyze, Understand, and Troubleshoot
In some situations there may be two versions of an assembly. Perhaps one is exhibiting a defect and the other is not. In this case, a decompiler is helpful to compare and contrast the two versions of the assembly. This analysis can often lead to understanding the differences that cause the defect in one version but not the other.
For a variety of reasons, on many brownfield enhancement and legacy maintenance projects the source code for an assembly is no longer available. An assembly decompiler provides the means to reverse-engineer the code that underlies the assembly. Also, if rewriting that assembly is the goal, then the assembly's de facto requirements can be understood by browsing the assembly.
Decompilers have broad application in many aspects of ALM. A developer can decompile a third-party assembly that is inadequately documented during coding to properly develop a feature using that assembly. To resolve deployment problems, the team leader can use a decompiler to compare different versions of assemblies to iron out why the software is having an issue. A developer can use a decompiler to recover lost source code in order to write an entirely updated implementation of an important module, without having to start from scratch.
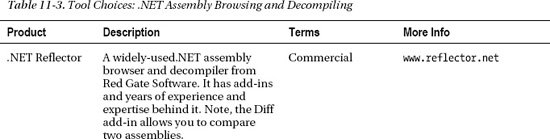
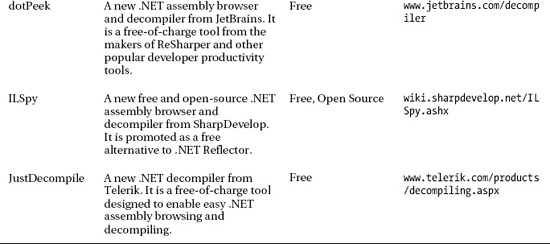
The .NET managed code assemblies represent a significant part of a software system's deliverables. Assembly analysis is an effective way to adopt the Analyze, Improve, and Monitor cycle with respect to these important deliverables. Table 11-3 provides a list of decompilers that might be worth evaluating.
Source Analysis
This practice area relates to focusing on source code quality. Not code quality in the sense of how well the code meets functional requirements, but in the sense of non-functional quality attributes, such as readability, conciseness, and maintainability. Without regard for its “fitness to a purpose,” source analysis tries to answer the question: How well is the source code written? There are many subjective answers and opinions to this question. There are, however, guiding principles that are widely accepted and generally hold true across many software systems. Perhaps it is easier to gain buy-in to source code analysis by focusing on the undesirable outcomes and negative characteristics that are the alternative:
- Inconsistently written code is harder to read and understand.
- Dense and complex code is difficult to maintain.
- Inappropriate dependencies violate the design objectives.
- Copied-and-pasted code is a frequent source of bugs.
- Spaghetti code is a nightmare for developers to enhance.
Developers often talk of the importance of reducing technical debt and cleaning up “bad smells” in code. Source analysis raises the visibility of potential problems related to unintentionally incurring technical debt and preventing “bad smells” from lingering once they surface in source code.
StyleCop
There are many tools available that perform automated code review. These tools help you figure out where the project's coding standards are not being followed in source code. For the purposes of this book and the discussion in this section the focus is on only one tool: the Microsoft-developed StyleCop. The power of free software and the integration with Visual Studio make StyleCop a pragmatic choice.
StyleCop is a free source code–analysis tool for C# developers.7 Initially developed by Microsoft, the governance and coordination of the StyleCop project was turned over to the .NET community as a CodePlex project. StyleCop integrates well into Visual Studio and warns developers when coding standards are not followed. If you have the ReSharper productivity tool, StyleCop integrates and provides options for code cleanup and feedback while writing code, to further help adhere to the coding standard.
StyleCop defines a widely-used coding standard that many C# developers who just want a standard are happy to follow.8 Since the standards enforced by StyleCop are not likely to exactly match your team's style preferences, StyleCop provides an effective way to turn off, change, or customize the coding standards within an organization or on a project-by-project basis.
Coding standards are about establishing a coding style and writing code that adheres to that style. The intention of establishing and adhering to coding standards is to make the source code
- Easier to read
- Straightforward to maintain
The coding standards ought to align with the coding style that the source code is currently following and that most developers want to follow. However, for many organizations the coding standards vary from project to project and from developer to developer. A coding standard document is difficult to establish. Even developers with the best of intentions will not strictly follow coding standards. Coding habits are hard to break and differences of opinion persist. Any focus on following and enforcing coding standards should not come at the cost of lost productivity and delayed delivery of functionality.
![]() Practice 11-4 Use StyleCop to Help Comply with Coding Standards
Practice 11-4 Use StyleCop to Help Comply with Coding Standards
Some of the rules found in the StyleCop coding standards are minor style preferences, while others address a significant readability or maintainability concern. On a scale of 1 to 10, you might rate one standard a 2 or 3 while another person would rate it a 9 or 10. In effect, the coding standards can be divided into non-mandatory and mandatory categories. Let's call these non-mandatory coding standards the preferred or voluntary coding standards. The voluntary standards are the agreed-to coding standards that should be followed, but violations of voluntary coding standards should not break the build. By contrast, mandatory coding standards must be followed and violations need to break the build.
![]() Practice 11-5 Fail the Build with StyleCop for Violations of Required Coding Standards
Practice 11-5 Fail the Build with StyleCop for Violations of Required Coding Standards
__________
7 More information on the StyleCop project is available at http://stylecop.codeplex.com.
8 “A Brief History of C# Style” can be found at http://stylecop.codeplex.com/wikipage?title=A%20Brief%20History%20of%20CSharp%20Style.
Using StyleCop to check coding standards presents a dilemma. StyleCop offers the either-or option; either all coding standard violations are warnings or all the violations are errors. You want StyleCop to issue warnings when voluntary coding standards are not followed and errors when mandatory standards are violated. The team's developers voluntarily heed the warnings to adhere to the non-mandatory coding standards. However, when a developer violates a mandatory coding standard then the build needs to break. In this section you learn one way to effectively resolve the dilemma.
When working in brownfield or legacy codebase it is not practical to have StyleCop break the build for every violation that exists in the source code, mandatory or non-mandatory. This is also the case in the Financial Rewrite project. In the Financial Rewrite project, the goal is to bring a few issues to the project manager and let the PM raise the issues with GC. After those few coding standards are raised, break the build if those specific coding standards are violated again in the next code push. In effect, the only mandatory coding standards are those that have been raised as an issue by the PM. In this way, slowly and steadily, specific coding standards are raised and moved from the voluntary category to the mandatory category.
WALKTHROUGH: STYLECOP CUSTOM MSBUILD TASK
StyleCop is an effective tool for analyzing the C# source code files to determine if coding standards are followed. In this section, you learned how a custom MSBuild task is used to break the build when mandatory coding standards are violated. Using StyleCop, adherence to coding standards is monitored in a continuous and automated way.
Differencing Tools
The purpose of differencing tools is to quickly compare two files or folder structures to isolate and understand the differences. This is an effective way to analyze a change set, and so nearly every version control system provides a way to work with a differencing tool to understand the changes contained in the change set.
Beyond version control, differencing tools have a broader role to play in source code analysis, configuration management, and troubleshooting. Some of the many applications of differencing include
- Performing code reviews
- Comparing the files and folders between deployment environments
- Finding differences in decompiled code between assembly versions
- Troubleshooting configuration differences
Many problems that are difficult to diagnose and detect are revealed by focusing on the differences. Differencing tools quickly and effectively make these differences explicit. A complete and clear understanding of differences helps to analyze the situation and point to resolutions or improvements.
![]() Practice 11-6 Use a Differencing Tool to Make File and Folder Differences Obvious
Practice 11-6 Use a Differencing Tool to Make File and Folder Differences Obvious
Differencing tools are commonly used in the coding, design, and maintenance aspects of ALM. Individual developers and team leaders can difference the source code files to review the code and find opportunities to comment on or improve the changes. This is especially important to team leaders responsible for overseeing the day-to-day work of many developers. Developers can maintain the software better when it is easier to isolate changes and describe the modifications in a change set.
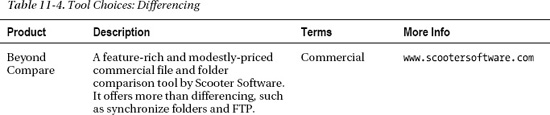
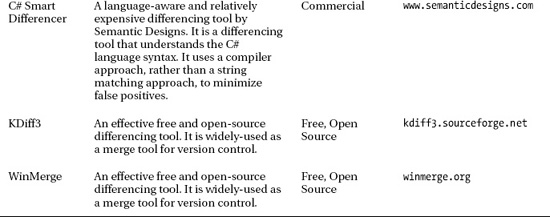
The important objective is to develop the habit of using a differencing tool to compare and contrast two files and sets of files and folders. Develop knowledge about using differencing to efficiently diagnose problems. Find a tool that works efficiently for you and master this skill. Table 11-4 provides a list of differencing tools that might be worth evaluating.
Duplicate Code Finders
The purpose of a duplicate finder is to find duplicate code. The challenge is to separate the coincidental and unimportant duplication from those candidates for refactoring or remediation. For example, most of the C# class files in a project might have the same dozen using statements. This duplication is fine, but the tool might highlight it as duplicate code. In contrast, every class might implement the same one-line method that validates a social security number, which is not reported because a duplication threshold is not met. The point is that finding duplicate code involves both an automated tool to reveal potential duplication and broad code review. Good judgment is needed to improve duplicate code.
![]() Practice 11-7 Find and Address Any Inappropriate Duplication of Code
Practice 11-7 Find and Address Any Inappropriate Duplication of Code
Duplicate finders are especially helpful for the design and maintenance aspects of ALM. Team leaders can examine the source code files across the software system looking for duplication. Finding duplicates provides opportunities to assign classes a single responsibility by removing cross-cutting or redundant functionality. Similarly, during maintenance the duplicate finders can be used to focus the team leader on finding technical debt that ought to be addressed as part of a maintenance cycle.
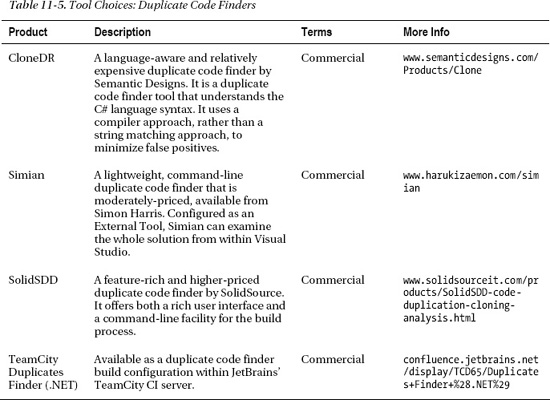
Use a duplicate code finder to analyze the source code. Review the output and draw conclusions about inappropriate reuse. Monitor the code base and vigilantly watch for inappropriate duplication of code. Table 11-5 provides a list of duplicate code finders that might be worth evaluating.
![]() Caution Overzealous efforts to eliminate duplication can lead to coincidental and improper reuse. On one project, a loan application, which has a lot in common with an approved loan, was handled as a “virtual loan” with horrible results. Eliminating code duplication by creating coincidental reuse tends to make the domain model abstract, ill-defined, and hard to understand.
Caution Overzealous efforts to eliminate duplication can lead to coincidental and improper reuse. On one project, a loan application, which has a lot in common with an approved loan, was handled as a “virtual loan” with horrible results. Eliminating code duplication by creating coincidental reuse tends to make the domain model abstract, ill-defined, and hard to understand.
Manual Code Reviews
To this point, the discussion of static code analysis has focused on tools and automated techniques. It is important not to overlook or underestimate the power of manual code reviews. The manual code review engages the individual developer and team leader in ways that bring judgment, experience, and discernment to uncover issues and improve design.
An effective manual code review focuses on all the areas of code analysis that the automated tools and techniques are weak at covering. This analysis should spotlight how the source code does or does not meet the design. The discussion is a transfer of knowledge from the more experienced to the less experienced developers. The experience, expertise, and judgment informs improvements to the coding in ways that go beyond the ordinary and routine analysis, such as following the coding standards, and toward improving coding technique and better design patterns. The manual code review is a communication vehicle that opens up a healthy dialog on the chosen conventions and why adherence is important. The best techniques associated with manual code analysis bring learning and education to the team.
Architecture and Design
The architecture of a software system includes the intended static design of the system. The goals of developing a system's architecture and design often focus on avoiding improper dependency relationships, managing complexity, and following best practices. However, over time, differences arise between how the software is built and how it was intended to be built. It is important to establish the differences and resolve them by making decisions about whether the software ought to conform to the design or the design ought to change because of an explicit choice.
Static analysis tools that evaluate the system architecture and design reveal the structure, design, and dependencies of the built system. The analysis work involves matching up these results to the design principles and rules that had been defined for the software. The static design and processes of the software system are described by the Unified Modeling Language (UML) diagrams shown in Table 11-6.
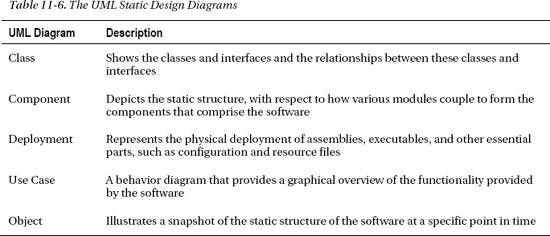
Both Use Case and Object diagrams are used to develop, illustrate, and define system requirements and detailed design. The Class, Component, and Deployment diagrams depict the static design of the classes, modules, components, tiers, and assemblies of the system. These diagrams often suggest design rules and the preferred dependency relationships that some static analysis tools can enforce. Also, when these diagrams are not available, then a static analysis tool can be used to evaluate the system by developing diagrams that depict the system's static design as-is. These design-oriented analysis tools are rarely cheap, but they have powerful application for any large-scale system development.
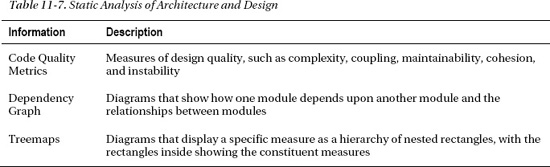
Static analysis tools that specialize in architecture and design can evaluate the software as it is and develop diagrams that depict the implied static design. These static analysis tools provide useful information, such as listed in Table 11-7.
Most static analysis tools that specialize in architecture and design are commercial products. Much of the output from these tools requires experience and expertise to interpret. There are gray areas that require you to discern and judge the appropriate choice of action.
The architecture and design tools and techniques have great application as part of the coding, design, and maintenance aspect of ALM. The technical leader uses these tools and techniques primarily to evaluate and improve the system's overall design and to target key areas for improvement. The team leader can use these tools to work with the developers, identifying technical debt and targeting maintenance development. Individual developers can use code quality metrics to monitor and correct the code they are writing while implementing features and functionality.
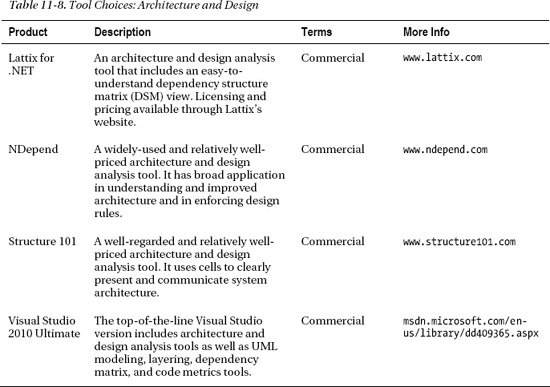
Table 11-8 provides a list of design analysis tools worth evaluating. These are relatively expensive tools that are not intended to be used by all members of the development team. The developers involved in high-level design and code quality analysis ought to budget for and investigate all the available options.
Code Metrics
There are many tools available to calculate code metrics for your .NET code. If you have Visual Studio 2010 Ultimate or Premium then you already have the means to calculate code metrics. Many of the architecture and design analysis tools include some ability to calculate code metrics as well.
Although there are many specific metrics, clear-cut design decisions can be made based on the information from a few key indicators.
In the Financial Rewrite project, you decide that a maximum cyclomatic complexity (CC-max) measure under 15 is preferred, if the code has a CC-max under 30 it requires attention but is acceptable, but any code with a CC-max over 30 requires urgent review. Visual Studio offers you the ability to the review of software with regard to CC-max and provides a way to perform this static analysis.
Quality Assurance Metrics
The notion of adopting practices that add to overall improvement is discussed in Chapter 1. The idea is that new practices in one area bring changes for the better to other areas of development. Tracking and analyzing quality assurance (QA) metrics is an excellent example of a practice that brings overall improvement. For example, the number of issues opened by QA testers or by customers for a certain module reveals important information about that module. More often than not, if a module is responsible for a disproportionate number of defects then that module is an error-prone module.9 Identification of error-prone modules provides developers with the information needed to prompt a code review or module redesign.
To make QA metrics as powerful as possible, the defect tracking system should tie together as many aspects of application lifecycle management as possible. Specifically, every defect should relate to the requirements, design, coding, and deployment. During maintenance the QA metrics help developers and team leaders target sources of technical debt. The defect tracking system needs to include fields that track one or more requirements related to the defect. The defect ought to capture the logical and physical parts of the system related to the defect, such as screens or modules. The version control system needs to integrate with the defect tracking system to allow developers to connect a source code change set to a defect. The result is that the practice of analyzing defect tracking reports can improve overall development. Here are a few defect tracking reports that are particularly helpful:
- Defects per requirement: High values for this metric often imply an overly complex or misunderstood requirement.
- Defects per module: High values for this metric often imply an inadequate design, missed requirements, too little unit testing, or careless development.
- Defects per source file: High values for this metric often imply an overly complex class, a class with too many responsibilities, or a good candidate for refactoring and redesign.
- Defects per deployment: High values for a particular deployment or for deployments to a specific target environment provide important evidence of configuration, scalability, and performance issues.
Dynamic Analysis
Dynamic analysis involves running the program and carrying out usage scenarios, automated tests, and creating other interesting conditions. The purpose is to collect information about performance, memory usage, test coverage, or internal program state while the application is running. For example, code coverage could focus on your interest in understanding how much of the code-under-test is visited while all the tests are running. Some of the many questions that dynamic analysis attempts to answer could include:
- What statements does the program spend the most time executing?
- What is the memory usage and what are the opportunities for optimizations?
- What code are my unit tests not testing?
- What is the application state just before an exception is thrown?
- What are the queries the system is sending to the database?
__________
9 Hard data on the cost of error-prone modules is provided in Steve McConnell, Rapid Development (Redmond, WA: Microsoft Press, 1996).
Dynamic analysis gives insight into what the system is doing as it runs and interacts with other systems, such as the database. Dynamic analysis is also tied into the Microsoft Security Development Lifecycle Process Tools. These are testing tools designed to help detect flaws that may expose security vulnerabilities. Just beyond the scope of this section, these verification tools use approaches like input fuzzing, validation, and attack surface analysis to uncover potential problems.10
Code Coverage
Code coverage tools measure how completely a program runs as it is running. In common practice, automated tests are what exercise the program so that the code coverage tool can perform its measurements.
In Chapter 8 the subject of automated testing is presented from the perspective of writing effective tests. The tests are written to check the intention of the code. However, the question remains: what code is not covered by tests? This question is broadly answered with a test coverage number, which indicates the percentage of code that is tested when the tests are run. The principle is that a test coverage tool runs the test suite and monitors the code-under-test. The test coverage tool tracks each symbol within the code-under-test and tracks these symbols as they are executed while the code is running. A symbol can be thought of as any point in the code that is a valid breakpoint for the debugger. The percentage of symbols covered is analyzed and calculated. Various code coverage measures are listed in Table 11-9.

__________
10 To read more about the Microsoft Security Development Lifecycle Process Tools see http://www.microsoft.com/security/sdl/adopt/tools.aspx.
Code coverage tools are used as part of the coding, design, testing, and maintenance aspects of ALM. These tools provide the individual developer valuable feedback when writing automated tests. With code coverage, the developer finds the uncovered branches, exception scenarios, and corner-cases. The team leader uses these tools to gauge progress against code coverage objectives. When correctness is important to a critical module, the team leader can monitor and insist that code coverage reach as close to 100% as is practicable. Similarly, improving code coverage is a measurable maintenance goal to target as part of a reduction in technical debt.
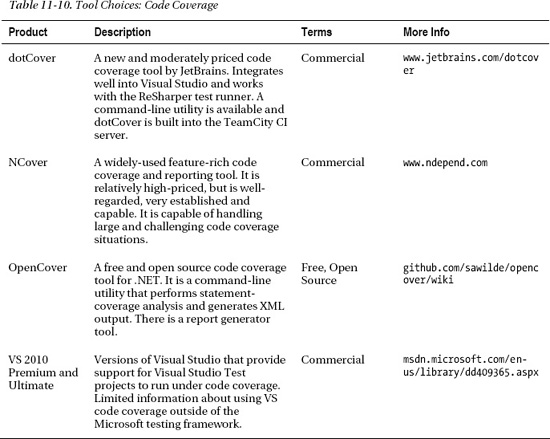
Table 11-10 provides a list of code coverage tools worth evaluating. Although there are not too many choices available today, more and more new CI and developer productivity tools are emphasizing code coverage. Take the time to research and evaluate all your options.
Performance Profiling
The purpose of performance profiling is to understand the performance characteristics of the software while it is running. Often the performance profiling is motivated by a performance problem; for example, during system testing when a page is taking too long to load. Other indicators include errors and system failures. With a sense of urgency the performance profiler is used to diagnose and debug the problem. However, a lot of time is lost learning how to use the profiler and interpret the results.
The pressure of performance profiling in a crisis situation is an all too common event. Performance profiling can and should be a part of ongoing monitoring activities during development. The Analyze phase of the cycle ought to include running the performance profiler while the system is run under scenarios that range from normal to heavy usage. This dynamic analysis is likely to suggest improvements that prevent problems. As improvements are made, performance monitoring helps detect new issues that prompt further analysis.
![]() Practice 11-10 Profile the System's Performance on a Regular Basis
Practice 11-10 Profile the System's Performance on a Regular Basis
There are two essential ways that performance is profiled:
- Sampling: At specified intervals the profiler looks at the top of the program's call stack and determines the active method. The profiler tracks each method that is active and counts the number of times it is active.
- Instrumentation: A special build of the software contains statements that help collect timing information at the start and finish of a method. The profiler tracks how long each method takes to execute.
Sampling does not require a special build of the application but is less precise. Instrumentation offers more information; however, an instrumented build is needed to provide the detail. Visual Studio Ultimate and Premium versions include these performance profiling tools, which allow you to perform early and frequent performance analysis. If you have one of these versions of Visual Studio, you can investigate your software's performance today. The sample code for this chapter includes the PeopleTrax project in the C:SamplesCh114_Performance folder. This is a sample application used in MSDN documentation and walkthroughs of the Visual Studio Team System 2010 Profiling Tools. Take some time to investigate the MSDN Walkthrough and other tutorials on profiling applications with Visual Studio.
Profiling techniques are often used as part of the design, testing, and maintenance aspects of ALM. When requirements and expectations are clearly not being met, individual developers ought to profile those aspects of the system as part of coding. Technical leaders use profiling tools and techniques to evaluate the entire system's performance to ensure the architecture is meeting objectives. Individual developers use profiling tools and techniques to properly resolve performance issues found during testing. Together the team leader and developers use profiling to target performance problems that can be addressed during maintenance.
Like performance profiling, memory profiling is often motivated and initiated after symptoms point to a memory problem. Understanding and optimizing an application's memory resource usage can prevent serious problems from occurring in the first place. An overview of the memory used by the application and regular monitoring are able to detect memory difficulties before they are found during system testing.
Query Profiling
Database tuning is too often done as a reaction to poor query performance. When a performance problem is likely rooted in querying the database, a profiler can help you to understand and diagnose the problem. Some of the symptoms that a query profiler helps to reveal include
- Repeatedly querying the same table
- Long-running or inefficient queries
- Queries generated by the LINQ provider
- The lack of appropriate indexes
- Indexes not being used
The Analyze phase reveals symptoms of problems with querying the database. Since the symptoms are revealed by the analysis, current or potential problems can be diagnosed. Improvements, such as caching or indexes, are prescribed to increase efficiency. Ongoing and regular monitoring prompts further analysis to address any new symptoms that arise.
![]() Practice 11-11 Examine Database Queries with a Query Profiler
Practice 11-11 Examine Database Queries with a Query Profiler
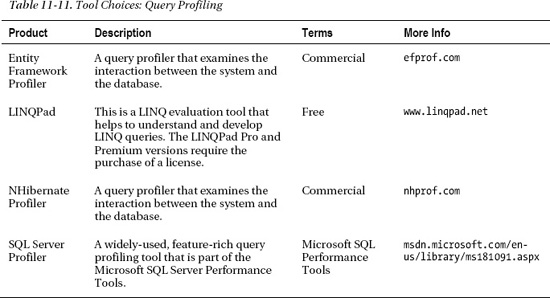
Table 11-11 provides a list of query profilers. One of them is probably relevant to the project you are working on today. There are certainly other query profiling tools worth evaluating; you are encouraged to investigate all options.
Logging
Logging is a very powerful way to troubleshoot difficult problems. Unfortunately, many software applications are built to only include error or exception logging. One of the goals of the logging approach ought to include support for dynamic analysis by providing the ability to capture activity and internal system state. In this way, logging is a form of instrumentation.
Good logging solutions are neither heavy nor intrusive. The logging configuration needs to be flexible enough so that error and exception logging is configured under normal situations, but if the need arises then with a configuration change the logging behavior changes to write more detailed information into the log. Here are some specific rules to follow:
- Do not make logging build configuration–dependent. That is, both Debug and Release configurations should have the logging facility so that production systems can perform logging.
- Always allow the logging level to be set or overridden through configuration.
- Carefully consider the logging level every time a logging method is called. Since logging has performance implications, avoid unwarranted logging with critical, error, and warning levels.
![]() Practice 11-12 Incorporate a Flexible Logging Solution to Monitor and Diagnose the Application
Practice 11-12 Incorporate a Flexible Logging Solution to Monitor and Diagnose the Application
Logging tools have broad application across many aspects of ALM, including coding, testing, deployment, and maintenance. The individual developer uses logging while coding and debugging features and functionality to dynamically watch and understand the state of the system. During QA testing the developers are provided important problem-solving information from the logs. Otherwise, even if you find problems, they will be very hard to reproduce and fix. During smoke, stability, and performance testing this information is very useful. After deployment, the developers use the information in the logs to pinpoint, diagnose, reproduce, and resolve issues that are often only seen in the deployed system.
There are a number of logging solutions available for .NET applications. However, there is a portable logging abstraction project, called Common.Logging. It allows you to perform logging to a well-defined abstraction layer and then select a specific logging implementation at runtime. The decision on what logging library to use is deferred until deployment through the use of configuration and Common.Logging plugins. These plugins proved support for various logging facilities, such as
- System.Console
- System.Diagnostics.Trace
- Log4Net
- NLog
- Enterprise Library Logging
More information on Common.Logging is available at http://netcommon.sourceforge.net. The reference documentation is available online at http://netcommon.sourceforge.net/documentation.html.
Somewhat related, the software system ought to incorporate a solid framework for defect reporting by QA testers and by customers. An effective logging solution provides a mechanism so that the defect reporting includes data such as the full stack trace of the exception and the list of loaded modules, including their version numbers, when the application crashed.
Summary
In this chapter you learned about the Analyze, Improve, and Monitor cycle of activities that form a conceptual model for software improvement. Also covered were the two broad areas of code analysis, static analysis and dynamic analysis. In the static analysis section you learned how this approach looks at the source code and assemblies without running the program. In the dynamic analysis section you learned how sampling and instrumentation allow the tool to capture information about the program while it runs.
This chapter brings together many of the .NET practice areas presented and discussed in Chapter 2. These topics include application lifecycle management, security analysis, and recommended patterns and practices. In many ways, code analysis is the application of the better .NET practice areas through active analysis, improvement, and monitoring.