
CHAPTER 4
The Staffing Model
In this chapter, you will learn how to plan, create, and use the Staffing (STAFF) model component of the company business model (CBM). We will begin with business thinking about staffing and how it relates to the operational implementation of your business idea. We will then plan and consider how the model will work. We will create the STAFF model to reflect your company's skill mix, organizational structure, and compensation plan.
In this chapter you will learn how to plan, create, and use the STAFF model. You will also learn how to
- Organize and develop a staffing plan.
- Model staffing cost variables including salary and the need for computers, phones, and office space.
- Compute the cost of payroll taxes and benefits
Business Thinking About Staffing: Evolution or Intelligent Design?
Don't be fooled by thinking that a great technology, a great founder, or a great market opportunity defines your company. It's the people! You can feel it when you walk into a business. The atmosphere from business to business varies greatly and is always palpable. The atmosphere can be animated, exciting, upbeat, positive, cynical, arrogant, dull, or even outright negative. My experience is that startup companies initially take on the personality of the founder or founders, which can be a good or bad thing. I think you know what I mean.
Developing STAFF is a great opportunity to apply business thinking to the staffing dimension of your business equation with an eye toward optimizing your greatest resource—people.
Conventional management wisdom views staffing in terms of hiring the right people needed to do a job. Management is continuously reviewing skill mix, trying to optimize and fit skills to work requirements. In this regard, a startup has a different challenge on its hands. Startups progress through distinct operational phases as they mature toward full operational viability, and "skill mix" has a different connotation as the company progresses through its phases.
These are the three phases of startup technology company development:
- Startup
- Initial operating capability (IOC)
- Full operating capability (FOC)
Each operational phase requires a different breed of cat (type of employee) to excel within the dominant work environment that is characteristic of each phase. These staff characteristics I call (using a Buddhist idiom) "staff nature."
Staff nature is primarily defined as skill set but is highly influenced by temperament, preference, and orientation. For instance, there is a huge difference between the type of person you want to develop your new product and the one you want to manage a mature software configuration. Both may have similar technical backgrounds, but their views and orientations toward work could not be more different. This dimension of staffing is usually not planned for strategically.
Three types of staff nature follow:
- Visionaries
- Pathfinders
- Homesteaders
To use a Wild West analogy, the visionaries imagine going out west and organizing the resources for a wagon train to travel to a particular destination. The pathfinders are the scouts and wagon train leaders that lead and manage the wagon train over rough terrain and snowy passes to the goal. The homesteaders settle the land at the destination and create thriving enterprises. They are three different breeds of cat in terms of orientation, preference, and optimal value during the different phases of company development. Let's look at each phase now; see Figure 4-1.
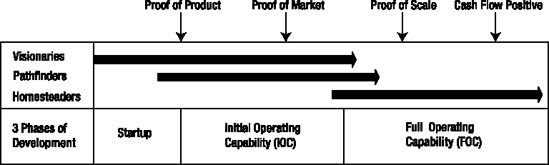
Figure 4-1. The three phases of company development and the ideal staff natures to support each phase
Each phase of company development requires a unique mix of resources to address the particular demands of that phase of company evolution. The following lists will give you a flavor for the people needs and characteristics (staff nature) needed to support the unique product development, sales, and process environments that are normally encountered in the evolving phases of company development.
Staffing the Startup Phase
For the startup phase, the ideal staff nature is visionary:
- People: Founders and one or two core technologists
- Product: Research and development; early prototype development
- Sales: Early market research, intelligence, and validation
- Process: Free form
Staffing the IOC Phase
Ideally, in the IOC phase, your staff will be primarily composed of pathfinders:
- People: Founders, initial development team, and first field sales engineers
- Product: Prototype rapidly evolving into first commercial release
- Sales: Early adopter and beta sales to get prototypes in the hands of users
- Process: Early/evolving definition of process and procedures
Staffing the FOC Phase
In the FOC phase, you ideally want a staff composed of homesteaders:
- People: Fully staffed for growing, high-quality operations
- Product: First commercially released versions
- Sales: Growing sales and brand recognition
- Process: Formal process and procedures
Moving Through the Phases
In my experience, entrepreneurs can explain to investors the phase of technology development they are in but, many times, cannot articulate how they will transition their team from visionaries to homesteaders. Some employees can make the transition through all stages of a company's development; many cannot. Many entrepreneurs that I have worked with have the idea that the company will evolve into the staffing mix that it needs. My experience is that failure to plan for this evolution can cause major problems along the way.
Note One of my clients found himself stuck in a perpetual development cycle because his initial development team, a mixture of visionaries and pathfinders, could not settle on a final configuration for the product and get it to market. They were stuck in a continuous visionary development do loop. Only when a new product manager (a homesteader) was hired was the company able to get off the dime and move forward from IOC into FOC.
Your business thinking about staffing must provide a strategy for the types of positions you will need and a strategy for the evolution of staff nature that fits with the phases of company operations. Your staff's ability to successfully operate in the various stages of company evolution must be managed. Some would say this is premature hand wringing and that there are bigger fish to fry. I suggest that the operational phase shifts occur sooner rather than later.
As you develop STAFF, keep in mind the previous discussion on staff nature. Plan for the functional positions that are required and their cost, but also plan for the evolution of the staff from visionaries to homesteaders. For instance, the headcount for software developers may stay the same, but the salaries may change as you transition from pathfinder developers into homesteader developers. Your model design may handle this implicitly or explicitly. It's up to you.
Reviewing the Staffing Business Case
Green Devil Control Systems (the Company) is an early-stage technology startup that develops and sells energy monitoring and control systems, specifically the Green Devil Energy Control System (ECS). The Company completed extensive market research during the feasibility study phase of their planning (see Chapter 3 for more on this study and the analysis of market potential for the Company). The founders must now begin the design and planning process for the Company. They will begin with the modeling of a detailed staffing plan and begin the process of designing the Staffing Model component of the CBM.
Exploring the Market
In exploring the Company's market, here's what the founders decide:
Target market The initial target market for ECS is a subset of new housing starts, the smart homes market. Smart homes are primarily being built in the western region of the United States. They have integrated networking capability and advanced capabilities to electronically control the home environment including temperature, lighting, telecommunications, and security.
Marketing strategy The Company will position the ECS product as a green technology, as a must-have feature for the progressive smart home buyer.
Sales strategy The Company will implement a direct sales strategy, selling directly to high-end home builders and developers. The Company will employ field sales engineers who are technically oriented toward electrical control devices and who can both sell and provide on-site technical support.
Exploring the Product
ECS is a patent-pending, programmable hardware and software device that monitors and controls electricity usage on a circuit-by-circuit basis within a facility. ECS is installed on the facility side of the electrical breaker box. It can be purchased with Local Services (LS) or Extended Services (ES) software options.
Planning the Company's Approach
The Company will develop an initial prototype of its hardware and software followed by a production prototype. The production prototype will be thoroughly field tested and sent to labs for compliance testing. There will be two iterations of this prototyping process. Production prototypes will be converted to manufacturing designs. Manufacturing will be outsourced. Assembly and testing will be performed by the Company prior to shipment to customers.
Assessing Company Deliverables
The primary Company deliverables follow:
- Prototype development
- Production prototype development
- Field, compliance, and safety testing
- Manufacturing design
- Manufacturing
- Product release
Planning Value Events
There are clearly identified key operational milestones, or value events. When achieved, these events significantly increase the credibility of the Company and significantly reduce the risk profile of the venture. These value events and their planned dates follow:
- Proof of product: November of year one
- Proof of market: April of year 2
- Cash flow positive: April of year 2
- Proof of scale: July of year 2
Understanding the Critical Components of the Staffing Model
The following critical components must be addressed and reflected in STAFF:
- Organization structure: The organizational structure reflects the Company's strategy for organizing the work that must be accomplished. They must think through the best way to organize the Company in order to do the work required. The organizational structure defines the relationships between functional positions and functional teams (departments) and their reporting responsibilities. The components and dimensions of an organizational structure follow:
- Functional positions: A complete listing of each functional position required to implement the business idea is incorporated in the organizational structure.
- Line relationships: Operational reporting structures are defined by the organization chart of the Company.
- Cost structures: Organization structures often define the cost roll-up structure of the Company.
- Staffing plan: STAFF provides a detailed plan of the functional positions that the Company will fill to implement their business plan. They must identify the job description and skill level of each employee that they are going to need over the full course of the business plan. They define the functional position to be filled over time as the Company evolves. STAFF provides a capability to plan for a consulting position in lieu of each functional position. The staffing plan is time phased showing the additions or reductions to headcount in functional positions over time.
- Cost and other assumptions: A critical part of planning is defining the cost of resources assumptions. What salaries will be required for each needed position? If consultants must be hired, what will they cost? What are your assumptions for the benefits provided and how much will they cost? What other bonus and compensation plans do you have in mind and what are your assumptions?
Note There is a cost roll-up design consideration to be made here. When planning STAFF, determine the lowest level at which you need to collect employee costs. This should always be the lowest level needed for the analysis of the staffing data. For example, you may decide that it is sufficient to collect costs at the functional position level rather than at the individual employee level. Figure this out before you start programming your model.
Planning the Staffing Model
There are three steps when planning the staffing model:
- Plan the organizational structure.
- Create the staffing plan.
- Define cost assumptions and key planning variables.
Planning the Organizational Structure
The Company will plan the optimal organizational structure needed to accomplish its business objectives. They will create an organizational chart (see Figure 4-2) that includes all functional positions needed for the entire life cycle of the Company. The life cycle is the five-year period of performance covered by the CBM.
Note that the organizational chart shown in Figure 4-2 defines three primary functional areas:
- Sales and marketing: Led by the vice president of sales and marketing
- Technical operations: Led by the chief technology officer
- Business operations: Led by the vice president of business operations

Figure 4-2. The forecasted organizational chart that addresses all funtional positions required during the period of performance of the model.
Creating the Staffing Plan
The Company will create a staffing plan from the organizational chart that includes:
- A listing of all functional positions organized into departments
- A time-phased projection of the number of full-time equivalents (FTE) needed to fill the positions over the period of performance of the model
Note For the purposes of this model, a full-time equivalent(FTE) designates one full-time position. For example, an entry of .5 into the headcount model indicates that the position is filled half time by one person. An entry of 2.0 indicates that the functional position is filled by two full-time people or possibly four half-time people.
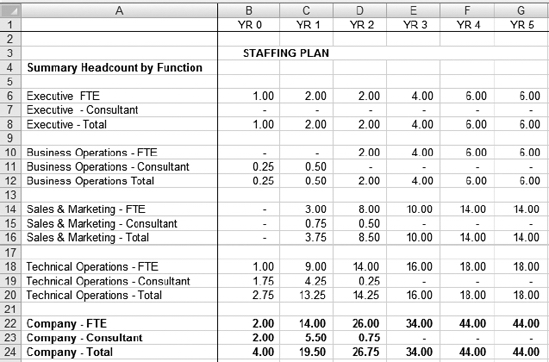
Figure 4-3. STAFFPLAN_CWS creates a time-phased staffing plan for each functional position defined in the organization chart.
Note The staffing plan in Figure 4-3 designates four departments: Executive, Business Operations, Sales & Marketing, and Technical Operations. The organizational chart shows only three line functions: Sales & Marketing, Technical Operations, and Business Operations. STAFF is grouping the top executives into an executive department to keep track of their bonus plans separately.
Defining Cost Assumptions and Key Planning Variables
The Company will develop cost assumptions (currency amounts to be input into the model) including consideration for the following:
- A salary target for each functional position and assumptions regarding changes in this range over time. A salary target (maximum salary at full operating capability of the Company) is determined for each position and adjusted on a yearly basis using a salary adjustment factor.
- Applicable employee taxes and rates.
- Employee benefits and applicable rates and burdens for each.
- Impact of other bonus and compensation plans.
Caution Don't forget to determine the key variables that you wish to model; those variables that you wish to input and change in performing sensitivity analysis or "what ifs" in STAFF.
Using the Building Blocks of the STAFF Model
When the planning is complete, build the model (see Figure 4-4). Take into consideration the inputs and outputs from STAFF to and from other components of the CBM.

Figure 4-4. This staffing model shows a high-level design and data-process flow. Worksheets shown within the dotted lines are primary STAFF worksheets. The arrows indicate the primary data flow direction.
Understanding the Staffing Plan Worksheet
STAFFPLAN_CWS summarizes the monthly headcounts that are input into STAFF_CWS and allows for a top-level input of salary adjustment factors. Its primary purpose is to sanity check the head-count and salary assumptions that are input into the more detailed STAFF_CWS. To fill it in, input the salary adjustment assumptions for each functional position.
This spreadsheet is not complicated (see Figure 4-5). It provides an input screen for salary adjustment assumptions. It provides a top-down view of headcount spreads and salary adjustment assumptions, allowing the user to assess the staffing plan at a high level.
Note STAFF_CWS is linked to STAFFPLAN_CWS. When you change the salary adjustment factors in STAFFPLAN_CWS, they are automatically propagated into the Staff-Calculation Worksheet, STAFF_CWS.
STAFF uses a salary adjustment method to forecast salaries. STAFF assumes the highest level salary (target salary) the Company will pay for a position and adjusts the salaries for that position over time, growing it up to 100 percent of the maximum salary at the end of the period of performance. The logic is that it may be easier to plan for salaries as a percentage of target salary rather than inputting discrete salaries over time.
Note Another way to forecast salary would be to discretely input fixed target salaries into each month of the model.
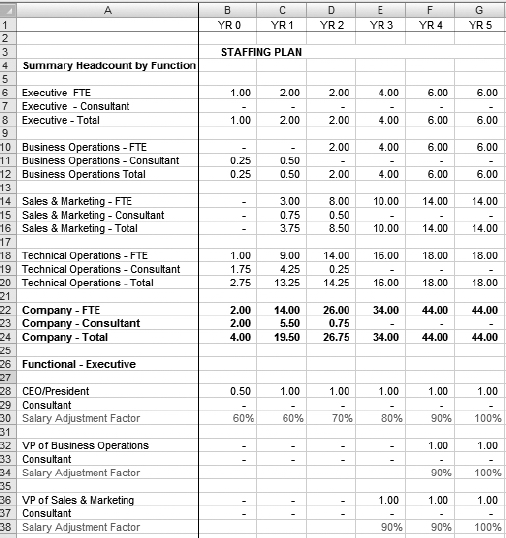
Figure 4-5. STAFFPLAN_CWS shows a vertical listing of functional positions organized by department and their corresponding headcount forecast and salary adjustment factors.
Understanding the Staff Calculation Worksheet
This worksheet does the heavy lifting in STAFF. It links its Salary Adjustment Factor cells to the STAFFPLAN_CWS for salary adjustments. STAFF_CWS provides for input of headcount and salary assumptions. It calculates salaries and payroll taxes and computes the number of phones, computers, and the requirements for office space needed based on headcount projections.
Exploring the Variable Input Section of STAFF_CWS
The top portion of STAFF_CWS (see Figure 4-6) provides a visual interface for developing a monthly spread of the headcount.
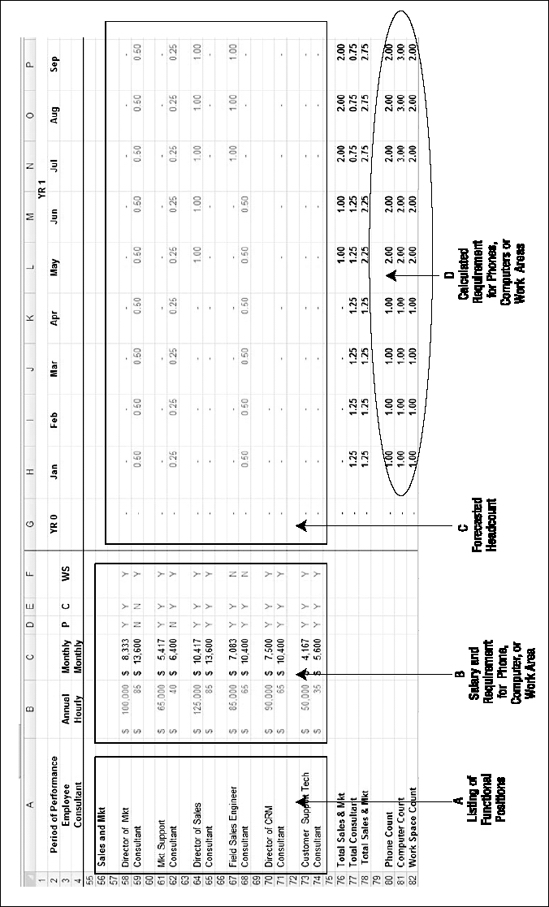
Figure 4-6. The variable input section of the Staff Calculation Worksheet
Note STAFF_CWS links to STAFFPLAN_CWS and uses salary adjustment data and yearly assumptions for payroll tax and benefit burden amounts to calculate total cost of salaries, wages, and benefits.
The top section of STAFF_CWS is designed for the input and display of the following variables:
- A list of functional positions
- A target salary for each functional employee position, as well as consulting rate estimates and requirements for phones, computers, and office space for employees or consultants
- Forecasted headcount
Note See Exercise 4-1 for how to use the SUMIF command to count phone, computer, or office space requirements.
See Exercise 4-2 for how to use FIND and REPLACE commands to speed up linking of large spreadsheets. OPEX and CAPEX models link to STAFF_CWS to access the calculated requirements for phones, computers, and office spaces. This data is needed as an input to the operating and capital expenditure plan.
Computing Salaries Using STAFF_CWS
This section of STAFF_CWS computes the salary cost for each functional slot and adjusts it for the salary adjustment percentage (see Figure 4-7). It computes consulting services expenses if the functional position is temporarily filled by a consultant.
Follow these steps to compute salaries with this worksheet:
- Base Compensation: To compute base salary cost, multiply FTE units by monthly salaries.
- Adjustment Factor: Note and validate the salary adjustment factor from STAFF_SP.
- Adjusted Compensation: To adjust base salaries, multiply base salaries by adjustment factors.
- Bonus Plans: Add commission or bonuses to base salaries.
- Tax and Burden Basis: The derived tax and burden basis equals adjusted base salary plus sales commissions or bonuses.
- Consultant: Compute consulting expenses by multiplying consultant FTE units by consultant monthly costs.

Figure 4-7. STAFF_CWS's salary computation section computes salary, consulting costs, and tax and burden basis.
Computing Payroll Taxes and Benefit Burdens with STAFF_CWS
The next section of STAFF_CWS computes payroll taxes and benefit burdens for each department (see Figure 4-8).
The steps to do so follow:
- Compute payroll and other taxes: Multiply applicable tax and burden rates by the applicable tax and burden basis.
- Compute the cost of medical insurance: Multiply the forecasted monthly medical insurance per employee by the number of applicable FTE units.
- Compute the cost of 401K benefits: Multiply the forecasted 401K burden (the cost to the Company to provide this benefit) by the applicable tax and burden basis. Most 401K burdens represent matching funds that employers provide for savings that employees put into their plans.

Figure 4-8. Staff_CWS's payroll tax and benefit burden computation section
Note Medical insurance calculation is offset by three months, assuming that medical insurance will not kick in until the employee has been employed for 90 days. The 401K burden calculation is offset by 12 months, assuming that 401K benefits kick in after one year of employment.
Consulting expenses do not carry any applicable taxes or burdens and are not included in the tax and burden basis.
Understanding the Executive Dashboard
The STAFF_DB worksheet is a management summary of STAFF data (see Figure 4-9). Its primary source of data is STAFF_CWS. The STAFF_DB can be formatted and used as a high-level management report, for instance, as a display in the business plan.
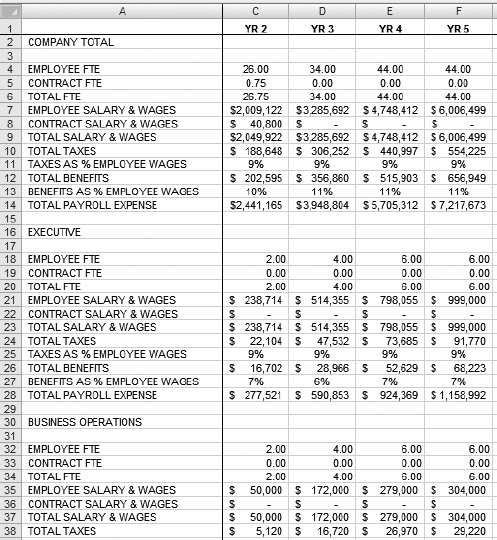
Figure 4-9. STAFF_DB, the Staff Executive Dashboard, is the management summary of Staffing model data.
Note STAFF_DB is linked to and derives its data from STAFF_CWS.
Understanding the Executive Chart Data
STAFF_CHARDAT preformats data needed for the STAFF management and analysis charts (see Figure 4-10). Charts are defined, and the data sources for the charts are derived from linking back to the other spreadsheets in the model.
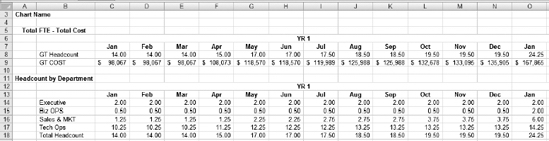
Figure 4-10. Using STAFF_CHARDAT, chart data is formatted and organized for the development of management and analysis charting.
Note See Exercise 4-3 for how to create a double axis management chart to show headcount and cost of payroll on one management chart.
You can create various management charts, as shown in Figure 4-11, utilizing the base data from STAFF_CHARDAT. See Exercise 4-3 for more details on creating this type of chart.

Figure 4-11. STAFF CHART_Total FTE & Cost shows the FTE headcount and cost of labor chart (double axis) including a total headcount and total cost of salaries, wages, and benefits.
EXERCISE 4-1. USING MICROSOFT EXCEL'S SUMIF FUNCTION TO COUNT REQUIREMENTS FOR PHONES, COMPUTERS, AND WORK SPACES
STAFF has a requirement to plan for the number of phones (cell phones or PDAs that require individual connectivity plans), office computers (desktop or laptop), and for an amount of office space or square footage needed to accommodate the headcount forecast. The requirement for each of these items is a variable cost to the Company based on the number of people that will be working for the Company. It is possible that the Company will not have to provide phones or computers or work spaces for consultants. For instance, the consultant may work from home.
- Problem: We have indicated with a Y (yes) or N (no) in STAFF_CWS the need for phone, computer, or work space depending on the functional position designation and whether it is filled by an employee or consultant. We want to count the number of phones, computers, and work spaces based on the input of forecasted headcount.
- Solution: Use the Excel SUMIF function to implement this count (see Figure 4-12). However, there is one additional complication. In many cases, the position will be filled part-time, that is, the input may be shown as a .5 instead of a 1.0. We don't want to generate count results that are fractional counts. We obviously can't purchase half a computer or half a phone; therefore, we want to round the count result up to the nearest whole number. We use the Excel ROUNDUP function to round up the results of the SUMIF count. This is good enough for our planning purposes.
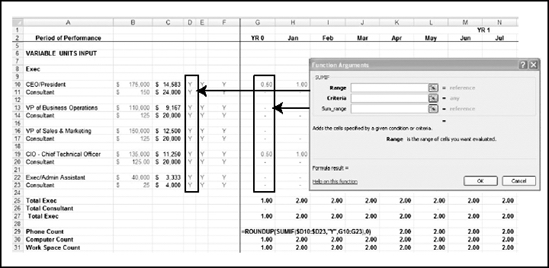
Figure 4-12. The SUMIF input screen where you can complete the Range, Criteria, and Sum_range fields.
- Place your cursor in the worksheet cell in which you wish to place the first SUMIF count result. In this example, the formula is in cell G29.
- On the ribbon's Formulas tab, select Math & Trig functions, scroll down, and select the SUMIF function.
- Input the following variables into the formula:
- Select the range of cells that are the criteria for selection. In this case, the range is D10:D23, the Y and N values indicating the need for a phone.
- Input the criterion, which is Y, for yes.
- Select the sum range, the range of numbers to be summed if the criterion in the range D10:D23 is Y. In this case, the range is G10:G23. Click OK. You have created the first formula to count phones, computers, and work spaces required.
- Prepare the formula for replication (copy) into the remaining months on the spreadsheet. The current formula is
=SUMIF(D10:D23,"Y",G10:G23)
To prepare it for copying to the 59 cells to the right, you must anchor the selection of column D by changing the column D reference to an absolute reference by inserting a dollar sign ($) as required. The formula is now
=SUMIF($D10:$D23,"Y",G10:G23)
- Modify the formula to round up SUMIF results to the nearest whole number using the ROUNDUP function. The current formula is
=SUMIF($D10:$D23,"Y",G10:G23)=ROUNDUP(SUMIF($D10:$D23,"Y",G10:G23),0)
This allows for the rounding up of your SUMIF result to the next highest whole number with no decimal places.
You are now ready to replicate the formula for the remaining 59 months of the model by copying and pasting it to the right.
To complete this exercise, you must develop similar formulas in the two cells below your current cell and modify them to use column E and F as the range input. Columns E and F contain the (Y/N) selection for computers and work spaces. Remember to prepare for replication and rounding up.
You have completed the count formulas for this particular section. These formulas are replicated for each functional department.
EXERCISE 4-2. USING MICROSOFT EXCEL'S FIND AND REPLACE COMMAND TO LINK LARGE SPREADSHEETS QUICKLY
In the Staffing model, there are a large number of links between STAFF_CWS and STAFFPLAN_CWS. STAFF_CWS links its 60 monthly cells to yearly salary adjustment entries in STAFFPLAN_CWS. That's a lot of linking! The linking allows for quick spreads of salary adjustment modifications, but it is time consuming to set up.
- Problem: Financial models often involve large spreadsheets. Linking of cells can be time consuming and is subject to error.
- Solution: The Find and Replace command can be used as a powerful tool to modify formulas en masse when linking large spreadsheets.
In this exercise, we will use the Find and Replace command to relationally link 60 cells in STAFF_CWS, representing the 60 months of a five-year period, to five cells in STAFFPLAN_CWS, representing five yearly salary adjustment values.
- Activate STAFF_CWS, and select the cell range G166:BO166. Press the Delete key to clear out this cell range.
- Select cell G166. Type an equals sign indicating that you are creating a formula. Select the STAFFPLAN_CWS tab, and select cell B30. Press Enter. You are taken back to cell G166 in STAFF_CWS. You have created a link from STAFF_CWS G166 to STAFFPLAN_CWS B30 (see cell G166 in Figure 4-13).

Figure 4-13. Creating a link between STAFF_CWS G166 and STAFFPLAN_CWS B30
- Now, anchor the formula, which is =STAFFPLAN_CWS!B30, by making column B absolute. Do this by placing a dollar sign ($) in front of the "B" in the formula, resulting in the formula =STAFFPLAN_CWS!$B30. Next, copy and paste the formula in G166 across the range H166:BO166. Now, the identical formula resides in each cell of the range G10:BO10. We want to modify these formulas en masse to point to the correct cells in STAFFPLAN_CWS.
- We must modify the formulas in each 12-month period to link to the appropriate year value in STAFFPLAN_CWS. Look at STAFFPLAN_CWS, and notice that the year values for YR 2 are in column D, YR 3 in column E, and so on. We will use the Find and Replace command to quickly make these changes in the formulas we just copied.
- In STAFF_CWS, select the cell range T166:AE166 (the range of cells for YR 2). Click Find & Select. Click Find. The Find and Replace dialog box shown in Figure 4-14 will appear.

Figure 4-14. Find and Replace dialog box
- We want to find all occurrences of $C in the 12 formulas in the selected range and change them to $D en masse. Type $C in the "Find what" field and $D in "Replace with", and click Replace All (see Figure 4-15). If the replacement works correctly, Excel will return a message that 12 replacements have been made, as shown in Figure 4-16. You have changed 12 formulas with one command.

Figure 4-15. Using the Find and Replace dialog box to replace all occurrences of $C with $D
Caution Find and Replace can be a dangerous command! Save before you use this command and check your results again. It will find and replace all occurrences. Make sure that you have given it the proper criteria and have the correct range selected. Note that you can undo the operation if you notice that the wrong data was changed.
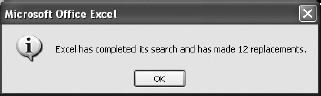
Figure 4-16. If the message does not say 12 replacements, something is wrong. We were trying to replace 12 monthly formulas.
- Repeat the process to change cells in the other year ranges: change YR 3 from $C to $E, YR 4 from $C to $F, and YR 5 from $C to $G.
EXERCISE 4-3. USING MICROSOFT EXCEL TO CREATE A DOUBLE-AXIS MANAGEMENT CHART
A common staffing chart used for management presentations displays total headcount and total cost of salaries and wages on one chart. One purpose of the chart is to show the relationship between the changes in headcount and the corresponding change in cost.
- Problem: The chart data series (data we want to chart), that is, the headcount and costs of wages, vary widely in value and are not conducive to charting together because of the wide variance in values between the headcount series and the dollar costs series. However, showing this data together on one chart is valuable because doing so clearly shows the relationship between headcount and cost.
- Solution: Create a double-axis chart plotting headcount on one axis and cost of salaries and wages on another. I have assumed that you have organized data that you want to chart into the STAFF_CHARTDAT file.
Follow these steps to create the chart:
- Activate STAFF_CHARDAT, and select the data series (range B6:BJ11); see Figure 4-17.

Figure 4-17. STAFF_CHARTDAT organizes and preformats your charting data as required.
- On the Home tab, select Insert followed by Line. Then, select the 2-D Line chart at the upper-left corner of the possible selections (see Figure 4-18). A line chart will appear within your spreadsheet, as shown in Figure 4-19.

Figure 4-18. Select the 2-D Line chart.

Figure 4-19. A line chart will appear within your currently active worksheet.
- On the ribbon's Design tab, click Move Chart Location, select "New sheet", and click OK. A new chart sheet is inserted, and the chart will fill your screen. See Figures 4-20 and 4-21.

Figure 4-20. Select "New sheet".

Figure 4-21. A new sheet appears, and in it is the chart we have moved.
- Note that the GT Headcount line is a flat line at the bottom of the chart hugging the horizontal axis. We will select it for plotting on a secondary axis, thus making it visible. Select the Format Tab, and on the chart, select the GT Headcount line. The GT Headcount data series will become highlighted, as shown in Figure 4-22.
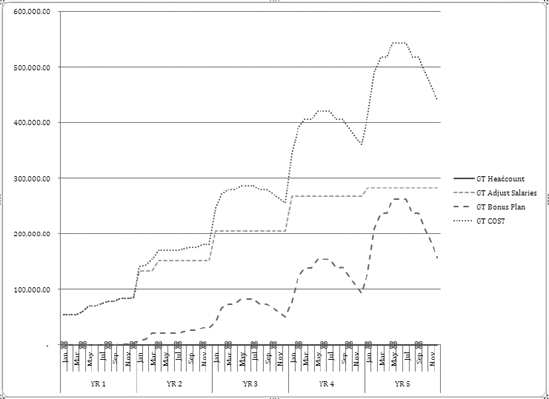
Figure 4-22. Select the GT Headcount (series), and it will become highlighted.
- On the ribbon's Format tab, in the Current Selection group, click Format Selection. A Format Data Series dialog box will appear. Select Secondary Axis, and click Close (see Figure 4-23). The chart is modified to show two vertical axes, one for the headcount series and another for other cost series. (See Figure 4-24.)

Figure 4-23. Select Secondary Axis.
- Select Layout, and modify chart and axis titles as required.

Figure 4-24. A double-axis chart is created, ready for edit of vertical axis titles and header.
Summary
STAFF models and documents the human resource dimension of the company business model (CBM). STAFF is developed by first determining the organizational structure that is required to implement the business strategy over the entire period of performance of the model. The organizational structure breaks the work out into functional departments and designates functional positions in each department.
The Staffing model utilizes the organizational structure and the listing of functional positions to compute the cost of salaries, wages, and benefits for the projected headcount. Costs are based on detailed assumptions of salary and benefit levels offered over the period of performance. STAFF also projects operating expenditures and capital expenditure requirements that are directly dependent on projected headcount.
When planning for staffing, you must consider the types of employee needed during each phase of the business. In the startup phase, you need visionaries. In the initial operating capability phase, you need pathfinders. In the full operating capability phase, you need homesteaders.
Here's the key question to ask yourself regarding staffing: what is your strategy for evolving your staff through the stages of company development?