
In-browser development tools are all about experimentation—while most of your development might take place in Dreamweaver, Aptana, or vi, those development environments don't always provide enough insight into how your page will behave in an actual browser. That's where the IE developer tools come in: they ensure your pages look, feel, and act the way you intended. A wide variety of tools are included in the package, covering a number of important scenarios in the development process: a markup inspector for analyzing HTML, a layout and styles inspector for CSS and element positioning, a JavaScript debugger for deducing problems with script, a script profiler for analyzing script performance, and more. This chapter highlights the features and functionality provided by the IE developer tools.
The IE developer tools can be launched in one of three ways: from the Developer Tools icon in the command bar, from the Developer Tools entry in the Tools menu, and by pressing F12 on a web page (only F12 is available for pop-up dialogs). Figure 5-1 shows this UI.

Once launched, the tools may be docked to IE (as an explorer bar), or may be unpinned and displayed as a separate window. These display modes are controlled through the icons in the top-right corner of the toolbar (Figure 5-2).
Each tool has its own tab, and in each the search box in the tab strip allows developers to search data in the current tab. The menu above the developer tools provides links to utilities that aren't specific to the tabs (Figure 5-3).
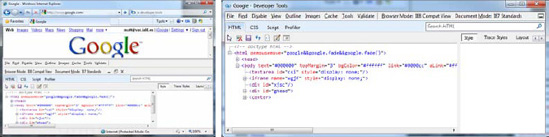
IE 8 includes a View Source window that displays a web page's source, complete with syntax highlighting and line numbering (see Figure 5-4). View Source reflects the original document downloaded by IE; changes made through the developer tools are not reflected in the View Source window.

Prior to IE 8, IE opened Notepad to display the source of a web page by default; this option could be changed to open source in another external application. Developers wishing to change the default source viewer can do so through the developer tools; as in prior versions, source viewing can be redirected to any external application that supports it.
The File menu offers access to basic developer tools settings. The Undo All command reverts markup, layout, styling, and script changes back to those of the original page. Developers can customize the web page source viewer in the next option; instead of using the View Source window provided with IE, you can set the browser to open an external application. Last, the Exit option closes a Developer Tools session (Table 5-1).
Table 5.1. File Menu Entries
Button | Shortcut | Description |
|---|---|---|
Undo All | - | Reverts a document to its original state (undoes all changes made to markup, script, and styles through the developer tools) |
Customize Internet Explorer View Source... | - | Allows developers to specify a default source viewer (either IE or an external application) |
Exit | F12 | Closes the developer tools |
The IE developer tools offer a number of utilities for inspecting, editing, and analyzing page markup. The following sections describe the markup tools and provide some examples of how they are used.
The HTML tab allows for real-time inspection and editing of page markup. Almost all aspects of page markup can be changed, including element attributes, values, and overall markup structure.
Table 5-2 highlights the top-level UI commands.
Table 5.2. HTML Tab Buttons
When a page is loaded, the hierarchy in the DOM Explorer represents IE's interpretation of a page's markup. This hierarchy is placed into a tree view. Parent elements can be expanded to show their children and element attributes can be edited inline. When an element is selected using Select Element by Click, the tree is expanded to reveal the element within the DOM Explorer hierarchy.
The Edit button (

If the current page makes changes to its own markup (e.g., with script or through Ajax calls), those changes are not reflected in the DOM Explorer. Those changes can be loaded by clicking the Refresh button. Conversely, changes made in the DOM Explorer are immediately applied to the current page. Developers wishing to edit the most recent version of the markup should click the Refresh button before making changes in the DOM Explorer.
Note
Markup and other data in the IE developer tools does not automatically update when a web page makes changes through JavaScript or Ajax. Developers looking to get the most up-to-date information on a document should click the Refresh button; this will force the tools to resync their representation of the DOM.
The DOM Explorer allows for inline editing of attribute values; however, it does not allow attributes to be added, removed, or renamed. The Attributes pane (Figure 5-7) allows the remaining actions to happen for the currently selected element in the DOM Explorer.

Figure 5-7 shows an example of an element's attributes being edited in this pane. The current element type is shown at the top alongside UI elements for adding and removing attributes. Each attribute on the current element is displayed in the list box. You can change an attribute name by clicking its name and either typing it or selecting an attribute from a drop-down. Values associated with a named attribute can be changed by editing the corresponding entry in the Value column. Changes made to attributes are immediately reflected in the current document.
Locating specific elements on large pages can be hard using the DOM Explorer by itself. The Find, View, and Outline tools help lessen this burden by helping locate, access, and position page elements.
The Find menu (see Table 5-3) offers only one entry: Select Element by Click. This command—also found in the top-level buttons of each developer tool's tab—navigates to any element that is selected in the current web page when activated.
Table 5.3. Find Menu Entries
Menu Item | Shortcut | Description |
|---|---|---|
Select Element by Click | Ctrl+B | Navigates to an element's definition in the HTML tab's DOM Explorer when it is clicked in the current web page. |
Commands in the View menu (see Table 5-4) provide detailed information about the context of page elements. The first set of view commands are for reporting: developers can overlay class, ID, link path, tab index, and access key information onto elements. Reporting tools in this menu allow developers to correct issues such as incorrect class, ID, and link references. A number of source viewers in this menu display page markup in a number of contexts.
Table 5.4. View Menu Entries
The Outline menu (Table 5-5) surfaces commands that outline elements based on type or property. Borders drawn by these tools are temporary; they are drawn over the web page, are not added to markup or CSS, and are removed when the developer tools are closed.
Table 5.5. Outline Menu Entries
Menu Item | Shortcut | Description |
|---|---|---|
Table Cells | - | Outlines all table cell elements in the current document. |
Tables | - | Outlines all table elements in the current document. |
DIV Elements | - | Outlines all |
Images | - | Outlines all image elements in the current document. |
Any Element... | Ctrl+O | Displays the Outline Elements dialog. This dialog allows custom elements to be outlined with a custom color. |
Positioned Objects | - | Outlines all elements that have relative positioning. |
Positioned Objects | - | Outlines all elements that have absolute positioning. |
Positioned Objects | - | Outlines all elements that have fixed positioning. |
Positioned Objects | Outlines all elements that have float positioning. | |
Clear Outlines | Ctrl+Shift+O | Clears all outlines. |
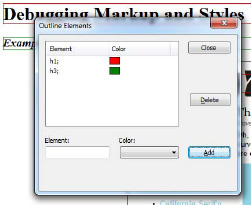
Figure 5-8 shows the Outline Elements dialog. This figure demonstrates a scenario where <h1> elements are assigned a red border and <h3> elements are given a green one.
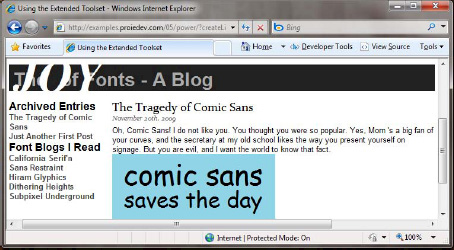
The Joy of Fonts blog is a sample web page for demonstrating markup inspection (see Figure 5-9). The page's CSS layout was constructed using the Yahoo UI Builder; this tool created a page with a header, navigation column, content column, and footer.

The document did not place the content in the right locations—instead of displaying the two-column format the page was supposed to be in, it stacked the parts on top of one another. (For reference, the correct result is shown in Figure 5-12.)
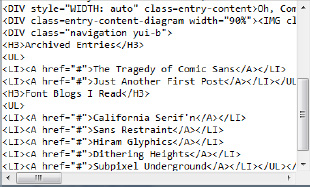
Markup inspection can help to shed light on the offending configuration. Markup can be inspected by opening the developer tools after the page is loaded. An analysis of the markup in the DOM Explorer (shown in Figure 5-10) shows that the main <div> on the web page (the one that contains the header, navigation, content, and footer) omitted the CSS class yui-t1 required by the Y!UI template.

The attributes on this element can be edited through the DOM Explorer to determine if this is the root cause. The class attribute on this <div> can be modified by clicking the current attribute value in the DOM Explorer and changing the value through an inline text box. Figure 5-11 demonstrates this inline box and, in this scenario, the addition of the token yui-t1.

The new class value is applied to the <div> as soon as the inline editing box is closed (when you press Enter or change focus). The results are immediately reflected on the current page. Figure 5-12 shows the result of this markup change—the header, navigation, content, and footer are correctly placed.

Changes made through the developer tools can be saved to disk. The Element Source with Styles tool could be used instead to only save those elements and styles used by the document <div>.
The IE developer tools not only allow for inspection of markup, but also for real-time manipulation of element layout and styles (Figure 5-13).

The Style pane (Figure 5-14) lists CSS rules applied to an element. Properties applied to an element are organized by the rule they came from—inherited, inline, or directly from a selector.
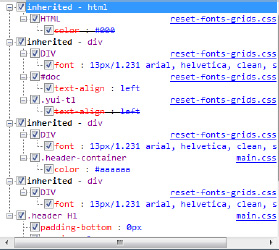
Properties are displayed alongside a link to their corresponding files. Property values can be edited, enabled, or disabled; changes made to each of these are immediately reflected in the current page. Entries shown with a strikethrough represent those ignored by the browser.
The Style pane is not meant to convey the ordering of rules applied to an element; the Trace Styles pane, described next, is better suited to determining the ordering of rule application.
The Trace Styles pane displays an element's styles based on order and precedence of application. Since an element can inherit styles from its ancestors, multiple (and sometimes conflicting) properties may be applied to an element. Unfortunately, developers cannot easily determine which styles were applied to an element without more information from the browser.
Figure 5-15 shows the traced styles of an example element. Each applied style is shown here, and those styles that have been overridden during the cascade are struck through. The source of each CSS property is shown next to it, and clicking it will navigate to its definition in the Source pane of the CSS tab (described later in this chapter).

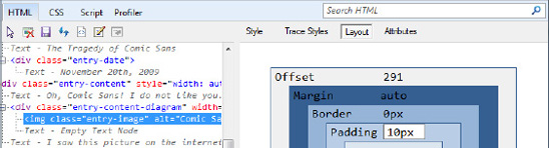
The Layout pane (Figure 5-16) displays layout information of elements that occupy space on a page. The offset, margin, border, padding, size, position, and z-index properties are available here.

Developers can edit the layout values displayed in this view by clicking a value and making changes in the edit box that appears. Inline elements (such as <span>) that do not use certain layout properties will show all layout values even though IE's layout engine may ignore some of them.
Note
Not all element types use layout properties like padding or margins. Developers should consider the element type being modified when adjusting properties in the Layout pane.
The Attributes pane, described previously in the "Inspecting Markup" section, is useful for CSS properties as well. The drop-down list of attributes contains both HTML attributes and CSS properties; CSS properties added through the Attributes pane are added to an element's style attribute, as shown previously in Figure 5-7.
The CSS tab displays CSS files used on a page. Its toolbar includes a few commands that let developers access and navigate CSS files loaded by IE; these are shown in Table 5-6.
Table 5.6. CSS Tab Toolbar Buttons
Button | Shortcut | Description |
|---|---|---|
Ctrl+B | Navigates to an element's definition in the HTML tab's DOM Explorer when it is clicked in the current web page. This will switch focus away from the CSS tab. | |
Ctrl+R | Clears the browser cache for all domains and sessions. | |
Ctrl+S | Saves all changes made in the CSS tab to a file. | |
Stylesheet list | - | A drop-down list of files used by the current page that contain styles. Accessing an entry in this list will change the CSS displayed in the source pane of the CSS tab. |
The CSS Source pane (Figure 5-17) displays the styles present in the document selected in the Stylesheet list. Styles and properties of a document are shown in a format similar to a stylesheet or <style> tag. All properties are shown under their owner selector (e.g., a tag, class, ID, or other selector type).
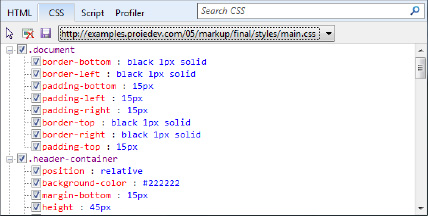
Each property and selector can be enabled or disabled through a check box, much like the check boxes in the Style and Trace Styles panes of the HTML tab. Each entry in the list may be edited by clicking a targeted item. Changes made to list entries, either through value changes, enabling, or disabling, are immediately reflected in the document. The rules of each file, disabled or otherwise, may be searched and highlighted using the Search CSS box.
The Joy of Fonts blog presented in the "Inspecting Markup" section is built and ready to go from an HTML standpoint, but it lacks visual appeal. CSS styles have been added to spice up the page elements in a way that is fitting for a blog; Figure 5-18 shows the new blog page with styles applied. There are a few problems with the application of these styles; the developer tools are used in the following examples to find and mediate the root causes.

The first problem with this page is the font size of the blog entry date. The sample page's date, "November 20th, 2009," is significantly larger than the .9em value set in its entry-date CSS class. Using the Select Element by Click command, the date is clicked and its corresponding markup is shown in the DOM Explorer (shown in Figure 5-18). Trace Styles reveals that this element has inherited the font of the parent element's class, entry-title. Since the em unit is relative to the inherited font size, the font shown on the screen will be larger than intended (since the basis font is that of the parent, not the page). This style is changed to an absolute size of 14 pixels using the inline edit box; the results are shown in Figure 5-19.

The image in the content pane presents the next problem: it is lacking proper padding. Figure 5-18 shows a "Comic Sans saves the day" banner that is pressed up against the content text. Padding can be added to the image through the Layout pane in the HTML tab; Figure 5-20 shows the layout values of the image object in this view. The padding values are changed through inline edit boxes in the layout window; in this case, 10 pixels of padding have been added to each side of the image.
The font color is the only major issue remaining with the Joy of Fonts blog. Figure 5-21 reveals why the blog content has been colored in red, something not intended during design. Select Element by Click and Trace Styles can be used once again to track down the source of the color.
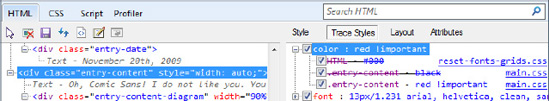
The Trace Styles value in Figure 5-21 show that there is an !important color style being applied to the element, overriding the color: black style intended for the element. Analysis of the source code in Listing 5-1 reveals that a development artifact was carried over: a duplicate definition for .entry-content exists with a style of !important color, thus it is given precedence (despite the fact that it was declared earlier in the file).
Example 5.1. Using String Substution in the Console Object
/* Blog Entries */

.entry-content {  /* For Testing */
   font-family: Helvetica, Helvetica Neue, Arial, sans-serif;
   font-size: 1em;
   color: red !important;
}
...
.entry-content {
   font-family: Helvetica, Helvetica Neue, Arial, sans-serif;
   font-size: 1em;
   color: black;
}
Once this reference is removed from the stylesheet, the font displays correctly in black.
These fixes can be exported to a new CSS file through the CSS tab's Save button, or to an Element Source with Style file, as is done in the markup inspection example. Figure 5-22 shows the final result of these changes on the page, including the correct font for the blog entry date, proper padding on the image, and the correct font color for blog content.

The Extended Toolset is a grab bag of tools that are helpful in the web development process but are not necessarily used in everyday development work.
Items in the Disable menu (see Table 5-7) do just what you would expect: they disable certain features in IE. Disabling or hiding certain portions of the browser or a web page allows developers to potentially exclude those items as root causes of a bug. Developers may block script and CSS from running through this menu; they also have the ability to toggle the IE Pop-Up Blocker on and off. Images can be disabled as well; this feature is located in the Images menu (discussed in the next section).
Table 5.7. Disable Menu Entries
Menu Item | Description |
|---|---|
Script | Disables JavaScript when developer tools are open |
Pop-Up Blocker | Disables the Pop-Up Blocker when developer tools are open |
CSS | Disables CSS when developer tools are open |
Disabling the Pop-Up Blocker is useful when debugging JavaScript. The Pop-Up Blocker's algorithm checks to see if a pop-up was spawned through a user-initiated action. Breakpoints and other debugging steps could cause such checks to fail.
The Images menu provides access to those tools related to images and image management in web pages. They exist to help developers gather the right information (size, description, source location, etc.) for layout and design decisions. Table 5-8 outlines these in more detail.
Table 5.8. Images Menu Entries
Menu Item | Description |
|---|---|
Disable Images | Disables loading of images on the current page; refreshes the current page |
Show Image Dimensions | Shows the dimensions of all images on a page by overlaying that information onto them with a label |
Show Image File Sizes | Shows the file sizes of all images on a page by overlaying that information onto them with a label |
Show Image Paths | Shows the paths of all images on a page by overlaying that information onto them with a label |
View Alt Text | Shows the Alt text of all images on a page by overlaying that information onto them with a label |
View Image Report | Opens a new page displaying a report of all images on the current web page, including their path, size, and Alt text |
IE developer tools contain a few extra goodies that don't fit into any major category, yet do provide some useful functionality. There are three such tools that fall into this category: a browser resizer, rulers, and a color picker. Table 5-9 outlines Tools menu.
Table 5.9. Tools Menu Entries
The Resize Browser tool literally sets the IE window to a specific size. This is useful for projects that require support for an exact, minimum, or maximum resolution (e.g., screen sizes on netbooks). The custom size dialog allows for custom window sizes beyond the four preset values, as shown in Figure 5-23.

The Ruler (see Figure 5-24) allows elements to be measured with metered lines. The Styles, Trace Styles, and Layout panes provide developers with WYSIWYG functionality in terms of element positioning, but these tools rely upon a developer supplying a value either from a guess or from work done outside of the developer tools.

The Color Picker is a simple dialog that displays the current color underneath the mouse cursor. Since the tool is run under the context of a tab (as described in the architecture portion of Chapter 1), it can only pick up colors from locations within the tab: the status bar, the explorer bars, the scrollbars, and the page itself. A selected color can be copied to the clipboard through the "Copy and close" button, as shown in Figure 5-25.

The HTML and CSS tools were used in the previous sections to fix layout and styles of the Joy of Fonts blog. This example demonstrates how the IE developer tools' Extended Toolset can be used to finalize the fit and finish of a page.
The Joy of Fonts blog will be given a decorative header. The header used in the preceding two examples consisted of gray text ("The Joy of Fonts—A Blog") with a dark background. The header is modified in this example; the word "Joy" is made to stand out from the rest of the header text—in this case, it will have different CSS styles than the rest of the title (jump ahead to Figure 5-29 to see the result).
Listings 5-2 and 5-3 show changes made to the markup and styles, respectively; the word "Joy" was removed from the header and placed in a <span>. A transparent image file was added to create a space between "The" and "of."
Example 5.2. New Markup for the Joy of Fonts Blog Header
<div class="header">
   <h1>
      The
      <img class="spacer" src="images/spacer.gif" alt="(blank)">
      of Fonts - A Blog
   </h1>
   <span class="deco-text">JOY</span>
</div>
A new <span> is placed in the header to create the intended effect. The CSS z-index property will let the word "Joy" be overlaid atop the existing header, and the image will be resized to create a space between the other header text, making room for the decorative word.
Example 5.3. New Markup for the Joy of Fonts Blog Header
.spacer {
   height: 5px;
}
.deco-text {
position: absolute; font-family: Baskerville, Times, Times New Roman, serif; font-size: 80px; color: white; margin: 0; padding: 0; font-weight: bold; font-style: italic; top: −25px; }
Figure 5-26 shows the changes made to the markup. Unfortunately, the <span> is displayed too far left of the intended location.
The Ruler tool can be used here to determine the best positioning values for the new stylesheet entries. Two measurements are made (in Figure 5-27). The first is that of the distance between the start of the word "Joy" and the end of the word "The"; this represents how many pixels the decorative text should be moved to the right. Next is the width of the word "Joy," representing the space it will need to occupy in the header (thus the desired width of the spacer image).

These two measurements indicate that the span needs to be aligned 60 pixels to the right of its current position and the spacer image needs to be 150 pixels in width.
Figure 5-28 demonstrates the next step in this process: setting the property values with information gathered from the Ruler. The CSS left property for the <span> is set to 60px and the width of the spacer <img> element is set to 150px.

The text is now in its proper position, and its color is changed to white to blend in with the page background. Figure 5-29 shows the new header with the decorative "Joy"—a very emblematic logo for a font blog.
The developer tools offer a number of ways designers and developers can test their web sites for compatibility with older versions of IE and for interoperability with other modern browsers.
The Browser Mode menu enables developers to simulate a version of IE: IE 7, IE 8, and IE 8 Compatibility View. This is not browser virtualization; instead, a browser mode tells IE to masquerade as a specific version. Different information is sent back to web sites based on the browser mode chosen through the developer tools:
User Agent (UA) string: The version of IE specified in the UA string sent to a web site (e.g., the IE 7 browser mode will report back
IE7to web sites)Version vector: The number used by the browser when evaluating conditional comments (e.g., the IE 7 browser mode will return
7for the version value ofIEin conditional comments)
Each browser mode is associated with a set of document modes (see Table 5-10). The available document modes are the same ones accessible through <meta> tags, HTTP headers, and the browser UI. For instance, IE 8 Standards mode isn't available in IE 7, and thus is not available in the IE 7 browser mode.
Table 5.10. Browser Mode Options and Their UA, Version Vector, and Document Mode Settings
Browser Mode | UA Version | Version Vector | Available Document Modes |
|---|---|---|---|
IE 7 | IE 7 | IE = 7 | Quirks (IE 5), IE 7 |
IE 8 | IE 8 + Trident/4.0 | IE = 8 | Quirks (IE 5), IE 7, IE 8 |
IE 8 Compatibility View | IE 7 + Trident/4.0 | IE = 7 | Quirks (IE 5), IE 7, IE 8 |
The Validate menu links to online services that validate a web page against known standards in markup, styles, and accessibility. For HTML and other forms of markup, specific standards noted in a page's DOCTYPE header will be used during the validation process. Table 5-11 outlines the available validation services in the IE developer tools.
Table 5.11. Validate Menu Entries
These tools work by sending URLs to online services. Pages located on a local filesystem or a corporate intranet will not work with these tools.
The IE developer tools include a built-in JavaScript debugger used to catch errors, watch execution, and dynamically modify script. The next sections detail these tools and provide a real-world example of the tools in action.
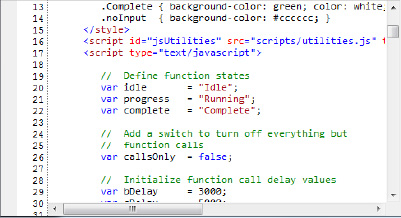
The Script tab, shown in Figure 5-30, consists of command buttons that control the most used features in the debugger, a toggle switch for debugging, a drop-down list that permits access to all JavaScript files loaded for a given document, and a number of panels that expose the UI of the debugger itself.
Developers can also use the search box to search loaded script for matching text. Table 5-12 highlights the commands, buttons, and tabs available.
Table 5.12. JavaScript Debugger Buttons
The panes to the right of the command buttons and drop-down give access to more detailed information regarding script execution and debugging events, such as the console and call stack.
The Source pane, shown in Figure 5-31, displays syntax-highlighted contents of each file containing script loaded in the current page. Developers can switch between files using the Script list in the main Script tab UI. Beyond viewing source, the pane is used to set, modify, and remove breakpoints for running script.
Breakpoints can be set on lines of script (statements, functions, and event handlers) after the JavaScript debugger has been started. When the JavaScript engine encounters a breakpoint, script execution will pause until action has been taken to stop or continue the script. Breakpoints can be set in three ways:
By clicking the leftmost area of the source pane, inline with the targeted line number
Through the context menu on a statement in the Source pane
Through the F9 key, when a statement in the Source pane is selected
Breakpoints on specific lines of code can be modified through the same context menu used to set them in the Source pane (see Figure 5-32). These can be deleted or disabled, or a condition can be placed on their execution.

Conditional breakpoints allow more granular control over when a breakpoint is triggered. Through this same context menu (or through the Breakpoints pane discussed later), logical conditions can be set on a given breakpoint using variables and functions of the loaded script (see Figure 5-33). The next time the JavaScript debugger reaches the breakpoint, the script will only be paused if the condition placed on it evaluates to true.

The Breakpoints pane displays currently selected breakpoints and their status, and allows users to enable, disable, or remove them. Double-clicking a breakpoint will open the script file associated with that breakpoint and navigate to the statement it was set on. Just like the Script pane, each entry in the breakpoints pane provides a context menu that can be used to manage breakpoints already set for a page (see Figure 5-34).

The Locals, Watch, and Call Stack panes allow developers to see activity in functions and variables at a given point in time. The Locals pane displays objects local to a function and their values. The Watch pane displays the same for a list of objects that have been chosen by a developer. The Call Stack pane represents an ordered list of functions called to reach the current statement. To view the call stack, script execution must be paused. Items in the call stack can be added to the Locals and Watch panes while script execution is paused during a breakpoint.
Objects can be added to the Watch list during breakpoints; the context menu for a given breakpoint exposes a command to add a specific object to the list (see Figure 5-35).

The Debugging Console pane allows developers to inject single- or multiline JavaScript statements into the current page without the need to modify the original source (see Figure 5-36). It also provides a number of logging functions that can be used to debug scripts running within the web application.

The context menu on the Debugging Console pane also allows messages to be filtered by types defined in the following functions and UI notification elements.
The Debugging Console pane can be accessed from a web page through the console object in JavaScript. This object handles one-way communication from a page to the console. There are a number of predefined functions that provide different types of console messaging; these functions can be expanded through expandos on the console object itself.
consoleobject: Object that handles communication between a web page and the Developer Tools JavaScript Debugger Console.log(message [,substitution])function: Writes a stringmessageto the console pane. Substitution strings inmessagewill be replaced by a matching number ofsubstitutionparameters.info(message [,substitutions])function: Writes a stringmessageto the console pane. These messages have a custom "information" icon. Substitution strings inmessagewill be replaced by a matching number ofsubstitutionparameters.warn(message [,substitutions])function: Writes a stringmessageto the console pane. These messages have a custom "warning" icon. Substitution strings inmessagewill be replaced by a matching number ofsubstitutionparameters.error(message [,substitutions])function: Writes a stringmessageto the console pane. These messages have a custom "error" icon. Substitution strings inmessagewill be replaced by a matching number ofsubstitutionparameters.assert(statement, message [,substitutions])function: Writes a stringmessageto the console pane only if thestatementevaluates tofalse. These messages have a custom "error" icon. Substitution strings inmessagewill be replaced by a matching number ofsubstitutionparameters.clear()function: Clears out all entries in theconsoleobject.(expando)functions: Function objects that handle custom log messages, passing information into another function on theconsoleobject.


The console object is only available when the developer tools are open, and is not available in IE 7 and earlier releases. This applies to IE 8 and higher; the object may be available in other browsers under different conditions. Scripts using the console object should check for the object's existence before using it.
All console logging functions, save for the clear() function, can accept an arbitrary number of parameters given that those parameters match substitution tokens in the message parameter. This means that the console object can handle type conversion automatically, much like C's printf(), but in a limited capacity. The tokens used in substitutions are
%d: Double type%i: Integer type%f: Float type%o: Object type%s: String type
Unlike the substitution style present in printf(), these tokens cannot be modified to convert a substituted value further; for instance, %d cannot be rewritten as %02d to pad the integer value with zeros until it is at least two digits wide.
Listing 5-4 demonstrates the basic usage of the console object.
Example 5.4. Using the Basic console Message Functions
// Check if the console object exists
if(window.console) {
// Write entries to the console
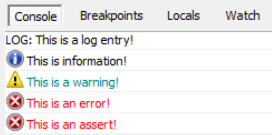
console.log("This is a log entry!");
console.info("This is information!");
console.warn("This is a warning!");
console.error("This is an error!");
console.assert(false, "This is an assert!");
} else alert("Console object does not exist!");When the code from this example is run, the console will display the messages with their respective icons, as shown in Figure 5-37.
Note
The console object (in IE) is only available when the developer tools are open; scripts that don't check to see if this object exists first will trigger an error. Always check to see if this object exists before using it.
Console messages can be simplified using substitution tokens. The message parameter itself is a String type; thus, some other types might require conversion to place it in the message. Developers can depend on the JavaScript engine for such a conversion by placing a token into the message where data of another type should reside and appending that variable as an additional parameter. Listing 5-5 demonstrates this.
Example 5.5. Using String Substution in the console Object
//  Check if the console object exists
if(window.console) {

   //  Define some variables
   var u = 3.14159;     //  Double (Float)
   var v = 8675309;     //  Float
   var x = 42;          //  Integer
   var y = new Date();  //  Object
   var z = "Marmite";   //  String

   //  Write to the console
   console.log("Double: %d", u);
   console.info("Floats: %f %f", v, u);
   console.warn("Integer: %i", x);
   console.error("Object: ", y);
   console.assert(false, "String: %s", z);

} else alert("Console object does not exist!");
This code outputs the result, as shown in Figure 5-38.

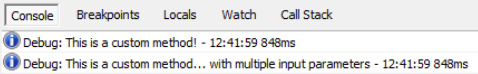
Finally, Listing 5-6 is an example of a custom function created to send data to the Debugging Console pane. Developers wishing to create a customized logging function can place that function onto the console object itself. This allows for a single point of conversion from a custom console logging string into one that can be displayed in the Debugging Console pane.
Example 5.6. Creating Custom Functions
//  Check if the console object exists
if(window.console) {

   //  Create a new method on the console object
   console.debug = function() {

      //  Get all the arguments and concat them
      var concatArguments = arguments.join(" ");

      //  Grab the current date object
      var now = new Date();

      //  Construct a new message format that uses the
      //  "Debug: " prefix and appends a time to the end
      //  of the message
      console.info("Debug: " + concatArguments +
                   " - " + now.toTimeString().split(" ")[0] +
                   " " + String(now.getUTCMilliseconds()) + "ms");

   }

   //  Write to the console
   console.debug("This is a custom method!");
   console.debug("This is a custom method...", "with multiple input parameters");

} else alert("Console object does not exist!");
The code here outlines the creation of a new function on the console object: console.debug(). This function appends a custom message (Debug:) and a timestamp to every string being sent to the Debugging Console pane. Once the final string is concatenated, the function places the new string into the console through the console.log() function. Figure 5-39 demonstrates the result of this, displaying the two calls made into the new function at the end of the code sample.
JavaScript debugging varies in difficulty based on the size and complexity of a web site. This section uses a web page found on the companion web site to highlight the features of the JavaScript debugger found in the IE developer tools. There's a catch, though: the example won't work right off the bat. This is where the JavaScript debugger comes in.
The code in Listing 5-7 is a buggy script in the aforementioned example. The script has two functions: foo(), which contains a string variable called bar, and displayBar(), which pops up an alert dialog containing the string contained in foo()'s bar variable. When the script is executed, it attempts to show the alert dialog by calling display() (hint: that's the first problem).
Example 5.7. Some Buggy JavaScript Functions
<script type="text/javascript">
// Create a foo object that contains
// a variable bar
function foo() {
this.bar = "golden";
}
// A function to display the current value of bar
function displayBar() {
try{
// Display the value of bar
alert(foo.bar);
} catch(exception) { }
}
// Display the bar variable
display();
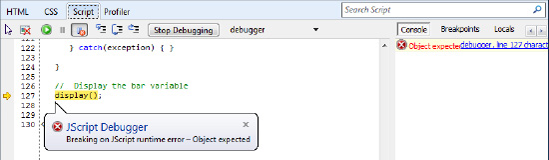
</script>JavaScript debugging is turned on with the Start Debugging button on the Script tab, and the page is reloaded. When the script is run, the debugger throws a balloon on the line of code that encountered an error: the call to display(). The error raised was "Object expected," which is shown both in the information balloon and the console (Figure 5-40).
The error makes sense: there is no function named display() in the script. The script does, however, contain a function called displayBar(), which happens to be the code that call was intended for. Once the error is fixed, the page is reloaded and the debugger won't break on any more critical errors. The problem remains, however: no alert dialog is shown.
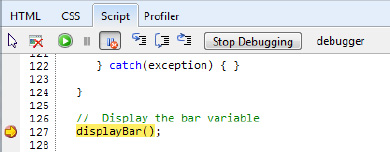
Breakpoints can be used to debug defects in script that don't cause breaking errors. The displayBar() function is responsible for showing the dialog. A breakpoint on this function will allow for analysis of what is causing the failure. Figure 5-41 shows this breakpoint.

The displayBar() function is called as the page is reloaded. The JavaScript debugger, upon entering this function, triggers the breakpoint set on the displayBar() call, as shown in Figure 5-42.
The call was reached, so the problem may lie within the function. The Step Into command steps into and pauses on the first line of the function. Figure 5-43 shows this pause, and it also displays the offending line of code: a call to an element.

Stepping through the debugger reveals that alert(foo.bar) didn't work; the debugger didn't break, however, because there was a try...catch statement surrounding the call. This is where the debugger stops working and the developer begins thinking (again, the developer tools are not a catchall toolset). The problem here is with the use of foo.bar to display the string "golden"; foo is the name of a function that is treated like an object, but it can only be used as an object if a new instance of it is created.
The variable myFoo was created and instantiated to be new foo(), a new instance of the foo object. Listing 5-8 shows this code change. After a reload, a dialog pops up with the word "golden," showing that the script errors were fixed correctly and the page is now, in fact, golden (Figure 5-44).
Example 5.8. Corrected Version of the Buggy JavaScript Functions
<script type="text/javascript">

   //  Create a foo object that contains
   //  a variable bar
   function foo() {

      this.bar = "golden";

   }

   //  A function to display the current value of bar
   function displayBar() {

      try{

         //  Create a new instance of foo
         var myFoo = new foo();

         //  Display the value of bar
         alert(myFoo.bar);

      } catch(exception) { }
} // Display the bar variable displayBar(); </script>

The JavaScript profiler, along with competitive tools in Firebug (and its extension Y!Slow), Dragonfly, and WebKit give web developers a way to get the raw data needed to assess potential performance pain points. The next few sections highlight the performance tools in IE and some real examples of how to use them.
The profiler collects data on the time spent in each JavaScript function as script executes, and displays a report after it is stopped. It may be started and stopped at any time, and does not require the page to be reloaded (however, since most script runs during page load, it is most effective when profiling during the page load process). There is no minimum time the profiler must run to collect data.
The Profiler tab consists of top-level UI elements (shown in Figure 5-45) that toggle the profiler and enable developers to view reports from profiler runs within the current session.
Table 5-13 outlines the functionality of these elements.
Table 5.13. JavaScript Profiler Buttons
After a profile has been collected, the results can be viewed in the tool itself. There are two main ways of viewing this data: Function view and Call Tree view.
Function view: A list of all JavaScript functions called during a profiling session and associated data regarding call counts and elapsed time
Call Tree view: An expansion of Function View that displays called functions in groups of trees based upon functions' caller/callee relationships
Each view of a profile run displays the same basic information: functions called, the number of calls made, the time it took to run those functions, and metadata such as the resource location and the line number for a specific function in that resource. By default, IE displays the gathered data in Function view (shown in Figure 5-46). Developers can add and remove data points from the display and results may be ordered by any column. The available data points are
Function: Name of a function
Count: Total number of calls made to a function
Inclusive Time (msec): Time spent in a function and its callees (in milliseconds)
Inclusive Time (%): Percentage of overall time spent in a function and its callees
Exclusive Time (msec): Time spent in a function (in milliseconds)
Exclusive Time (%): Percentage of overall time spent in a function
Average Time (msec): Average time spent in a function and its callees (in milliseconds)
Max Time (msec): Maximum time spent in a function and its callees (in milliseconds)
Min Time (msec): Minimum time spent in a function and its callees (in milliseconds)
URL: URL of the file where a function is defined
Line Number: Line number within the source URL where a function is defined
Function view displays a list of timing data by function name. Developers looking for raw timing information will find Function view most useful—the functions that are detrimental to performance can be quickly identified.

Inline blocks are not well represented in the profiler's data. In order to get accurate timing information for a block of code, developers should "name" that block of code by wrapping it in a function call.
Call Tree view, shown in Figure 5-47, contains all the data provided by Function view. Instead of being organized by name, it is organized by functional relationships.

The call tree format provides insight into the overall performance impact of function relationships.
The sample web page for this section (on the companion web site) demonstrates how to use the JavaScript profiler to time data flows and function calls (Figure 5-49).

To start the performance demo, a user clicks the Run Function a(...) button at the top of the page. This kicks off a series of function calls (named "a" through "e") and simulated "work" that ultimately result in a set of timing data. While a function is running, its status is reflected on the page as either Idle, Running, or Complete. Once all functions are complete, the time it took to process each function call and the work done by each can be seen in the profiler's report viewer.
There are five worker functions present on the web page, again named alphabetically "a" through "e." Function a() starts a cascade that calls each of the other functions once. All functions except a() are started after a certain delay specified in milliseconds; these delays can be modified in a set of input boxes at the top of the page. Functions c() through e() run some nonperformant tasks a set number of times (the Loop Max input boxes indicate how many times this task is performed by each function).
The flow diagram in Figure 5-50 shows how each function is called.
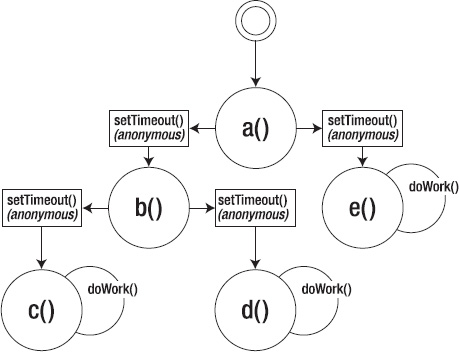
When the onclick event of the Run Function a(...) button is triggered, function a() is called by the JavaScript engine. Functions b() and e() are called after their respective delays; function b() proceeds to trigger functions c() and d() after a delay as well. Functions c(), d(), and e() each call a doWork() function (whose code is shown in Listing 5-9) the number of times indicated in the Loop Max input boxes.
Example 5.9. A Slow JavaScript Function: doWork()
// A function whose sole purpose is to waste time.
function doWork() {
// Do some really random, wasteful work.
var containerDiv = document.getElementById('container'),
var newDiv = document.createElement("div");
newDiv.setAttribute('id', "tempDiv" + String(parseInt(Math.random() * 1000000)));
newDiv.innerHTML = " ";
containerDiv.appendChild(newDiv);
containerDiv.removeChild(newDiv);
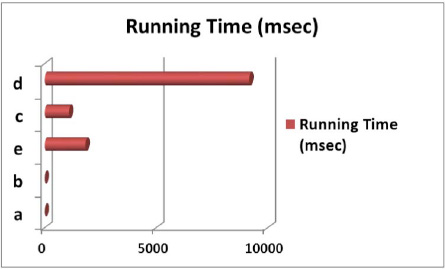
}The raw results from the profile run are shown in Call Tree view in Figure 5-51. The results show that d() ran for the greatest length of time, followed by e(), c(), a(), and b().

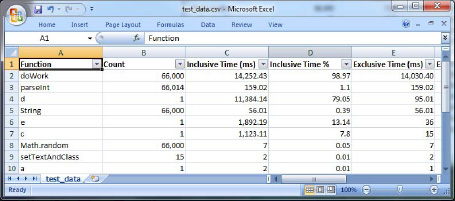
Clearer results can be seen using external tools and charting software. The results here were imported into Excel and placed into a chart (Figure 5-52) showing when each function started and ended.
The developer tools contain tools for cleaning up and inspecting cookies and cache information. Commands include operations to clear the cookies and the cache, to disable cookies and caching, and to view cookies. See Table 5-14 for details.
Table 5.14. Cache Menu Entries
Shortcut | Description | |
|---|---|---|
Always Refresh from Server | - | Ignores the cache and always downloads content for each page load |
Clear Browser Cache... | Ctrl+R | Clears the browser cache |
Clear Browser Cache for this Domain... | Ctrl+D | Removes files from the current domain from the browser cache |
Disable Cookies | - | Disables cookies browser-wide |
Clear Session Cookies | - | Clears nonpersistent (session) cookies |
Clear Cookies for Domain | - | Clears session and persistent cookies associated with the current domain |
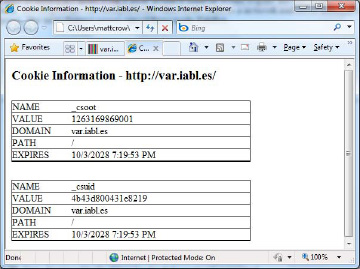
View Cookie Information | - | Displays a list of all cookies in a new web page |
This implementation, shown in Figure 5-53, is quite basic; it does not offer granularity of information further than that of the current domain or session. Developers are encouraged to use other tools for deeper analysis, such as a network and HTTP debugger.
The following tips and tricks can help developers get the best results when using the developer tools:
Don't use developer tools to code web sites: The IE developer tools are meant to aid developers in fixing bugs or developing interoperable pages. They are not replacements for a traditional development environment. They are not a text editor. It would take much longer for a developer to code a page using the developer tools than using traditional web development practices.
Treat page inspection as a feedback loop: Just like informational tooltips and debugger feedback in many IDEs, script errors thrown by browsers, and error and warning log files, the information provided by in-browser tools is meant to provoke a reaction. Developers should expect to jump back and forth between tools and the web page development process until a page reaches a satisfactory state.
Use complementary tools: There are a lot of features packed into the IE developer tools, but they aren't all-encompassing. There is no HTTP inspector or network debugger. There isn't a color profile manager. There is no mobile emulator. Developers should use the IE developer tools as a part of a wider developer workflow.
The developer tools provide a wide variety of utilities that can help you inspect and debug markup, layout, styles, and script in your pages. These tools aren't designed to replace a full development environment—they are, however, a great way to ensure your pages display and behave the way you intended. Beyond the inspection and debugging capabilities of the HTML, CSS, and Script tabs, the JavaScript profiler provides some great insight into performance improvements you can make to your pages as well. In the next chapter I cover ways you can use the Fiddler web debugging proxy to gain further insight into the way your web application interacts with IE's network and caching layers.