
Chapter 2. Get Curious with Your Data: Refining Your Product Research Question
All good research starts with a question. As we saw in chapter 1, to make that question the most valuable one for your business, it should be informed by what you already know. So what data do you already have that can help direct your research? It’s not enough to base your research question on assumptions or “what if?” musings. To get your research off to the right start you’ll need to use a combination of product data, benchmarking and heuristics to frame the problem, define the opportunity and pull your knowledge together to create a pinpointed research question.
Framing the Problem
As we’ve discussed, when coming up with a research question it’s easy to be led by what you want to know. We might have a problem-finding mindset, where we’re convinced a certain problem exists and are looking for ways to solve it. Or we might have a confirmatory mindset, where we’re subconsciously testing theories we already have. But our job as researchers is to find real issues from real behavior - and to do this we have to start with what we already know. Remember the bicycle with the broken brakes in chapter 1? Your question shouldn’t be based on what you think you know, but the real information you already have.
Data can come from many sources. For example, what do you know about how your product is being used? What information do you have about the market? What about your competitors? You might be able to find blogs, forums or news articles that could help your research take shape.
In this chapter we’re going to look at how defining the symptoms or problem is the first step in creating an effective research question. Framing this problem adds context and establishes a boundary between what is and what isn’t relevant for a given situation. It also adds focus. Usage data, benchmarking and heuristics are all helpful in framing the problem so you can form the right research question - one that will give the insights you’re looking for and have the most value for your business.
Most of the data we discuss in this chapter can be gathered immediately. If you work on a digital product, your analytics package is a good place to start. The data you get here might not tell you why something is happening, but it can at least tell you what is happening. When you find out what your users are doing with your product, you’ll start to discover the problems they’re having.
Once you’ve identified a problem space, it’s important to frame it so you understand the opportunities it creates. In doing this, the classic questions of journalism apply:
- Who?
- What type of person has this problem? How do you know it’s a problem? Do they realize it is a problem?
- What?
- What is the nature of the problem? What evidence do you currently have? What do you lack?
- Why?
- Why is this a problem worth solving? What’s the impact on the customer?
- Where?
- Where does this problem manifest itself? What is its natural habitat?
- How?
- How does this person typically overcome or work around the problem?
With the answers to these questions, you can frame the overall question you’re seeking to understand. This may be something like: “How do new families shop for furniture online?”
User Tracks
The best place to start understanding the problems around your product or service is by observing how your users interact with it. One way of getting to this data is by examining the traces your users leave as they take actions on your product or site. These are called user tracks, and looking at them can give you valuable information that often leads to good research questions. It’s a little like following footsteps in the snow, only using analytics or telemetry. You might use tools like Google Analytics, Pendo, Heap, or Amplitude. However, you don’t have to be limited to analytics. You can look at qualitative user data before and after product use to gather insights as well. This data can include the environment, sounds, and other external factors that will not be obvious when you just follow a user’s digital tracks.
To understand this better, imagine looking at user tracks for a touchscreen interface used by machinists manufacturing precision parts for surgical operations. A machinist’s on-screen actions might seem slow, leading us to think that the interface isn’t easy to navigate. But a look at the qualitative data - in this case the environment - shows us what’s really going on. On one end of the machine is a bar feeder that inserts material into a machine. Inside the machine there are multiple cutting tools that carve the metal into the refined piece of surgical equipment. An operator of this machine might not always be near the touchscreen interface, as she moves finished parts from one rack to another, fills up the coolant tanks, or tends to other shop-floor duties. It’s difficult to complete on-screen actions when you’re 10 meters away. Spending time with an operator during her day can offer insight into how many steps she takes while interacting with her environment. Let’s face it, we aren’t all staring at screens all day, even though it feels like many of us are these days.
User tracks can take a variety of forms: In product and out of product. The in-product tracks can be easier than others. For example, when Roger Maranon arrived a couple of years ago at his new role as a product manager for Boston-based startup Paperless Parts, he ignored instrumenting the product for gathering product usage data, much to the chagrin of his designer, who begged for this. It wasn’t until he and his engineering team got tired of running endless SQL queries that he finally added analytics instrumentation to the product so that he could see just how users engaged with it. Features he thought were super popular weren’t as popular as he thought. This gave him user tracks to better formulate what areas to focus on.
When examining data that shows user behavior, it’s also important to focus only on the data that can bring you actionable results. For example, if you’re analyzing view-to-buy rates for an e-commerce store, there’s no use including products where many varieties are out of stock as it won’t give you the real picture when it comes to what makes customers buy. When you look at phony analytics instead of relevant customer behavior, you can be so overwhelmed by the scale of the data that you miss what’s meaningful for your business.
Event Tracking
An event is any action someone takes while using your digital product: a button click, a scroll, a drag, a hover. When you track your users’ behavior you can create better products for them, because when you know the patterns of events over time you can map your users’ journeys. This can help you improve areas of your product where there may be friction. Event tracking is a powerful tool that can help you come up with your research question. However, it’s important not to rely on data alone. To understand how your users think and feel, you’ll need to incorporate other data, such as from interviews and observations.
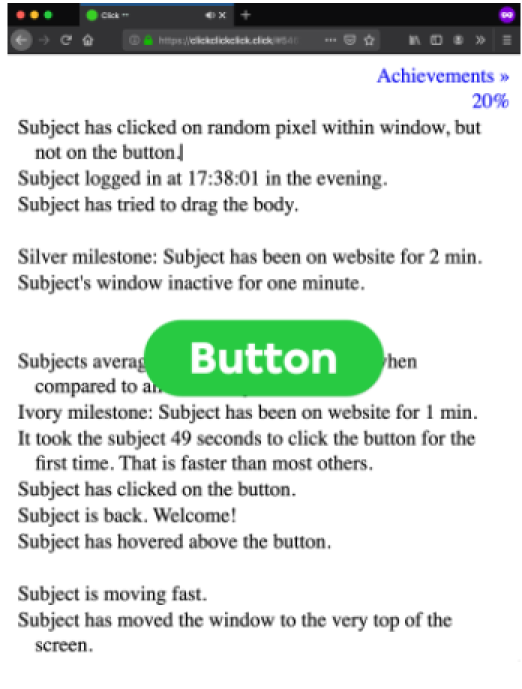
You’ll also need to think carefully about the ethics of recording people’s behavior. Just because you can track something, does that mean you should? With modern data analysis techniques there’s an enormous amount of information that can be acquired by tracking events. In some ways it’s scary how much we can discover. To give you an idea of the level of detail that can be captured, take a look at http://clickclickclick.click.
On top of the question of ethics, the scale of the data available could start to feel a little intimidating. So when tracking events on a digital product, perhaps the first question to ask is: What value does the data give you? You can then decide what to track based on what you need to know.
What can I track?
Event tracking isn’t just about clicks. There are many more things you can track, and by doing so you can create a detailed picture of your users’ behavior.
- Clicks and Interactions
- This measures how many times people click on a certain thing and is the most common use of event tracking.
- Signups, Log-ins and Form Submissions
- These are forms on the site where users can enter details and click “go”. Whether it’s signing up, signing in or signing their life away, you can track it.
- Downloads
- These are the types of content a user can download from the site. They might be CSV files, PDFs, GIFs or other files that can be used offline. Tracking these is essential to understanding user behavior. The challenge is measuring what happens after the content is downloaded.
- Embedded Widgets
- If you have interactive gadgets or widgets of any kind on your site, such as ratings, feedback pop ups, liked-that-try-this pop-ups, calendar buttons or polls, social share buttons, or any other third party, you can add event tracking to get an idea of how much these are used and which ones work best.
- Videos
- If you have videos on your site you will have stats on these through the video hosting platform. But how do you tie this data to the other data you have about activity on your site? By tagging the Play, Pause and Stop buttons with event tracking, you’ll know whether a visitor watched the entire video, scrolled to one part, or only watched the first few seconds. There’s different behavior there and it’s important to know what that behavior was if that content is critical to your product.
- Scroll Reach
- If you want to analyze how far users scroll down your website pages and have all this data in one place, you can use event tracking to measure this for you. Content platforms such as Medium use this type of event tracking. They’ll count an article as read if the user scrolled down instead of just visiting the page. Of course, there’s an assumption that scrolling down means the visitor read the article which, as we know, is not necessarily the case.
- Funnel/Flow Analysis
- You might want to know the efficacy of the sales or content funnel on your site or how users navigate the website. Analysing events can show how users move through the funnel, giving unique insight into where this could be improved.
- Retention
- The point at which users leave the site can tell you as much as how they navigate it. Event tracking can show when users close the window and which page they were on when they did so.
So as we can see, it’s important to look not only at how your users are behaving with your product, but how they feel about it. By combining behavioral and attitudinal data in this way you’ll get a broader picture about what’s happening around your product and the problems that exist.
User Voices
It might sound obvious, but the most effective way of understanding what your users feel is to ask them. Organizations use different avenues to collect user voices;they make specific efforts to survey, monitor and analyze customer feedback. This can be both beneficial and dangerous. It’s beneficial because it means a dedicated team is focusing on analysing users’ voices. It’s dangerous because that team may not be embedded within the product team, and their mere existence means the product team isn’t focused on listening to user voices.
One way of gathering user voices, or the “voice of the customer” (VoC), is through support forums. This is where customers discuss problems they are having with the product with other customers. Representatives of the company may or may not be present in the forum to help solve problems, but either way these support zones are a great way of learning about your customers’ experience.
A more customer-service-led version of the support forum is the customer success ticketing system. An example of this is the helpdesk software Zendesk, which tracks, prioritizes and solves customer support tickets, allowing customers to connect with the company directly through its website, mobile, email, Facebook, or Twitter. Analyzing data from a customer support ticketing system can give valuable insights into what your customers are struggling with.
Social media is another great place to gather user data directly from your customers. Comments and questions from Twitter, Facebook and Instagram can give accurate data on where the main problems and successes lie with your product. Posts tend to be unprompted and in-context, so they are often an accurate gauge of how people feel. Pay attention to social desirability bias, however, where users might mention a product because it looks good to their followers.
Users often voice their concerns and congratulations on review sites such as Yelp and TripAdvisor. These can be fertile ground for user data, and are usually better thought-through and more deliberate than social media posts. However, for this reason they can also have more of an agenda, and remember that reviews are often written at a distance from the use of the product.
Companies that have the benefit of scale can really take advantage of these types of user voices. For example, ecommerce website Etsy runs a survey of its buyers and sellers every year to prompt conversations with their users about the challenges they’re experiencing with the platform. They also monitor how their users talk about the platform on social media, giving them insights into their customers’ experiences and how they feel about the process of buying and selling.
Heuristic Tests (Ask an Expert)
A heuristic analysis takes your product (or a prototype) and asks three to five usability and/or design experts to offer their opinion on how well the design matches up to current best practices. By nature this is a subjective process, but it can be done relatively quickly and can be a great source of data for product improvements. We’ll state this up front: Heuristic analysis will not be 100% accurate. In fact, that’s the whole point.
To conduct a heuristic analysis you’ll need to understand the business and user needs of the product and how they are aligned with each other. You’ll also need to make use of any existing research results such as stakeholder interviews, user research, questionnaires, personas, user journey maps and scenarios (your current “data,” if you have it). Think about what tasks your users want to accomplish by using the product, and try to rank these in order of priority. Then ask what the user’s main goals are - in other words, why should they care? Typical questions for a heuristic analysis are:
-
How will the user attempt to achieve their intended outcome(s)?
-
How will the user see the correct action(s) available to them?
-
Will the user associate the correct action with the outcome they expect to achieve?
-
How will the user see progress towards their intended outcome?
Of course, by its nature, heuristic analysis has its limitations. For example, it may not be possible to fix all usability problems in an interface element or to replace that element with a new design, but it could still be possible to fix some of the problems if they are all known. Heuristics also doesn’t provide a systematic way to generate fixes for the usability problems it identifies or a way to assess the probable quality of any redesigns. For this reason, don’t put more work into heuristic analysis than into what you’re ultimately designing, and remember to include a statement of which set of heuristics you have used and why they’re an appropriate guideline. Compare and analyze results from the experts you ask. The benefit of having multiple experts is that they will likely find many of the same errors, but they might also find issues the others have missed. Whatever issues do arise, list and describe them in order of severity. Then with each issue, make recommendations for what it would take to adjust the system to follow good practice.
Framing the opportunity
Once you’ve used the data at your fingertips to identify and frame problems, the next step is to discover the opportunity these give your business. What metrics should you focus on to find solutions to the problem you’ve uncovered? The quality of your final research question will depend on how well you’re able to analyse the opportunities this problem creates.
What’s your business model?
What you offer and how you offer it - in other words, your business model - will influence the kind of research question you ask. For example, if your business is transactional - that is, your customers buy something - your opportunities will be around the processes in that transaction. You’ll want to know what converts visitors to your website, and about cart size and cart abandonment. Web analytics can give you this data, but to frame the real opportunities you’ll need more qualitative data outside the traditional transaction funnel, such as sources, email metrics and social media impact.
If your business model is software as a service (SaaS) - in other words, your customer subscribes to your system to enable them to do something - you’ll be looking at site performance and conversion rates. But you’ll also find areas of opportunity in churn rates, upsell and recency of use. App products have many similarities to SaaS in that your users are still buying and installing your software, but there are differences in where your opportunities might lie. For example, you might focus more on user numbers, uninstalls, ratings and reviews.
Of course, understanding where your business crosses over into other models is as vital as understanding your own model. There are also some general metrics that all companies should be interested in. These might include traffic sources and SEO, engagement and unsubscribe rates for email sign-ups.
Understanding your business model and how it affects the nature of your research question will allow you to pinpoint more accurately where your greatest insights lie. Focus on the value of your research question to your business instead of measuring things that don’t matter.
What do you know about the market?
As well as understanding your business model, you need to understand the opportunities available in the market for your product. Here, data you already have can give you insights into where your product fits for your customers.
When discussing the market for a product, it’s good to start at the top. What is the total available market (TAM) for your product or service? In other words, if geography, competition and reach were no object, what would be the total market demand for what you offer? For example, if you run a chain of sports shops, your TAM would be the worldwide sports-outlet market.
Next, take a step down. What is the serviceable available market (SAM) for your product ? In other words, what is the segment of the market that is within your geographical reach? For example, if yours was the only sports shop in town, what would be the total market available to you based on population size, leisure activity and the revenues generated by other sports outlets in towns with similar demographics?
Now take a step even further. What is the serviceable obtainable market (SOM) in your town ? In other words, taking into account the competition, what is the proportion of the SAM that you could realistically obtain?
The diagram below illustrates how each of these subsets of the market is smaller than the one before.

When you’re formulating your research question, it’s important to account for the market opportunities available to you. Building your research around your TAM - in other words, everyone - would be a huge waste of resources. Working out the market you can reach will help you to formulate your question and target the right users for your product.
What are you assuming?
As you learned in chapter 1, product research fails when the question is led by the researcher’s own agenda. There’s a difference between what we already know and what we already think. Before you formulate your research question, it’s a good exercise to analyse your assumptions. What do you think you know? Is that truly the case? Boston Dynamics assumed that the military users of its autonomous robot would care only about how indestructible it was. It wasn’t until the product came into contact with the user that the designers understood that noise was a factor. The inventors of the Segway scooter assumed that users wanted a cool alternative to the car or bicycle. Only when they rolled out the product did they realize they were trying to solve a problem that didn’t exist.
We naturally stray back to our assumptions. They are our comfort zone, our place of safety. It takes discipline to examine your data with an open mind. What is it really telling you? And how can you formulate a research question that will tell you more about this behavior?
Assumptions aren’t always bad. All research begins with ideas based on what we think we know. But being honest about our assumptions at the start and testing those that could derail our research are important steps in identifying the problems we want to solve. Only when we’ve defined our assumptions can we form helpful hypotheses about solutions.
Product research isn’t about testing everything. You don’t need to reinvent the wheel, and there will be some assumptions based on principles and patterns that you can safely use as a starting point It’s about identifying the assumptions that are less than helpful. These are your biases.
What are your biases?
Sometimes we gravitate towards what we want to be researching instead of what we should be researching. There are many reasons for this, but leaving our biases at the door will enable us to come up with the right research question for our business. Here are some of the ways biases might affect where we focus our research efforts:
- The Easy Target
- This is where we focus on the data that’s easiest to obtain. We’re particularly likely to do this in areas where our product is already performing well and we have a confirmatory mindset about the problem we’re trying to solve. But this is rarely going to be the most valuable research for our business. Asking existing customers how they feel about a particular feature might be easy, but it’s unlikely to give feedback that will lead to growth.
- The Know-It-All
- Those who shout loudest are often heard first, but that doesn’t mean those voices are the ones you should be listening to. The more a customer knows about the product (the more expert they are), the more likely they are to provide overly complicated feedback. While this can be valuable, such customers often represent a tiny segment of the user base, not the mainstream.
- Listening to expert buyers at the expense of the average user can result in narrow messaging that results in an over-engineered product. Expert buyers are often early adopters, so it’s easy to fall into this trap at the beginning of user research, when those customers don’t represent your real users.
- The Existing Customer
- Attracting new customers and retaining existing ones can look very different. Our existing customers might want something as straightforward as simpler navigation, whereas new customers need to be drawn in by a unique design element. In product research, we can sometimes lean too heavily towards making improvements for our existing customers because, frankly, that’s where the dollar is. But to focus on growth we must remember that not losing isn’t the same as winning.
- These are some of the biases you’re likely to experience while coming up with your research question. Later on, as you research that question with real users, you’ll be hit with a new set of biases that reflect your preconceived opinions of what those users want. We’ll cover those later in the book.
Pulling Your Data Together
You can have all the data in the world, but if you can’t turn it into something meaningful, it won’t help you come up with the right research question. The key is to prioritize the challenges your users are experiencing.
A good example is the Etsy VoC survey we discussed earlier in this chapter. From the data they receive, the research team creates a customer experience score that ranks each of the problems identified. This is a great way of telling what the highest priority problems are and acts as one input they can use to determine what to focus on. For example, in 2017, one of the issues that scored highly on that list was that Etsy sellers didn’t understand how shoppers were finding them on the platform. Because they didn’t know how they were being discovered, they didn’t know what to do to make themselves more visible. The scale of this problem was a big challenge to Etsy, as they already had a system of six products to help sellers make themselves more discoverable. The survey showed that this system wasn’t doing its job, and Etsy’s team knew they would have to use their seller marketing in a different way to help their customers. They began a research project to improve seller marketing. They’d looked at their data and it clearly showed that people needed help in this area.
Collecting data about the problems your users face and the opportunities your market and business model present is fruitless unless you can bring it all together. The value of the analytics at this stage depends on how you use that data to inform your research question. We’ll look at ways to define that question later in this chapter, but first it’s important to understand the process we go through when we analyse any sort of data.
Segmentation
If you’re all things to all people, you are nothing to anybody. Not all the users you track will have the same use case or patterns when using your product. Segmenting these users into subsets can help identify different types of users based on different criteria. Those criteria could be established using a variety of benchmarks, such as product usage or user role, or by different methods, such as demographic or attitudinal characteristics.
User segmentation allows you to focus your attention on the users that are the most important to you. For example, if you want to focus on users in the UK and US, segmenting will help you to see how those users behave without the distraction of other data.
Segmentation can be used to create product segmentation, the goal of which is to produce a single product with variations that can be marketed to different customer groups. These products might go by entirely different brand names (think Old Navy, Gap and Banana Republic), increasing market share while reducing the cost of developing different products. Segmentation needs a solid research foundation to identify the characteristics that resonate with the target segments. Product teams then can create different iterations that meet the preferred characteristics for each segment.
By segmenting your user base, you can:
-
Identify which parts (or products or experiences) you should focus on
-
Increase your advantage by discovering underserved niches
-
Enhance brand loyalty
-
Increase market share
-
Improve customer retention
-
Maximize lifetime value and lifecycle of customer
-
Improve communication with your users via matching communication avenues with user preferences
So how can you segment your users? There are several different types of segmentation, and which you should choose depends on what you want to do with the data.
For example, if we want to divide our user base by type of device or by browser, we could use technical segmentation. If you want to see which users click through a particular feature, you would segment by behavior: what the users do. Alternatively, we could segment by role (does a user’s role in an organization dictate their pattern of use?) or by demographics (where are the users from? What language do they speak? What age are they?) Splitting data into distinct segments can make it more manageable and more meaningful.
Cohorts
Another way of grouping your data is by creating cohorts. Unlike segmentation, cohorts allow you to analyse data at a particular point in time and by a particular characteristic of the user. For example, you might want to compare users’ behavior on a site when they first sign up with their behavior once they’ve been active for a few months. Cohort analysis can be done relatively, for example by comparing activity one month ago with activity six months ago, or absolutely (on a specific day). Either way, it’s a powerful way of looking at user behavior over a particular time frame.
You’ve likely heard of the infamous “Seven friends in ten days” story from Facebook1, where users who gained at least 7 friends in a 10-day period were more likely to become engaged users of the platform. Game developer Zynga learned a similar lesson. If someone returned to the site within one day of signing up for a game, they were more likely to become an engaged user. At Constant Contact, the product marketing team learned that trial users who sent a marketing email to a real list of customers rather than a test message to themselves were significantly more likely to become paying customers. Finding behavioral cohorts can be an intensive process;if you have data showing some progress, you can further experiment to refine it. What’s valuable about these cohorts is that they can offer insights into which areas of your product to develop further.
Cohorts break down into three basic categories:
1) Network density (like the Facebook example)
2) Repeat use (like the Zynga example)
3) Content addition (like the Constant Contact example).
While these are often levers for growth, it’s useful to know if you have identified them in your product or not. There could be an entire research question surrounding that!
Of course, how you use cohorts needs to take into account what’s good for the customer as well as for your business. Persuading more clients to perform certain behaviors might be in your best interests, but not theirs. There might be ethical reasons why forcing a behavior isn’t the right thing to do. Caution is also needed when looking at the data. Cohort analysis often shows correlation - but as we know, correlation is not the same as causation.
Map by a Product Blueprint & Journey
Just as an architectural blueprint maps the construction of a building, a product blueprint shows the structure of a solution to a user’s problem. Product blueprints are user-focused: they show how a customer experiences something. Like a journey map, they show two important dynamics: the user’s present frustrations and the future you want to create for them. In this way, product blueprints help to build a holistic, end-to-end picture of a user experience. From the data you already have, what is the structure of your product? How is the user experiencing it? What problems can you identify? Building a journey map of the way your product is used can help identify areas for research.
Formulating the Question
We’ve looked at several ways to gather data to inform your research project from the information already available to you. How does this data help you form a valuable question for research? As you learned in chapter 1, an insight-making mindset and a specific, curious questioning process are vital if product research is to return meaningful results. A good place to start when forming a research question is the Right Question Institute’s Question Formulation Technique (QFT2). It’s a simple but rigorous process that helps anyone form a question that will lead to deeper learning.
The first stage of the QFT is to design a stimulus to trigger questions. This is called the QFocus. The QFocus might be a statement, phrase, image, or any of the data you’ve gathered in your early examination of your users’ experience. The idea is to encourage divergent thinking - in other words, to prompt you to think creatively by considering as many options as possible.
An example of QFocus would be bicycle repairs, like we described in Chapter 1. This could generate a variety of questions: How might a home-mechanic fix a flat tire? How do professional mechanics repair bikes? How do the gears stay clean? How is a tire changed? What tools are needed for replacing a crankset? Is it difficult to fix a flat tire? What tools are needed to change an inner tube?
Once you have your QFocus, you’ll use that as a starting point to jump-start discussion amongst your team. Remember: this process is about creativity and open-mindedness. Encourage everyone to ask as many questions as they can. Do not stop to discuss, judge, or answer the questions; just continue creating more questions until you can’t continue. It’s important to write down each question exactly as it is posed; never give examples of the sorts of questions you’re looking for. That way you’ll avoid influencing the direction of the questions and skewing the focus. Finally, remind people of these principles each time you use the QFT - it’s easy to shift away from an open and collaborative spirit.
Encourage the team to look at the questions they produced. What sort of response will they elicit? Are they open or closed? Could you change any of the closed questions to open questions, or vice versa? Does this improve them? This exercise is about improving the questions you have to get the most from the participants. Think convergently here: which questions are the best in light of the research goal? Which should you prioritize?
The objective is to narrow your questions down to two or three whose answers will unlock value for your business and yield the best insights into the product. From these, you will choose just one to focus your research on.
Measuring Value
To help you decide which question to focus on, look at the potential value of each question’s answers. If you can get answers to this question, what impact will that have on your business? What product or service can you better design with the insights you’re seeking? What changes will those insights allow you to make? What effect will that have on revenue and profit? Understanding the real impact of your research project on your business will ensure you’re not conducting research for research’s sake.
Summing Up
You can come up with the right question for your research project by looking at the data you already have. Tracking how users employ your product, asking them to share what they think, and performing heuristic tests using experts in the field are all ways of finding data to help you form your research question. Analyzing the opportunities your particular business model and market conditions afford will help you to come up with the most valuable proposition for your organization. As ever, identifying and understanding your natural biases towards your data will ensure you don’t skew your research efforts towards an area that offers convenience over value. Pulling your data together intelligently and forming a clear research question with an insight-making mindset will ensure your project delivers the most impact on your product and your customers.
Key Takeaways
-
All good research starts with a single question.
-
That question should be based on what we already know - and that means data.
-
Examine users’ behavior with user trails, event tracking, user voices and heuristics.
-
Frame your opportunity based on your business model and the market available to you.
-
Analyse your assumptions. There’s a difference between what we think we know and what we actually know.
-
Avoid directing your research towards a particular set of users just because they are easily accessible, expert or loyal.
-
Use segmentation, cohorts and a rigorous analytical process to collate your data.
-
Use the Question Formulation Technique to help you define the research question that has the most value to your business.