Chapter 5. Graphics and Imaging
Many Chrome Apps don’t just display text and forms; they display graphics of all sorts, both those drawn by the app and those brought into the app, such as photographs. Many of the related APIs are part of HTML5 and aren’t unique to Chrome Apps, but their use in Chrome Apps does have its peculiarities, as I’ll describe in this chapter. I’ll also show you how to use the mediaGalleries API that is (as of this writing) unique to Chrome Apps.
Outputting Graphics
Until now, all of our examples showed fairly mundane user interfaces, built up from simple HTML objects, mostly text areas and buttons. However, desktop apps need to be much snazzier, with more-advanced GUIs.
The next few sections describe six different ways to create a user interface: simple text, HTML tables, positioned HTML, drawing on a canvas, Scalable Vector Graphics (SVG), and creating a PDF. Next, we’ll look at how to display images, chiefly JPEGs. Finally, we’ll investigate the Chrome mediaGalleries API, which makes it straightforward for your app to access media files stored on the local computer.
Calendar Example
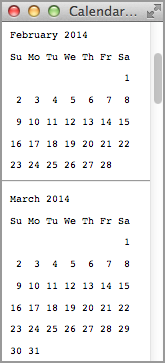
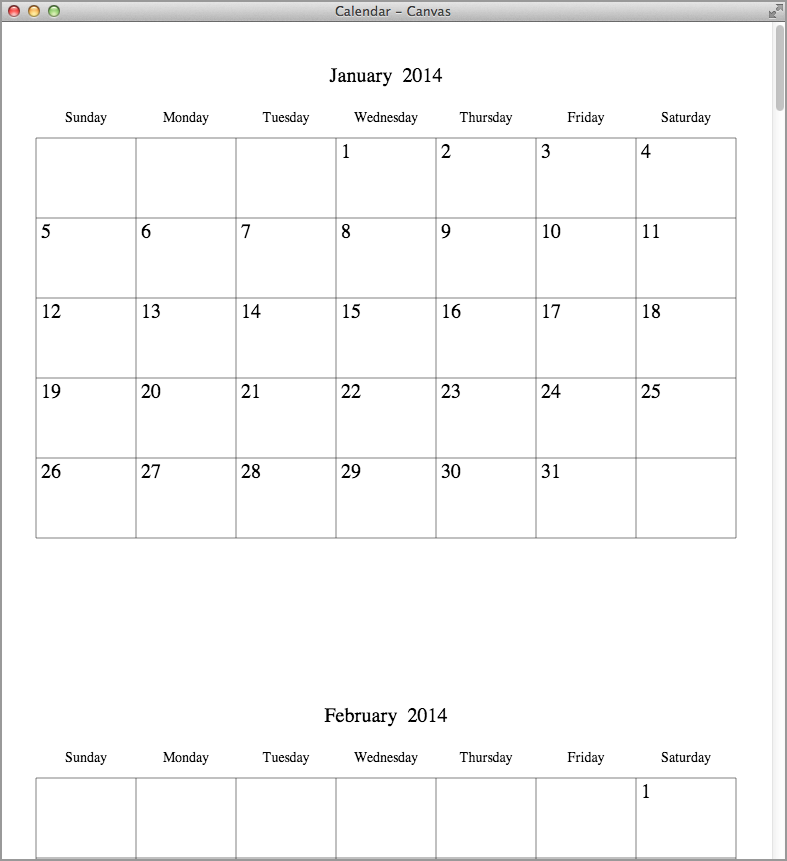
To show all the different ways of displaying graphics from a Chrome App, we’ll implement the same calendar example each way. The calendar-related part of the app, which calculates the months and days, will stay the same; only the output code will change as we go through all six variations. Figure 5-1 shows the first variation, a plain-vanilla calendar that displays as just text.
The manifest.json file is straightforward, as shown here:
{
    "app": {
        "background": {
            "scripts": [ "background.js" ]
        }
    },
    "manifest_version": 2,
    "name": "Calendar",
    "version": "1.0.0",
    "permissions": [
        {
            "fileSystem": [
                "write"
            ]
        },
        "webview"
    ]
}
The background.js file is as minimal as they get:
chrome.app.runtime.onLaunched.addListener(
    function (launchData) {
        chrome.app.window.create('index.html'),
    }
 );
The index.html file is simple, too. The CSS is designed to make the div that contains the calendar scroll:
<!DOCTYPE html>
<html lang="en">
<head>
    <meta charset="utf-8" />
    <title>Calendar</title>
    <link rel="import" href="lib/common.html">
    <script src="Calendar.js"></script>
    <style>
        body, html {
            height: 100%;
            width: 100%;
            margin: 0;
        }
        #holder {
            height: 100%;
            width: 100%;
            margin: 0 auto;
            overflow: auto;
            position: absolute;
        }
    </style>
</head>
<body>
    <div id="holder"><div id="calendar"></div></div>
</body>
</html>
Now comes the Calendar.js file that contains the calendar-producing code. This code depends on an OutputText object to do the actual rendering (plain text, in this first case):
var output = OutputText;

buildCalendar((new Date()).getFullYear());

function buildCalendar(year) {
    output.start();
    window.resizeTo(output.pageWidth(), 800);

    for (var month = 0; month < 12; month++) {
        if (month > 0)
            output.addPage();
        changeMonth(month);
        var row = 1;
        for (var day = 1; day <= 31; day++) {
            var date = new Date(year, month, day);
            if (date.getFullYear() != year || date.getMonth() != month)
                break; // day does not exist in this month
            var dayOfWeek = date.getDay();
            if (dayOfWeek === 0 && day > 1)
                row++;
            output.text(row, dayOfWeek, 'date', day.toString(), 5, 20);
        }
        drawGrid(row);
    }
    output.write();

    function changeMonth(monthToShow, wantLines) {
        var m = ['January', 'February', 'March', 'April', 'May',
          'June', 'July', 'August', 'September', 'October',
          'November', 'December'][monthToShow];
        output.text(0, 0, 'month', m + '  ' + year, 0, 24);
        ['Sunday', 'Monday', 'Tuesday', 'Wednesday',
          'Thursday', 'Friday', 'Saturday'].forEach(
            function (weekday, index) {
                output.text(0, index, 'weekday', weekday, 0, 0);
            }
        );
    }

}
We build the calendar by going through the months, from 1 to 12, and then the days of each month, from 1 to 31, stopping when we get to a day that doesn’t exist (for example, 31-April or 29-Feb in a non–leap year). The call to drawGrid at the end of the for loop for the months is empty for text output, because no grid is drawn:
function drawGrid(numRows) {
}
We’ll see the grid in subsequent examples.
OutputText, and the other output objects we’ll introduce later, has these methods:
-
OutputText.start() - Start the output, doing whatever setup work is needed.
-
OutputText.pageWidth() - Return the page width in pixels.
-
OutputText.addPage() - Begin a new page. This is needed before every month but the first.
-
OutputText.text(row, col, type, s, xOffset, yOffset) -
Output text in row
rowof the month’s page, and in week columncol(for example, column 1 for Monday).typeismonthfor a month title (for example,January 2014),weekdayfor a weekday name (for example,Monday), anddatefor a day number (for example,27). The text to output isx, and it’s offset byxOffsetandyOffset, in pixels, from the start ofrowandcol. You will see more clearly how to useOutputTextas we progress through the examples. -
OutputText.write() - Write the output if it’s been accumulated in a buffer.
-
OutputText.line(x1, y1, x2, y2) -
Draw a line from the point
(x1, y1)to(x2, y2), measured in pixels, with the origin at the upper-left corner of the page. (This is not used in the first, text-only, example.)
In the code for our text-only calendar, note that the month title and weekday names are written on row 0 of each page, and the dates are written in rows 1 through 4, 5, or 6, depending on the number of weeks in which the month’s days occur. For example, 1-March-2014 was on a Saturday; thus the 31 days in March for this particular year span six weeks, requiring that many rows of dates, as you can see in Figure 5-1.
Rendering the Calendar as Text
Following is the code for OutputText, which outputs the text calendar in Figure 5-1. Notice that the xOffset and yOffset arguments of OutputText.text are ignored, and that OutputText.line doesn’t do anything:
var calDiv = document.querySelector("#calendar");
var OutputText = (function () {
var prevRow = -1;
var para;
var api = {
cellWidth: 0,
cellHeight: 0,
start: function () {
calDiv.style['font-family'] = 'monospace';
},
text: function (row, col, type, s, xOffset, yOffset) {
if (type === 'weekday')
s = s.substr(0, 2);
else if (type === 'date' && s.length === 1)
s = ' ' + s;
if (row !== prevRow || col === 0) {
para = document.createElement('p'),
para.style['margin-left'] = '10px';
for (var i = 0; i < col; i++)
para.insertAdjacentHTML('beforeend', ' '),
calDiv.appendChild(para);
}
para.insertAdjacentHTML('beforeend', s + ' '),
prevRow = row;
},
addPage: function () {
calDiv.insertAdjacentHTML('beforeend', '<hr>'),
},
pageWidth: function () {
return 150;
},
line: function (x1, y1, x2, y2) {
},
getTextWidth: function (s, fontSize) {
return 0;
},
write: function () {
}
};
return api;
})();There are a few of things to note about OutputText.text:
-
We’ve set a monospaced font in
OutputText.start, to make it very easy to line up the columns. In later examples, we’ll use Times, which is a proportional font that makes the positioning less straightforward. - We show just the first two letters of each weekday name, so that the names line up with the dates. For the same reason, we pad one-digit dates to two characters.
-
The
row !== prevRow || col === 0condition means that we’ve gone to a new row or we’re at column 0, in either case of which we need to start a new paragraph. The column 0 case is for handling the weekday names, because they, along with the month title, are in row 0. -
If the first week of the month (a new paragraph) doesn’t begin on a Sunday, we must add padding to move the date to the correct horizontal position, which is what the
forloop does.
Note
If you can follow this text example, you’re all set to keep up as we look at the next five versions of Output objects, because, as I mentioned earlier, the buildCalendar function never changes.
Rendering the Calendar as a Table
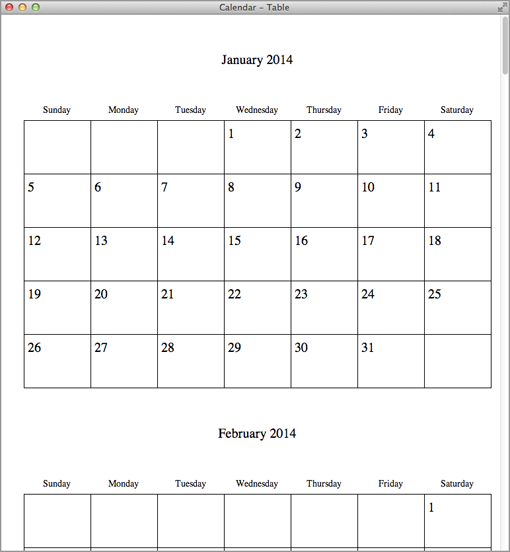
A text-only calendar is fine for a reference, but if you want to hang it on the wall, you’ll want something more like the one shown in Figure 5-2. Because it’s mostly a grid of rows and columns, the obvious way to render it is as an HTML table.
Rather than setting up a separate app example for each rendering illustration, I’ve instead combined them into one example that shows six windows. We haven’t yet encountered a background.js file that creates more than one window on an onLaunched event, but here’s one that creates six:
chrome.app.runtime.onLaunched.addListener(
    function (launchData) {
        chrome.app.window.create('index.html'),
        chrome.app.window.create('index.html',
            {
            },
            function (createdWindow) {
                createdWindow.contentWindow.outputType = 'Table';
            }
        );
        chrome.app.window.create('index.html',
            {
            },
            function (createdWindow) {
                createdWindow.contentWindow.outputType = 'HTML';
            }
        );
        chrome.app.window.create('index.html',
            {
            },
            function (createdWindow) {
                createdWindow.contentWindow.outputType = 'Canvas';
            }
        );
        chrome.app.window.create('index.html',
            {
            },
            function (createdWindow) {
                createdWindow.contentWindow.outputType = 'SVG';
            }
        );
        chrome.app.window.create('index.html',
            {
            },
            function (createdWindow) {
                createdWindow.contentWindow.outputType = 'PDF';
            }
        );
    }
);
Each window has a different value for the outputType property of the DOM window, which is accessed as createdWindow.contentWindow, where createdWindow is the argument to the chrome.app.window.create callback function—again, something else we haven’t had to use until now.
Because each of the windows loads the same index.html file (which we’ve already seen) it’s up to the Calendar.js file to decide how to render the calendar, based on the value of the outputType property. That’s done by setting the global output to the corresponding object via this switch statement:
if (!window.outputType)
    window.outputType = 'Text';

var output;

switch (window.outputType) {
case 'Text':
    output = OutputText;
    break;
case 'Table':
    output = OutputTable;
    break;
case 'HTML':
    output = OutputHTML;
    break;
case 'Canvas':
    output = OutputCanvas;
    break;
case 'SVG':
    output = OutputSVG;
    break;
case 'PDF':
    output = OutputPDF;
}
document.title = 'Calendar - ' + window.outputType;
Observe that in Calendar.js the property is referenced as window.outputType, because window is the DOM window; in background.js it was referenced as createdWindow.contentWindow.outputType.
Because the buildCalendar function was written to reference the rendering object as output, the appropriate rendering takes place according to how the switch statement sets output.
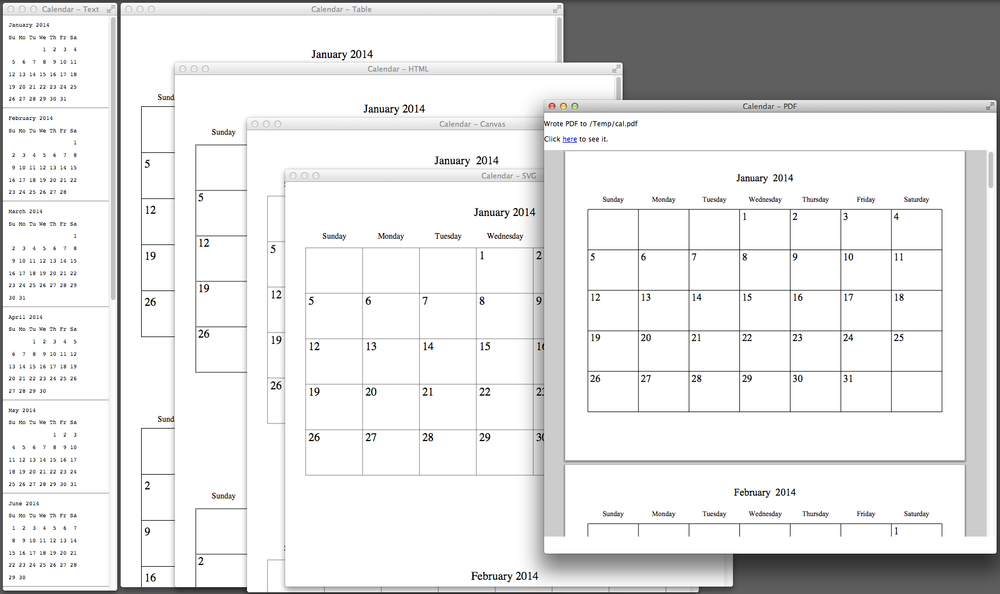
As a preview of coming attractions, Figure 5-3 shows five of the windows: the text and table versions (which we already saw) along with the HTML, Canvas, and SVG versions. The PDF rendering at the right of Figure 5-3 was captured in a PDF reader app (Preview, on Mac OS X.)
Whereas OutputText started a new paragraph, OutputTable starts a new <tr> element, and the padding for months that don’t start on a Sunday is done by appending <td> elements:
var OutputTable = (function () {
    var sizeBig = 20;
    var sizeSmall = 14;
    var marginHorz = 36;
    var marginVert = 36;
    var prevRow = -1;
    var table, tr;

    var api = {
        cellWidth: 100,
        cellHeight: 80,
        margins: {
            top: marginVert,
            bottom: marginVert,
            left: marginHorz,
            right: marginHorz
        },

        start: function () {
            table = document.createElement('table'),
            table.border = 0;
            table.cellPadding = 0;
            table.style['border-collapse'] = 'collapse';
            table.style['margin-left'] = this.margins.left + 'px';
            table.style['margin-bottom'] = this.margins.bottom + 'px';
            calDiv.appendChild(table);
        },

        text: function (row, col, type, s, xOffset, yOffset) {
            var that = this;

            if (type === 'weekday') {
                xOffset = (this.cellWidth - this.getTextWidth(s, 'small')) / 2;
                yOffset = output.cellHeight * .8;
            }
            if (row !== prevRow || col === 0) {
                if (prevRow > 0)
                    while (tr.childNodes.length < 7)
                        appendTd(tr, null, true);
                tr = document.createElement('tr'),
                table.appendChild(tr);
                prevRow = row;
            }
            while (tr.childNodes.length < col)
                appendTd(tr, null, true);
            if (type === 'month')
                appendTd(tr, s, false, 7);
            else
                appendTd(tr, s, row > 0);

            function appendTd(tr, s, border, colSpan) {
                var td = document.createElement('td'),
                td.width = that.cellWidth + 'px';
                td.height = that.cellHeight + 'px';
                if (colSpan) {
                    td.colSpan = 7;
                    td.style['text-align'] = type === 'month' ? 'center' : 'left';
                    td.style['vertical-align'] = 'bottom';
                }
                else
                    td.style['vertical-align'] = 'top';
                if (border)
                    td.style.border = '1px solid black';
                if (s) {
                    var p = document.createElement('p'),
                    p.style.fontFamily = 'Times';
                    var fSize = type === 'weekday' ? sizeSmall : sizeBig;
                    p.style.fontSize = fSize + 'px';
                    p.style['margin-top'] = ((yOffset || 0) -
                      fSize * .6) + 'px'; // Move up to position at baseline.
                    p.style['margin-left'] = (xOffset || 0) + 'px';
                    p.style['margin-bottom'] = 0;
                    p.style['margin-right'] = 0;
                    p.innerText = s;
                    td.appendChild(p);
                }
                tr.appendChild(td);
            }
        },

        addPage: function () {
        },

        pageWidth: function () {
            return this.margins.left + 7 * this.cellWidth + this.margins.right;
        },

        line: function (x1, y1, x2, y2) {
            // table has the lines
        },

        getTextWidth: function (s, fontSize) {
            return measureText(s,
              fontSize === 'small' ? sizeSmall : sizeBig);
        },

        write: function () {
            for (var c = tr.childNodes.length; c < 7; c++)
                api.text(prevRow, c, 'date'),
        }
    };
    return api;
})();
The month titles are written into <td> elements that span all seven columns. Most of the code has to do with setting up CSS for the HTML elements to handle the offset arguments to OutputTable.text and to handle horizontal and vertical alignment. This code isn’t hard to follow, but it’s hard to explain the principles behind it, except to say that I kept revising it until the table looked the way I wanted it to. That’s generally how CSS gets written, in any app. We’ll see later that the graphical rendering techniques—Canvas, SVG, and PDF—are much easier to work with when it comes to positioning.
HTML elements such as <p> use the top for positioning (CSS top attribute), whereas the graphical techniques (Canvas, SVG, and PDF) use the baseline, as shown in Figure 5-4.
The buildCalendar function assumes baseline positioning, which is why OutputTable.text adjusts the text up in the internal appendTd function. (We’ll see the same thing in OutputHTML.) An adjustment of .6 of the font size seems to do the trick:
p.style['margin-top'] = ((yOffset || 0) - fSize * .6) + 'px';
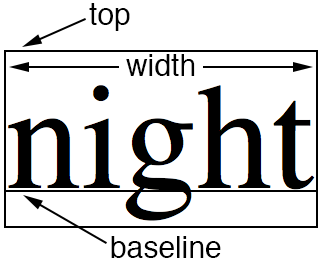
Weekday names need to be centered in their cells, which is done by computing their x offset, for which we need to know their width in pixels (see Figure 5-4). You do this by using the OutputTable.getTextWidth method, which calls measureText (see Example 5-1), a function based on one contributed to Stack Overflow.
function measureText(text, fontSize) {
    var div = document.createElement('div'),
    document.body.appendChild(div);
    div.style.fontFamily = 'Times';
    div.style.fontSize = fontSize + 'px';
    div.style.position = 'absolute';
    div.style.left = -1000;
    div.style.top = -1000;
    div.innerHTML = text;
    var width = div.clientWidth;
    document.body.removeChild(div);
    return width;
}
All this function does is add a <div> element to the document, measure it, and then get rid of it.
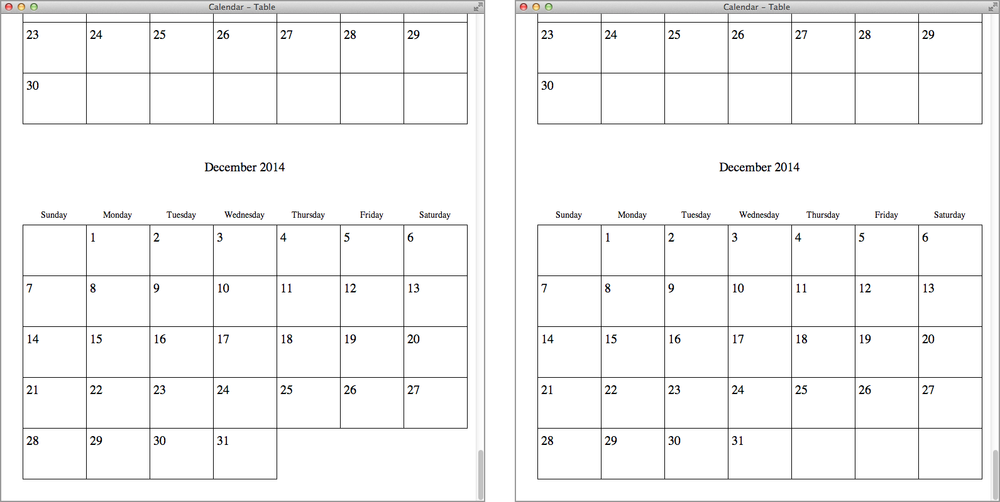
The OutputTable.write method fixes a quirk of tables when the border-collapse attribute is set to collapse: empty cells on the last row don’t have rules, as shown in the left window in Figure 5-5. The problem is fixed by writing a suitable number of empty cells, as shown in the right window. This is another reason why outputting tables requires a lot of tuning before things look the way you want them to.
Rendering the Calendar as Positioned HTML
All right, one more HTML-based rendering before we get into the juicy graphical stuff, this time with what I call “positioned HTML.” What we’re going to do is output HTML <p> and <hr> elements, using CSS pixel positioning to place them exactly where we want them. This is actually easier than using tables because we don’t need to wrestle with the automatic layout that tables want to control. It’s a technique that probably ought to be used more often than it is.
One HTML oddity that we’ll exploit is that, at least in Chrome, you can draw a vertical line with an <hr> element. All you need to do is define the height greater than the width.
Here’s the code for OutputHTML:
var OutputHTML = (function () {
    var sizeBig = 20;
    var sizeSmall = 14;
    var marginHorz = 36;
    var marginTop = 36;

    var api = {
        cellWidth: 100,
        cellHeight: 80,
        pageOffset: marginTop,
        margins: {
            top: marginTop,
            bottom: 0,
            left: marginHorz,
            right: marginHorz
        },

        start: function () {
        },

        text: function (row, col, type, s, xOffset, yOffset) {
            if (type === 'weekday') {
                xOffset = (this.cellWidth - this.getTextWidth(s, 'small')) / 2;
                yOffset = output.cellHeight * .8;
            }
            var p = document.createElement('p'),
            p.innerText = s;
            p.style.margin = 0;
            p.style.padding = 0;
            p.style.fontFamily = 'Times';
            var fSize = type === 'weekday' ? sizeSmall : sizeBig;
            p.style.fontSize = fSize + 'px';
            p.style.position = 'absolute';
            p.style.top = (this.pageOffset + row * this.cellHeight + yOffset -
              fSize * .6) + 'px'; // Move up to position at baseline.
            p.style.left = (this.margins.left + col * this.cellWidth +
              xOffset) + 'px';
            if (type === 'month')
                p.style.width = 7 * (this.cellWidth) + 'px';
            else
                p.style.width = this.cellWidth + 'px';
            p.style['text-align'] = type === 'month' ? 'center' : 'left';
            calDiv.appendChild(p);
        },

        addPage: function () {
            this.pageOffset += 8 * this.cellHeight;
        },

        pageWidth: function () {
            return this.margins.left + 7 * this.cellWidth + this.margins.right;
        },

        line: function (x1, y1, x2, y2) {
            var hr = document.createElement('hr'),
            hr.setAttribute('noshade', true);
            hr.style.position = 'absolute';
            hr.style.top = (this.pageOffset + Math.min(y1, y2)) + 'px';
            hr.style.left = (this.margins.left + Math.min(x1, x2)) + 'px';
            if (x1 === x2) {
                hr.style.width = '.1px';
                hr.style.height = (Math.abs(y2 - y1) - 1) + 'px';
            }
            else {
                hr.style.width = (Math.abs(x2 - x1) - 1) + 'px';
                hr.style.height = '.1px';
            }
            calDiv.appendChild(hr);
        },

        getTextWidth: function (s, fontSize) {
            return measureText(s,
              fontSize === 'small' ? sizeSmall : sizeBig);
        },

        write: function () {
        }
    };
    return api;
})();
This object is much simpler than OutputTable. Now, the lines are actually drawn by using the OutputHTML.line method; OutputText didn’t draw lines at all, and OutputTable used table borders.
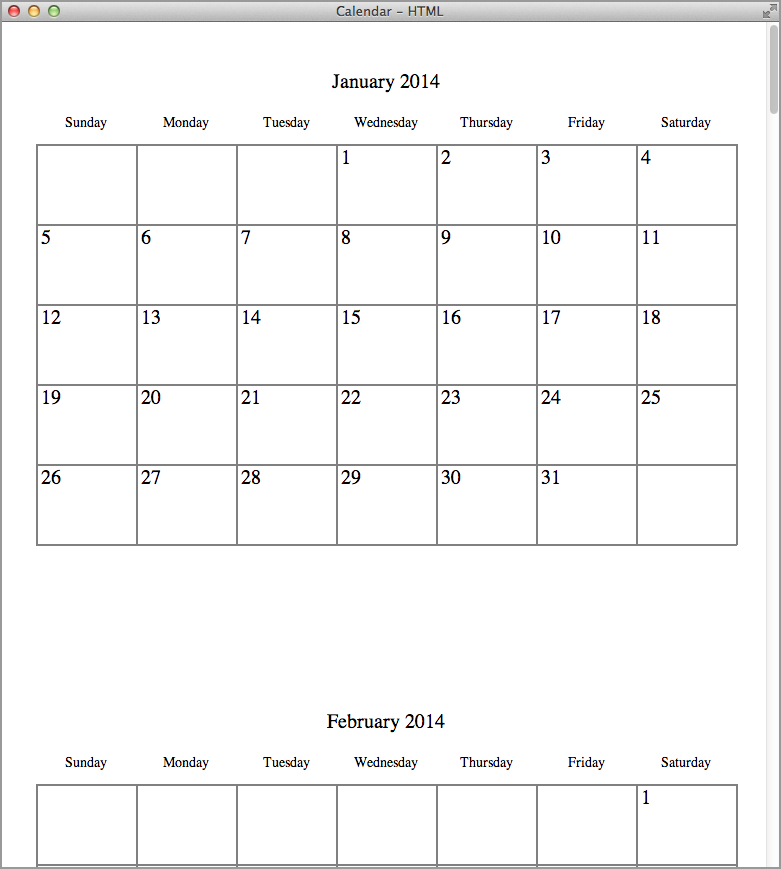
Here, as in OutputTable, buildCalendar expects text to be vertically positioned on the baseline, which is how Canvas, SVG, and PDF output behave, whereas a <p> element’s top attribute refers to its top (refer back to Figure 5-4). This difference is handled, as before, in OutputTable.text by fudging the paragraph up a bit, the results of which you can see in Figure 5-6.
HTML5 Canvas
New in HTML5, a canvas allows you to draw pixels on a raster-based, fixed-sized area that you define by using a <canvas> element. Unlike all other HTML elements, there’s no way to specify what’s on the canvas with HTML—for that, you need to use the JavaScript Canvas API.
The canvas holds only the pixels you’ve placed there, and nothing else. It has no memory of the drawing operations themselves (rectangles, lines, text, and so on). After you draw it, you cannot modify or delete a shape, although you can certainly draw over it. Also, you can’t attach event handlers to shapes, because they don’t exist on the canvas, although you can certainly attach event handlers to the <canvas> element as a whole, because it does exist.
That much said, drawing on a canvas is pretty convenient, and it affords the sort of operations you’d expect in a modern graphics package. After a canvas is drawn, it’s also possible to get its pixels as an image and even write them out as a file, such as a PNG or a JPEG.
A good source of detailed information is the book HTML5 Canvas, Second Edition by Steve Fulton and Jeff Fulton (O’Reilly). Here I’ll just introduce a few basic Canvas API calls; there are many more that I won’t cover.
A Simple Canvas Example
We’ll first look at a simple canvas example and then show the OutputCanvas object, which can draw a calendar onto a canvas. The simple example utilizes this index.html file, which does nothing more than create a <canvas> element:
<!DOCTYPE html>
<html lang="en">
<head>
    <meta charset="utf-8" />
    <title>Canvas Example</title>
    <script src="Canvas.js"></script>
  </head>
<body style='margin: 0;'>
<canvas width="510" height="510"></canvas>
</body>
</html>
Because we’ll be writing the canvas to a JPEG file, we need write permission on the filesystem:
"permissions": [
    {
        "fileSystem": [
            "write"
        ]
    }
]
The background.js is the usual boring one that just opens a window (one window!).
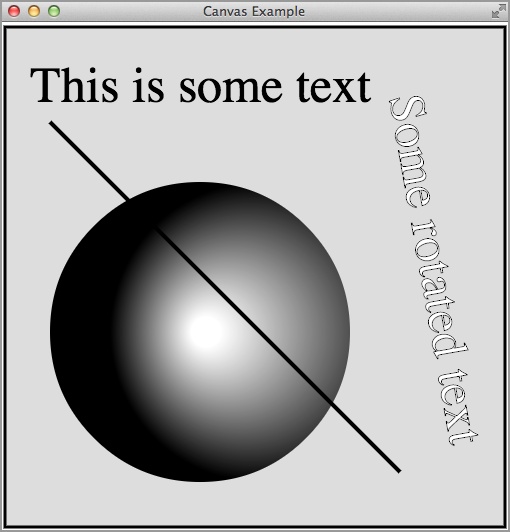
This example draws the shapes shown in Figure 5-7.
First comes the canvas object itself and the two-dimensional context within which we actually draw:
var canvas = document.querySelector('canvas'),
var context = canvas.getContext('2d'),
Note
For now, only 2d is officially supported; there’s also webgl for 3D, but as of this writing it’s experimental.
Next, we draw the outer black border and the gray interior:
context.fillStyle = '#ddd';
context.strokeStyle = 'black';
context.lineWidth = 3;
context.fillRect(5, 5, 500, 500);
context.strokeRect(5, 5, 500, 500);
The arguments of the fillRect method are the starting x and y coordinates (upper left of the rectangle) and the width and height. The strokeRect method is similar.
There’s no actual circle method; instead, you create an arc path and fill it, as shown by this code, which draws a circle with a gradient fill:
var gradient = context.createRadialGradient(200, 310, 0, 260, 310, 150);
gradient.addColorStop(.1, "white");
gradient.addColorStop(1, "black");

context.beginPath();
context.arc(200, 310, 150, 0, 2 * Math.PI);
context.fillStyle = gradient;
context.fill();
The first three arguments to createRadialGradient are the x and y coordinates of the center of the starting circle, followed by its radius. The last three arguments are for the ending circle. The addColorStop method sets a color transition for the gradient; its arguments are a position in the range 0 to 1 between the start and end, and a color. Here, white is located 10 percent from the start (the inner circle), and black is at the end.
The arguments to arc are the x and y coordinates of the center, the radius, and the starting and ending angles in radians. For a circle, the start angle is 0° and the end is 360°, which is 2π radians. The fill method closes the path and fills the circle with the gradient.
Next, let’s add some text at the top of the drawing:
context.font = "50px Times";
context.fillText('This is some text', 30, 80);
The last two arguments to fillText are the x and y coordinates. The y coordinate is that of the baseline (again, refer back to Figure 5-4).
context.save();
context.translate(420, 250);
context.rotate(Math.PI / 180 * 80);
context.textAlign = "center";
context.fillStyle = "white";
context.lineWidth = 1;
context.fillText("Some rotated text", 0, 0);
context.strokeText("Some rotated text", 0, 0);
context.restore();
The translate and rotate methods rotate the entire context, not specifically the text. The fillText method then draws in this modified coordinate system. The text is also stroked, to create the outlined effect that you can see in Figure 5-7. The context is saved before the translation and rotation, and then restored, so subsequent canvas operations won’t be affected.
Finally, here’s code to stroke a line from (50, 100) to (400, 450) in the original coordinates system and to call saveFile to save the drawing in a file (which we’re going to see next):
context.lineWidth = 4;
context.beginPath();
context.moveTo(50, 100);
context.lineTo(400, 450);
context.stroke();

saveFile(canvas);
The saveFile function creates a Blob from the canvas and then writes it to a file chosen by the user.
Note
All the file API calls are explained in Chapter 2.
function saveFile(cvs) {
    var blob = dataURItoBlob(cvs.toDataURL('image/jpeg'));
    chrome.fileSystem.chooseEntry(
        {
            type: 'saveFile',
            suggestedName: 'canvas.jpg'
        },
        function(entry) {
            writeFileEntry(entry, blob,
                function(e) {
                    if (e.target.error)
                        errorHandler(e);
                    else
                        console.log('Saved.'),
                }
            );
        }
    );
}

function writeFileEntry(entry, blob, callback) {
    if (entry)
        entry.createWriter(
            function(writer) {
                writer.onerror = errorHandler;
                writer.truncate(0);
                writer.onwriteend = function () {
                    writer.write(blob);
                    writer.onwriteend = callback;
                };
            },
            errorHandler
        );
}

function errorHandler(e) {
    if (e.target.error)
        console.log(e.target.error.message);
    else
        console.log(e);
}
Here’s the code that converts a canvas to a blob, based on code posted on Stack Overflow:
function dataURItoBlob(dataURI, dataTYPE) {
    if (!dataTYPE)
        dataTYPE = 'image/jpeg';
    var binary = atob(dataURI.split(',')[1]);
    var array = [];
    for(var i = 0; i < binary.length; i++)
        array.push(binary.charCodeAt(i));
    return new Blob([new Uint8Array(array)], {type: dataTYPE});
}
The technique here is that we first get a data URI by using the Canvas API toDataURL call, and then we convert its data to a Uint8Array, from which we can directly create a Blob. The resulting JPEG looks exactly like the drawing in Figure 5-7.
Drawing the Calendar by Using a Canvas
Because a canvas is fundamentally graphical, it’s easier to draw the calendar into a canvas than it is to mess around with tables and HTML, for which positioning was a design afterthought. We’ve already seen all of the canvas operations in OutputCanvas, except for measureText, which is built in to the Canvas API, so we don’t need the function that appeared in Example 5-1. Here’s the code, which is much more straightforward than the earlier output objects:
var OutputCanvas = (function () {
    var sizeBig = 20;
    var sizeSmall = 14;
    var marginHorz = 36;
    var marginTop = 36;
    var canvas;
    var ctx;

    var api = {
        cellWidth: 100,
        cellHeight: 80,
        pageOffset: marginTop,
        margins: {
            top: marginTop,
            bottom: 0,
            left: marginHorz,
            right: marginHorz
        },

        start: function () {
            canvas = document.createElement('canvas'),
            canvas.width = this.pageWidth();
            canvas.height = 12 * 8 * this.cellHeight;
            calDiv.appendChild(canvas);
            ctx = canvas.getContext('2d'),
        },

        text: function (row, col, type, s, xOffset, yOffset) {
            var x, y;
            var fontSize = type === 'weekday' ? sizeSmall : sizeBig;

            if (type === 'weekday') {
                xOffset = (this.cellWidth - this.getTextWidth(s, 'small')) / 2;
                yOffset = output.cellHeight * .8;
            }
            ctx.font = fontSize + "px serif";
            if (type === 'month') {
                var titleWidth = this.getTextWidth(s, fontSize);
                x = (this.pageWidth() - titleWidth) / 2;
                y = this.pageOffset + yOffset;
            }
            else {
                x = this.margins.left + col * this.cellWidth + xOffset;
                y = this.pageOffset + row * this.cellHeight + yOffset;
            }
            ctx.fillText(s, x, y);
        },

        addPage: function () {
            this.pageOffset += 8 * this.cellHeight;
        },

        pageWidth: function () {
            return this.margins.left + 7 * this.cellWidth + this.margins.right;
        },

        line: function (x1, y1, x2, y2) {
            ctx.lineWidth = .5;
            ctx.beginPath();
            ctx.moveTo(this.margins.left + x1, this.pageOffset + y1);
            ctx.lineTo(this.margins.left + x2, this.pageOffset + y2);
            ctx.stroke();
        },

        getTextWidth: function (s, fontSize) {
            ctx.font = (fontSize === 'small' ? sizeSmall : sizeBig) + "px serif";
            return ctx.measureText(s).width;
        },

        write: function () {
        }
    };
    return api;

})();
Figure 5-8 shows the calendar rendered onto a canvas (the “Calendar - Canvas” window in Figure 5-3).
Scalable Vector Graphics (SVG)
Unlike a canvas, which retains only the pixels, an SVG image is composed of discrete objects, which are represented in the DOM. This means that you can construct an SVG image directly in an HTML file, like this:
<!DOCTYPE html>
<html lang="en">
<head>
<meta charset="utf-8" />
<title>Simple SVG Example</title>
</head>
<body>
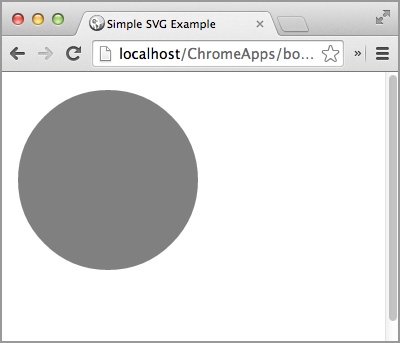
<svg>
<circle cx="100" cy="100" r="90" fill="gray"/>
</svg>
</body>
</html>Figure 5-9 shows the output in Chrome (as an HTML page, not as an app).
The only way to draw an SVG image is by adding elements to an <SVG> tag; there’s no drawing API as there is with canvases, for which the API is the only way to draw. They’re opposites in this respect.
Canvases came with HTML5, but SVG is much older, having been standardized by the W3C since 1999. You can study the API at www.w3.org/TR/SVG, or you can get the book SVG Essentials, Second Edition by J. David Eisenberg and Amelia Bellamy-Royds (O’Reilly).
Another SVG Example
In this section, we’ll look at a more elaborate example—this time as a Chrome App—which draws some shapes similar to those we drew with a canvas (Figure 5-7). Figure 5-10 presents the SVG version.
This app’s background.js just opens a window loaded from index.html, and its manifest.json requests no permissions. Here’s the index.html file:
<!DOCTYPE html>
<html lang="en">
<head>
    <meta charset="utf-8" />
    <title>SVG Example</title>
    <script src="SVG.js"></script>
  </head>
<body style='margin: 0;'>
<svg width="510" height="510">
    <defs>
        <radialGradient id="circleGrad">
            <stop offset="10%" stop-color="white" />
            <stop offset="100%" stop-color="black" />
        </radialGradient>
    </defs>
    <rect x="5" y="5" width="500" height="500" stroke-width="3"
      stroke="black" fill="#ddd" />
    <circle cx="200" cy="310" r="150" fill="url(#circleGrad)"/>
    <text font-size="50" font-family="Times" x="430" y="50"
      fill="white" stroke="black"
      transform="rotate(80 400,40)">
        Some rotated text
    </text>
    <line x1="50" y1="100" x2="400" y2="450"  stroke-width="4"
      stroke="black" />
</svg>
</body>
</html>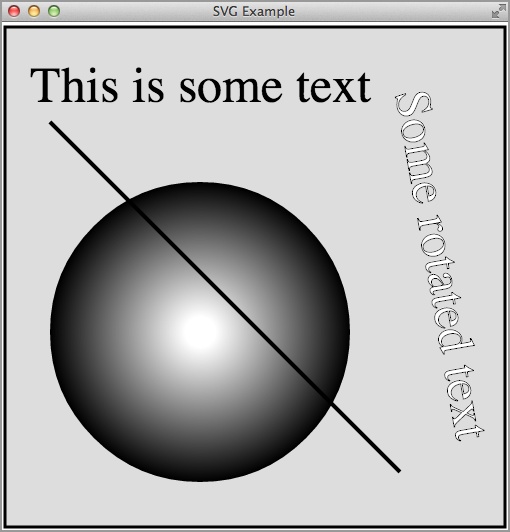
In the <defs> element, there’s a definition for a gradient, somewhat like the one we saw in A Simple Canvas Example, except here we didn’t need to define a center or starting and ending circles.
Next comes the background gray rectangle with a black border, represented by a single <rect> element. Then, the circle filled by the gradient that we defined. After that, some rotated text, both filled and stroked, and finally the line.
But where’s the horizontal text, “This is some text”? That element is created by the JavaScript in SVG.js (referenced from the index.html file):
window.onload = function () {

var svg = document.querySelector('svg'),
var text = document.createElementNS("http://www.w3.org/2000/svg", "text");
text.setAttribute('font-family', 'Times'),
text.setAttribute('font-size', 50);
text.setAttribute('x', 30);
text.setAttribute('y', 80);
var textNode = document.createTextNode('This is some text'),
text.appendChild(textNode);
svg.appendChild(text);

};
Notice that you create SVG elements by using document.createElementNS (NS stands for namespace), not with document.createElement, and you must specify the namespace, as we did in this line:
var text = document.createElementNS("http://www.w3.org/2000/svg", "text");Differences Between Canvas and SVG
Apart from the methods you use to draw, there are several other differences between SVG and Canvas:
- Because SVG elements exist as long as the drawing does, you can modify or delete them from JavaScript, just as you can any DOM element. By contrast, a canvas keeps its pixels but has no memory of how they got there.
- Many drawing programs can export images as SVG, which you can then incorporate into an HTML file.
- You can attach event handlers to SVG elements (as we’ll see later).
- SVG images scale as the resolution of the window changes, whereas a canvas never changes from the resolution at which it was drawn.
This last point is demonstrated in Figure 5-11, which shows the canvas and SVG examples zoomed in a browser to 500 percent. The SVG scales right up, whereas the pixels for the canvas version just get bigger. Although this is an important difference in many web applications, it doesn’t matter much in Chrome apps, because an app window can’t zoom. (To prepare the figure, I had to create the drawings in a browser window.)

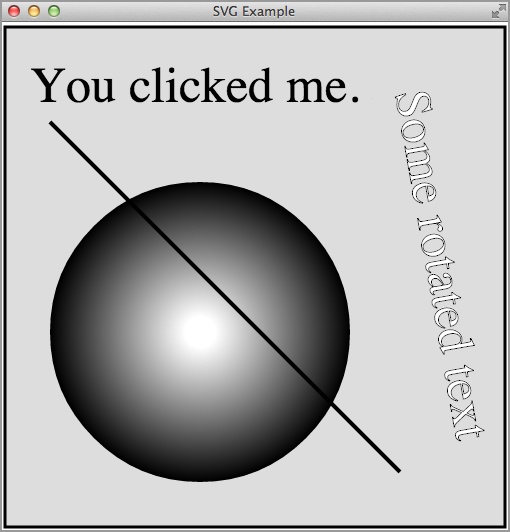
To show how to attach an event handler to an SVG element, here’s some additional code added to SVG.js:
text.addEventListener('click',
    function (e) {
        textNode.data = "You clicked me.";
    }
);
Now, when you click on the text at the top of Figure 5-10, you see the results depicted in Figure 5-12.
How do you decide whether to use a canvas or an SVG? Here are some considerations:
- If you’re going to draw in JavaScript, calling the Canvas API is much easier than creating SVG elements, modifying their attributes, and inserting them into parent elements.
- If you have hundreds or thousands of shapes, a canvas will be much more efficient because all those shapes don’t have to persist as DOM elements. Thus, a canvas is probably a better choice for games and other highly interactive applications.
- If you need scalability or need to add event handlers, SVG is a better choice.
- If a designer rather than a programmer is to draw the image, SVG is more approachable.
- There are several canvas JavaScript libraries (KineticJS, EaselJS, Fabric, Paper, and so on) that make drawing easier; there are far fewer SVG libraries.
Drawing the Calendar by Using SVG
Figure 5-13 shows the calendar rendered via SVG; it’s almost indistinguishable from the canvas version in Figure 5-8.

The code for OutputSVG is similar to OutputCanvas, too, when you account for the fact that, instead of drawing shapes, SVG elements are created:
var OutputSVG = (function () {
    var sizeBig = 20;
    var sizeSmall = 14;
    var marginHorz = 36;
    var marginTop = 36;
    var svg;

    var api = {
        cellWidth: 100,
        cellHeight: 80,
        pageOffset: marginTop,
        margins: {
            top: marginTop,
            bottom: 0,
            left: marginHorz,
            right: marginHorz
        },

        start: function () {
            svg = document.createElementNS("http://www.w3.org/2000/svg", "svg");
            svg.setAttribute('width', this.pageWidth());
            svg.setAttribute('height', 12 * 8 * this.cellHeight);
            calDiv.appendChild(svg);
        },

        text: function (row, col, type, s, xOffset, yOffset) {
            var x, y;
            var fontSize = type === 'weekday' ? sizeSmall : sizeBig;

            if (type === 'weekday') {
                xOffset = (this.cellWidth - this.getTextWidth(s, 'small')) / 2;
                yOffset = output.cellHeight * .8;
            }
            if (type === 'month') {
                var titleWidth = this.getTextWidth(s, fontSize);
                x = (this.pageWidth() - titleWidth) / 2;
                y = this.pageOffset + yOffset;
            }
            else {
                x = this.margins.left + col * this.cellWidth + xOffset;
                y = this.pageOffset + row * this.cellHeight + yOffset;
            }
            var text = createSVGText(s, fontSize);
            text.setAttribute('x', x);
            text.setAttribute('y', y);
            svg.appendChild(text);
        },

        addPage: function () {
            this.pageOffset += 8 * this.cellHeight;
        },

        pageWidth: function () {
            return this.margins.left + 7 * this.cellWidth + this.margins.right;
        },

        line: function (x1, y1, x2, y2) {
            var line = document.createElementNS("http://www.w3.org/2000/svg",
              "line");
            line.setAttribute('x1', this.margins.left + x1);
            line.setAttribute('y1', this.pageOffset + y1);
            line.setAttribute('x2', this.margins.left + x2);
            line.setAttribute('y2', this.pageOffset + y2);
            line.setAttribute('stroke', 'black'),
            line.setAttribute('stroke-width', .5);
            svg.appendChild(line);
        },

        getTextWidth: function (s, fontSize) {
            var text = createSVGText(s, fontSize);
            svg.appendChild(text);
            var w = text.getComputedTextLength();
            svg.removeChild(text);
            return w;
        },

        write: function () {
        }
    };
    return api;

    function createSVGText(s, fontSize) {
        var text = document.createElementNS("http://www.w3.org/2000/svg", "text");
        text.setAttribute('font-family', 'Times'),
        text.setAttribute('font-size', fontSize);
        var textNode = document.createTextNode(s);
        text.appendChild(textNode);
        return text;
    }

})();
Creating PDFs
If you’ve been reading this book all the way to this point, you’ve learned about files, databases, networking, and graphics, but you might be wondering why I never mentioned printing. After all, typical productivity apps for Mac OS X, Windows, and Linux provide a way to print, and Google clearly wants Chrome Apps to be on a par with them someday. Here’s why I haven’t mentioned printing: you can’t do it. There’s no Chrome or HTML API for printing, other than for printing a whole window. Instead, you create a PDF file and let the user print it outside of the app.
There’s no standard API for PDFs either, but there are a few third-party JavaScript libraries you can use. I’ve tried only jsPDF, which has some rough edges, but it works, so that’s the one I’ll describe here. You can read about it and download it from github.com/MrRio/jsPDF and parall.ax/products/jspdf. (.ax is the top-level domain for the Åland Islands. Cute!)
One thing about all the PDF libraries I’ve looked at, including those for PHP, is that you build up the PDF file, but nothing is output until you explicitly write it. That’s the chief motivation for having the write method in all of the Output objects we’ve been studying. In a conventional web app that creates a PDF from JavaScript, there’s no good place to write it to, because all files are sandboxed. But, we know from Chapter 2 and what we’ve already seen in this chapter that you can easily write a PDF to an external file. We’ll see the code for that shortly.
Because the file:// protocol isn’t allowed, there’s no way to open the PDF as an external file in an app window or even in a browser window. However, as we’ll see when we get to the OutputPDF calendar object, you can read the FileEntry for the PDF as a data URL and refer to it that way, either as a link to a browser (outside of the Chrome App) or as a <webview> element placed directly in the Chrome App window. Of course, the user can certainly locate the file manually (the user previously chose the location and name for it) and open it manually, by double-clicking it, for example.
A Simple PDF Example
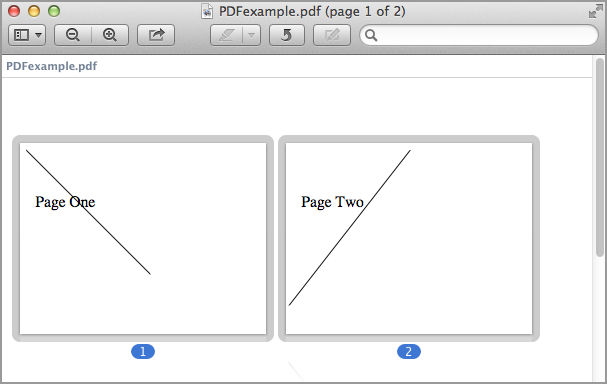
Let’s begin our look at jsPDF with a simple example that creates a two-page PDF, as illustrated in Figure 5-14.
The index.html file is about as simple as it can be:
<!DOCTYPE html>
<html lang="en">
<head>
    <meta charset="utf-8" />
    <title>PDF Example</title>
    <link rel="import" href="lib/common.html">
    <script src="PDF.js"></script>
</head>
<body>
</body>
</html>
The background.js file is also minimal:
chrome.app.runtime.onLaunched.addListener(
    function (launchData) {
        chrome.app.window.create('index.html'),
    }
);
Because the example will write a PDF to a file, you need to request fileSystem permission in the manifest.json file, which we’ve seen a bunch of times already:
"permissions": [
    {
        "fileSystem": [
            "write"
        ]
    }
]
To use PDF.js, it’s necessary to include several files that come with it, loaded by common.html, but I’ll postpone showing exactly what’s loaded and how until later, when I explain how the calendar is rendered as a PDF.
Here’s the code using PDF.js for this simple example:
var pdf = new jsPDF('l', 'pt', 'letter'),
pdf.setFont('Times', 'Roman'),
pdf.setFontSize(50);
pdf.text('Page One', 50, 200);
pdf.setLineWidth(3);
pdf.lines([[400, 400]], 20, 20);
pdf.addPage();
pdf.text('Page Two', 50, 200);
pdf.setLineWidth(3);
pdf.lines([[-390, 500]], 400, 20);
pdf.output('save'),
Here are some hints to reading the nonobvious parts of the code:
- The constructor specifies landscape orientation (as opposed to portrait), dimensions in points, and letter-size paper.
- The origin is at the upper left of the page.
-
The arguments to the
linesmethod mean that the line starts at the point given by the last two arguments and extends to the point given by the first argument, which is relative to the starting point. The complex first argument allows for Bezier curves, but here I’m just drawing a line. See the documentation at mrrio.github.io/jsPDF/doc for all the gory details. -
The
outputmethod as it comes is set up to show the PDF in a browser window, but that won’t work with Chrome Apps, because the app’s window is not a browser window. Instead, there’s an undocumentedsaveargument that invokes a globalsaveAsmethod that you must supply:
saveAs(blob, options)
The blob argument is a Blob representing the PDF, and the options argument is whatever was passed as a second argument to output (which in the preceding example is nothing). My implementation of saveAs lets the user choose a file and then saves the PDF to that file:
function saveAs(blob, options) { // Must be global.
    chrome.fileSystem.chooseEntry(
        {
            type: 'saveFile'
        },
        function (entry) {
            if (entry)
                saveToEntry(blob, options, entry);
        }
    );
}

function saveToEntry(blob, options, entry) {
    entry.createWriter(
        function(writer) {
            writer.onerror = errorHandler;
            writer.truncate(0);
            writer.onwriteend = function () {
                writer.write(blob);
                writer.onwriteend = function () {
                    if (options.callback)
                        options.callback(blob, entry);
                };
            };
        },
        errorHandler
    );
}

function errorHandler(e) {
    console.log(e);
}
Note
The various file API calls were described in Chapter 2.
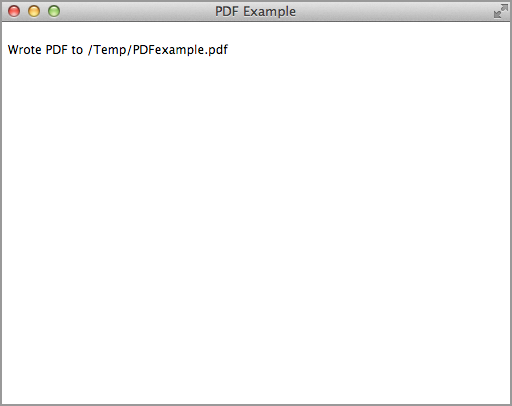
I’ve implemented things so that a callback function can be supplied to output, which allows the calling app to arrange to do more with the PDF than just write it to a file. For instance, here’s a version that displays the saved path to the user, using chrome.fileSystem.getDisplayPath, which is described in Chapter 2:
pdf.output('save',
    {
        callback: function (blob, entry) {
            chrome.fileSystem.getDisplayPath(entry,
                function callback(displayPath) {
                    document.querySelector("body").
                      insertAdjacentHTML('beforeend',
                      '<p>Wrote PDF to ' + displayPath);
                }
            );
        }
    }
);
You can see the output in Figure 5-15.
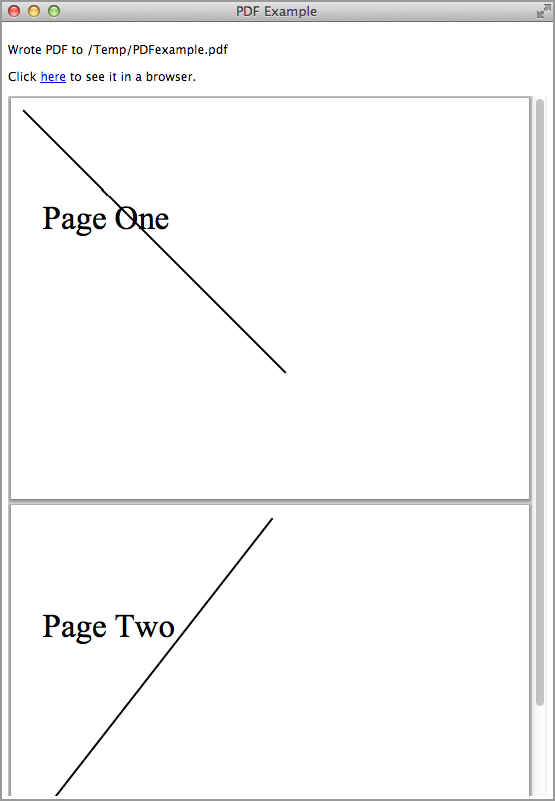
Although jsPDF’s built-in output option to show a PDF won’t work with Chrome Apps, you can do the same thing by generating a data URL from the Blob, somewhat similar to what we did to show images in Accessing the Facebook API. It’s also useful to provide a link so that the PDF will show in a browser—as long as the link specifies target="_blank" so that it’s shown in the default browser. (Recall that Chrome Apps are forbidden to do any navigation within themselves.)
Here’s another version of a call to output that displays a link and also shows the PDF in a <webview> element:
pdf.output('save',
    {
        callback: function (blob, entry) {
            chrome.fileSystem.getDisplayPath(entry,
                function callback(displayPath) {
                    document.querySelector("body").
                      insertAdjacentHTML('beforeend',
                      '<p>Wrote PDF to ' + displayPath);
                    showPDF(blob);
                }
            );
        }
    }
);

function showPDF(blob) {
    var reader = new FileReader();
    reader.onload = function(event) {
        document.querySelector("body").
          insertAdjacentHTML('beforeend',
          'Click <a target="_blank" href="' + event.target.result +
            '">here</a> to see it in a browser.'),
        document.querySelector("body").
          insertAdjacentHTML('beforeend',
          '<p><webview src="' + event.target.result +
            '" style="width:100%; height:700px;"></webview>'),
    };
    reader.onerror = function(e) {
        console.log(e);
    };
    reader.readAsDataURL(blob);
}
To use a webview, you need webview permission in the manifest.json file:
"permissions": [
    {
        "fileSystem": [
            "write"
        ]
    },
    "webview"
]
Figure 5-16 shows the output in the Chrome App window. If you click on the link, you see the same PDF in a browser. If you hover the mouse pointer over the embedded PDF in the Chrome App window, you see some controls, but only the zooming controls work. Unfortunately, clicking the save and print icons does nothing. That’s not true of the PDF display in a browser, of course—there, the controls actually work. (There’s no need for the user to save the PDF in a file, because it has already been saved in a location of the user’s choosing.)
Thus, you have three ways to provide a PDF to the user:
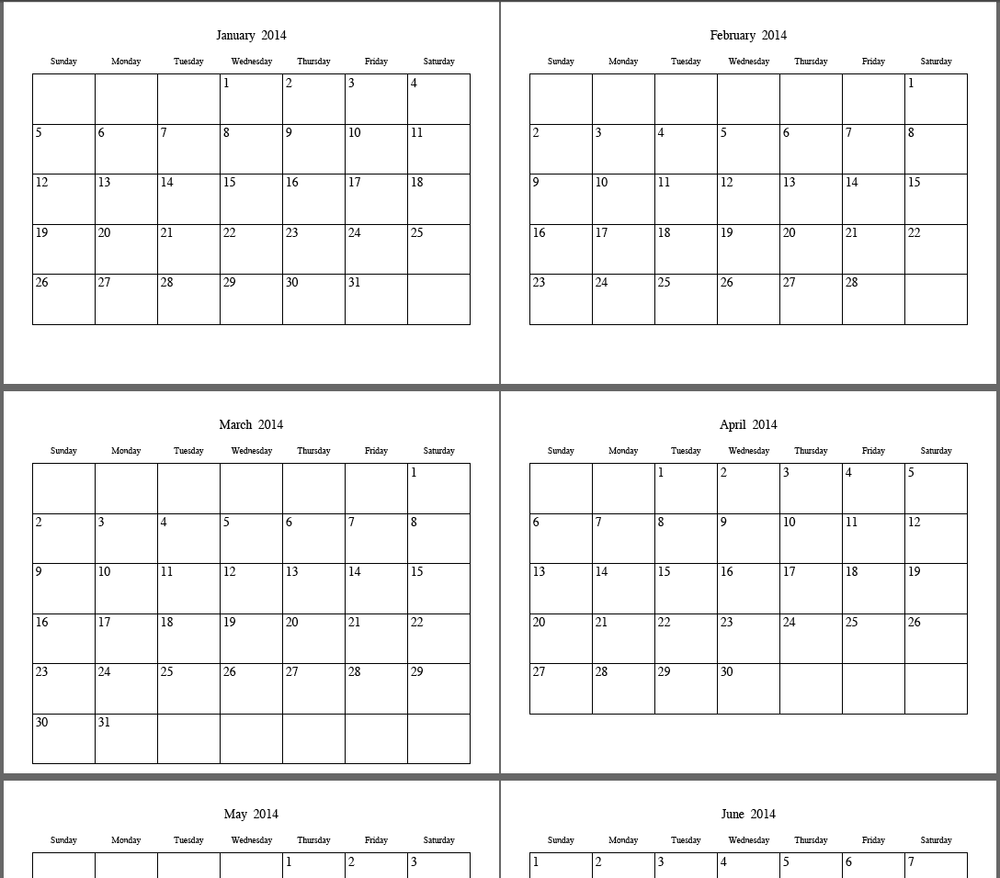
Outputting the Calendar as a PDF
We now have almost everything we need to show the calendar as a PDF, which you can see in Figure 5-17. There are two API calls the calendar example needs that are present in the jsPDF implementation, but not as exposed interfaces. (This is what I meant earlier when I said that jsPDF had some rough edges.) We can get around that limitation by subclassing jsPDF with a new, extended class jsPDFX, like this (in the jsPDFX.js file):
function jsPDFX(orientation, unit, format, compressPdf) {
    var pdf = new jsPDF(orientation, unit, format, compressPdf);
    var pdfx = Object.create(pdf);

    pdfx.getWidth = function (s) {
        return pdfx.getStringUnitWidth(s) * pdfx.internal.getFontSize() /
          pdfx.internal.scaleFactor;
    };
    pdfx.getPageSize = function () {
        return pdfx.internal.pageSize;
    };
    return pdfx;
}
In the OutputPDF code that we’re going to see shortly, we instantiate jsPDFX rather than jsPDF.
We need to load two plug-ins that come with jsPDF as well as the base file and our two files saveAs.js and jsPDFX.js:
<script src="saveAs.js"></script>
<script src="jsPDFX.js"></script>
<script src="jspdf.js"></script>
<script src="jspdf.plugin.standard_fonts_metrics.js"></script>
<script src="jspdf.plugin.split_text_to_size.js"></script>
Now, with all of that set up, we can code OutputPDF:
var OutputPDF = (function () {
    var sizeBig = 20;
    var sizeSmall = 14;
    var pdf;

    var api = {
        cellWidth: 100,
        cellHeight: 80,
        margins: {
            top: 36,
            bottom: 0,
            left: 0,
            right: 0
        },

        start: function () {
            pdf = new jsPDFX('l', 'pt', 'letter'),
            this.margins.left = this.margins.right =
              (pdf.getPageSize().width - 7 * this.cellWidth) / 2;
            pdf.setFont('Times', 'Roman'),
        },

        text: function (row, col, type, s, xOffset, yOffset) {
            var x, y;

            if (type === 'weekday') {
                xOffset = (this.cellWidth - this.getTextWidth(s, 'small')) / 2;
                yOffset = output.cellHeight * .8;
            }
            pdf.setFontSize(type === 'weekday' ? sizeSmall : sizeBig);
            if (type === 'month') {
                var titleWidth = pdf.getWidth(s);
                var pageSize = pdf.getPageSize();
                x = (pageSize.width - titleWidth) / 2;
                y = this.margins.top + yOffset;
            }
            else {
                x = this.margins.left + col * this.cellWidth + xOffset;
                y = this.margins.top + row * this.cellHeight + yOffset;
            }
            pdf.text(s, x, y);
        },

        addPage: function () {
            pdf.addPage();
        },

        pageWidth: function () {
            return pdf.getPageSize().width;
        },

        line: function (x1, y1, x2, y2) {
            pdf.setLineWidth(1);
            pdf.lines([[x2 - x1, y2 - y1]], x1 + this.margins.left,
              y1 + this.margins.top);
        },

        getTextWidth: function (s, fontSize) {
            pdf.setFontSize(fontSize === 'small' ? sizeSmall : sizeBig);
            return pdf.getWidth(s);
        },

        write: function () {
            pdf.output('save',
                {
                    callback: function (blob, entry) {
                        chrome.fileSystem.getDisplayPath(entry,
                            function callback(displayPath) {
                                document.querySelector("#calendar").
                                  insertAdjacentHTML('beforeend',
                                  '<p>Wrote PDF to ' + displayPath);
                                showPDF(blob);
                            }
                        );
                    }
                }
            );
        }
    };
    return api;

    function showPDF(blob) {
        var reader = new FileReader();
        reader.onload = function(event) {
            document.querySelector("#calendar").
              insertAdjacentHTML('beforeend',
              'Click <a target="_blank" href="' + event.target.result +
                '">here</a> to see it in a browser.'),
            document.querySelector("#calendar").
              insertAdjacentHTML('beforeend',
              '<p><webview src="' + event.target.result +
                '" style="width:100%; height:680px;"></webview>'),
        };
        reader.onerror = function(e) {
            console.log(e);
        };
        reader.readAsDataURL(blob);
    }
})();
Working with Images
As I explained in Accessing the Facebook API, you can easily show an image by using a standard HTML <img> element, as long as you’re showing a data URL containing Blob data representing the image. You can’t refer to the image’s URL directly with an http or file protocol as you would in a web page. The code to do that was incorporated into a getBlobUri method of a Photo object.
Accessing Image Thumbnails and Metadata
There are APIs for getting FileEntry objects referring to images, as we’ll see in The mediaGalleries API, but there are no other Chrome APIs for dealing with images themselves. Unlike other platforms you might have used (for example, Mac OS X), Chrome provides no way to get thumbnails or metadata (date/time, F-number, camera model, and so on), except for a few fields that you can retrieve by using the mediaGalleries API.
However, it is possible—although not easy—to read an image file to extract its thumbnail and metadata entirely in JavaScript. This is because they’re stored inside the file in data structures that you can read by using ordinary file I/O methods. The code to do it is complicated and not specific to Chrome Apps, so I won’t go into it in detail here, but you can find it included in the example code for this book. Look for the Metadata example (which we’ll discuss shortly) for the exifdata.js file.
In the following, I sketch briefly how the thumbnail and metadata code in exifdata.js works:
-
Generally, if all you want is a thumbnail and some metadata, you don’t want to read the entire image file into memory, because it might be 10 MB or more. Given a
File(a subclass ofBlob), you can use itsslicemethod to pick off just part of it, perhaps the first 64 KB, where the thumbnail and metadata are usually located. Then, you instantiate aFileReaderto read just that slice. -
In reading image files, you almost always need to pay attention to byte order: little-endian (Intel) or big-endian (Motorola). Knowing the order, you then must convert two- or four-byte quantities to signed or unsigned integers. Instead of coding this yourself, you can use a little-known API built in to Chrome (and many browsers) called
DataView. To find your way around JPEG and other image formats, you need to study the relevant standards documents. The documents that you’ll want to read are:
“Parsing Exif client-side using JavaScript”
“Description of Exif file format”
In exifdata.js, all of the above is incorporated into an ExifData object that you instantiate with a FileEntry as an argument, like this:
var exifdata = new ExifData.Exif(fileEntry);
Then, you can extract the metadata and thumbnail URL by using the getMetadata method, like this:
exifdata.getMetadata(
function (metadata, thumbURL) {
// do something with metadata and thumbURL
}
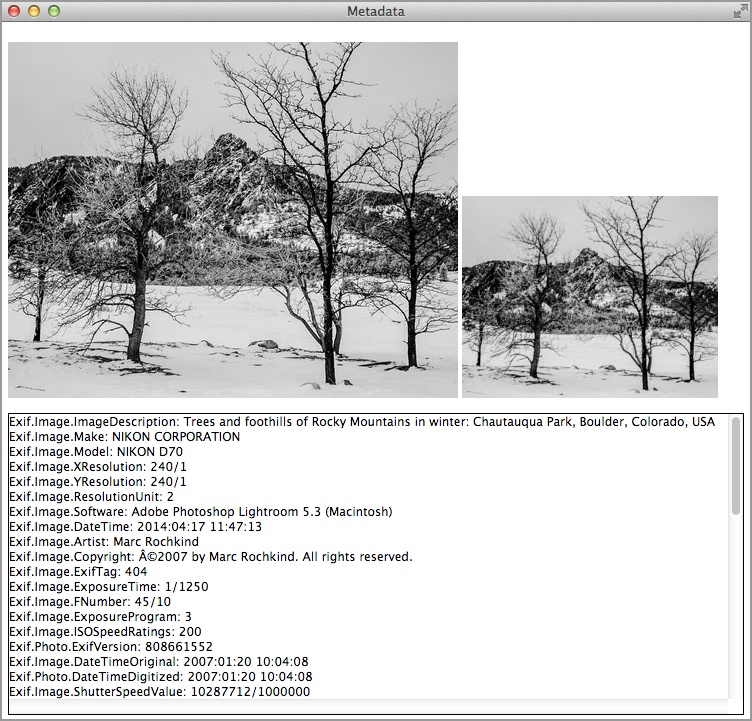
);The metadata argument is a string that you can display directly as, for example, the innerText of a <p> element, and thumbURL is a data URL suitable for direct use as the src attribute of an <img> element. To see how you use those two arguments, we’ll look at an example app that displays an image, its thumbnail, and its metadata, as demonstrated in Figure 5-18.
The background.js and manifest.json files for this example are nothing special, except that fileSystem permission is needed because the example will use chrome.fileSystem.chooseEntry to open the image file (see External Files).
The index.html file shows the image, its thumbnail, and its metadata:
<!DOCTYPE html>
<html lang="en">
<head>
    <meta charset="utf-8" />
    <title>Metadata</title>
    <link rel="import" href="lib/common.html">
    <script src="Metadata.js"></script>
</head>
<body>
    <p>
        <img id="img" width="450"></img>
        <img id="thumb"></img>
    </p>
    <p id="metadata"
      style="height: 300px; overflow: scroll; border: 1px solid black;"></p>
</body>
</html>
For this example, common.html just loads the exifdata.js file.
The interesting file is Metadata.js, which implements the app. Note that there’s really no user interface; the app just brings up the open-file dialog when it loads:
window.onload = function () {

chrome.fileSystem.chooseEntry(
    {
        type: 'openFile'
    },
    function (fileEntry) {
        if (fileEntry) {
            fileEntry.file(
                function (file) {
                    document.querySelector('#img').src =
                      URL.createObjectURL(file);
                }
            );
            (new ExifData.Exif(fileEntry)).getMetadata(
                function (metadata, thumbURL) {
                    if (thumbURL)
                        document.querySelector('#thumb').src= thumbURL;
                    if (metadata)
                        document.querySelector('#metadata').innerText= metadata;
                }
            );
        }
    }
);

};
As you know by now, Chrome Apps aren’t allowed to display the path to a file directly in the src attribute of an <img> element, so we call URL.createObjectURL to convert a File to a self-contained data URL for the image, which can be displayed. The getMetadata method also provides a data URL for the thumbnail, so you can use it directly, as well, in the following line:
document.querySelector('#thumb').src= thumbURL;We’ll see another use of the ExifData object in The mediaGalleries API.
Image Rendering Quality
There are three ways to show an image in a Chrome App window:
-
By using the
<img>element, as we’ve already seen several times. -
By using the
drawImagemethod of a canvas context. -
By using an SVG
<image>element.
Usually, you’ll use whatever works with the graphical approach you’re using, but, if you’re free to choose your API, there’s a difference you should know about: if you’re not showing the image at its actual size, the HTML <img> and SVG <image> elements do a much better job of rendering than the canvas drawImage method does.
To see this, consider the example app shown in Figure 5-19. In the figure the same 2411 x 2411 image has been reduced to 200 x 200, first by using an HTML <img> element, then by using Adobe Lightroom (a profesional-grade image-processing application), next by using the SVG <image>, and finally, by a canvas drawImage call. Looking at the lines (the ropes holding the sails), you can clearly see that the reduction done by the Canvas API is inferior to the others.
Let’s look briefly at the code for this example. The background.js and manifest.json files are nothing special (no permissions), so we’ll skip those. Here’s the index.html file:
<!DOCTYPE html>
<html lang="en">
<head>
    <meta charset="utf-8" />
    <title>ImageResize</title>
    <script src="ImageResize.js"></script>
</head>
<body>
Original 2411x2411; reduced to 200x200
<table cellspacing="0" cellpadding="5">
<tr>
<td>
    <img src="boat.jpg" width="200" height="200" id="boat">
    <br>
    Reduced in HTML
<td>
    <img src="boat-200.jpg" width="200" height="200">
    <br>
    Reduced in Lightroom
<tr>
<td>
    <svg height="200" width="200">
        <image xlink:href="boat.jpg" x="0" y="0" height="200" width="200" />
    </svg>
    <br>
    Reduced by SVG
<td>
    <canvas id="cvs" width="200" height="200" style='display:inline;'></canvas>
    <br>
    Reduced by Canvas
</table>
</body>
</html>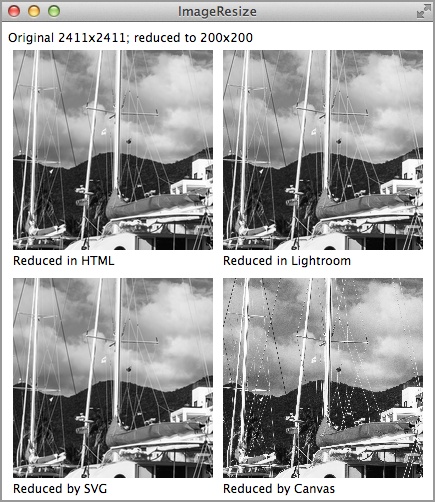
The HTML and SVG renderings use the original 2411 x 2411 boat.jpg image file, and the Lightroom example uses a 200 x 200 image exported from Lightroom, boat-200.jpg. The canvas code is in ImageResize.js:
window.onload = function () {
    var canvas = document.querySelector('#cvs'),
    var canvasContext = canvas.getContext('2d'),
    var img = document.querySelector('#boat'),
    canvasContext.drawImage(img, 0, 0, 200, 200);
};
I don’t know why Chrome’s canvas does so poorly, but I can guess: SVG is very old, even older than Chrome, so when the first version of Chrome was built, its developers quite naturally shared code between the core HTML, which certainly included the <img> element’s implementation, and their implementation of SVG. Canvas came along much later and was probably done by a different group who then stuck it into Chrome. Maybe someday the discrepancy I’ve shown will go away; all I can report is what I see now.
The mediaGalleries API
An app can call chrome.fileSystem.chooseEntry to access an individual media file (image, video, or music), or even a directory of files, but it’s convenient if the media directories on the user’s computer can be accessed automatically, without the user having to choose them. That’s what the mediaGalleries API is for. It’s only for accessing media galleries, the files in them (as FileEntry objects), and some very limited metadata. You can’t use it to do anything with the media itself, such as cropping a photo or editing an audio track.
The Principal mediaGalleries API Methods
I’ll discuss the principal mediaGalleries methods here; you can read about the others in the Chrome API documentation.
You usually begin by requesting an array of the media galleries present on the computer with chrome.mediaGalleries.getMediaFileSystems. Each gallery acts like a FileSystem; after you have a FileSystem object, you can operate on it with the API that we saw in Local Files. Here’s the call:
chrome.mediaGalleries.getMediaFileSystems(details, callback)
If the manifest requests the allAutoDetected permission, the galleries that the Chrome API knows about are automatically accessed:
"permissions": [
    {
        "mediaGalleries": [
            "allAutoDetected"
        ]
    }
]
Here’s an example call:
chrome.mediaGalleries.getMediaFileSystems(
    {interactive: 'yes'},
    function (mediaFileSystems) {
        console.log(mediaFileSystems);
    }
);
The callback argument to chrome.mediaGalleries.getMediaFileSystems is called with an array of DOMFileSystem objects, one per gallery, as you can see from the first few lines of the log, which has been formatted for readability:
[DOMFileSystem, DOMFileSystem, DOMFileSystem, DOMFileSystem,
  DOMFileSystem, DOMFileSystem]
    0: DOMFileSystem
        name: "chrome-extension_fnn...-1"
        root: DirectoryEntry
        __proto__: DOMFileSystem
    1: DOMFileSystem
        name: "chrome-extension_fnn...-2"
        root: DirectoryEntry
        __proto__: DOMFileSystem
    ...
There’s not much useful in the log, not even the names of the galleries. We’ll see how to get something more informative in a moment.
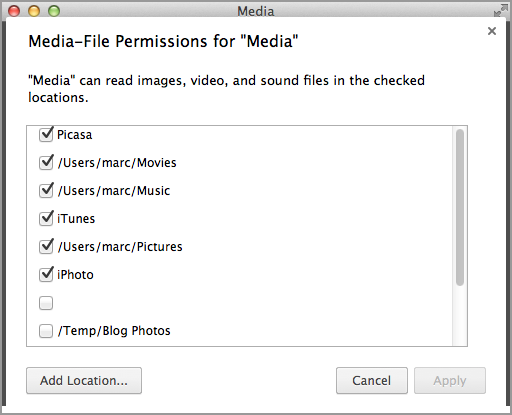
If the first argument to chrome.mediaGalleries.getMediaFileSystems has an interactive value of yes, as it does in the preceding code example, a dialog box opens in which the user can manually select a gallery as well as view the list of galleries added to, as shown in Figure 5-20. (I don’t know how the empty item got there.)
The other choices for interactive are no, which suppresses the dialog, and if_needed, which shows the dialog only if no galleries were automatically discovered.
The chrome.mediaGalleries.getMediaFileSystemMetadata method provides more information about a media gallery:
var mData = chrome.mediaGalleries.getMediaFileSystemMetadata(item)
The argument is a mediaGallery (DOMFileSystem object) as retrieved by chrome.mediaGalleries.getMediaFileSystems. Note that this method is synchronous; the metadata is its return value.
Here’s some code that displays metadata from each gallery:
chrome.mediaGalleries.getMediaFileSystems(
    {interactive: 'yes'},
    function (mediaFileSystems) {
        mediaFileSystems.forEach(
            function(item, indx, arr) {
                var mData =
                  chrome.mediaGalleries.getMediaFileSystemMetadata(item);
                console.log(mData);
            }
        );
    }
);
The log shows the following:
Object {galleryId: "1", isAvailable: true, isMediaDevice: false,
isRemovable: false, name: "iTunes"} Media.js:175
Object {galleryId: "2", isAvailable: true, isMediaDevice: false,
isRemovable: false, name: "/Users/marc/Music"} Media.js:175
Object {galleryId: "3", isAvailable: true, isMediaDevice: false,
isRemovable: false, name: "/Users/marc/Pictures"} Media.js:175
Object {galleryId: "4", isAvailable: true, isMediaDevice: false,
isRemovable: false, name: "/Users/marc/Movies"} Media.js:175
Object {galleryId: "6", isAvailable: true, isMediaDevice: false,
isRemovable: false, name: "Picasa"} Media.js:175
Object {galleryId: "8", isAvailable: true, isMediaDevice: false,
isRemovable: false, name: "iPhoto"}
Now we can see things that make sense. The galleries have names such as “iTunes,” “/Users/marc/Music,” and so on.
For each gallery, represented by a DOMFileSystem object, the root member gives its DirectoryEntry, so you can use the filesystem API calls in Chapter 2 to get at the actual directory and media files in the gallery, as we’ll see in the media browser example that’s coming up next.
A Media Browser
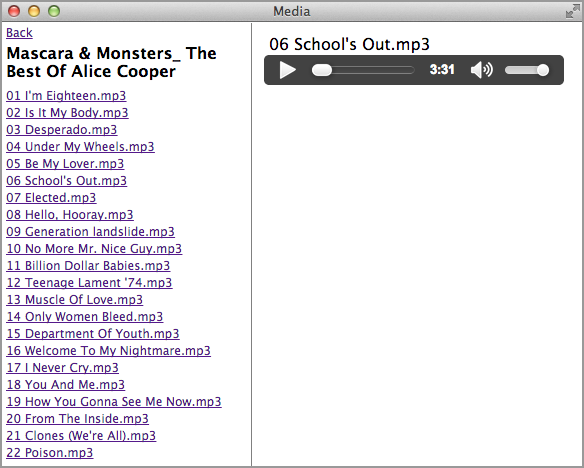
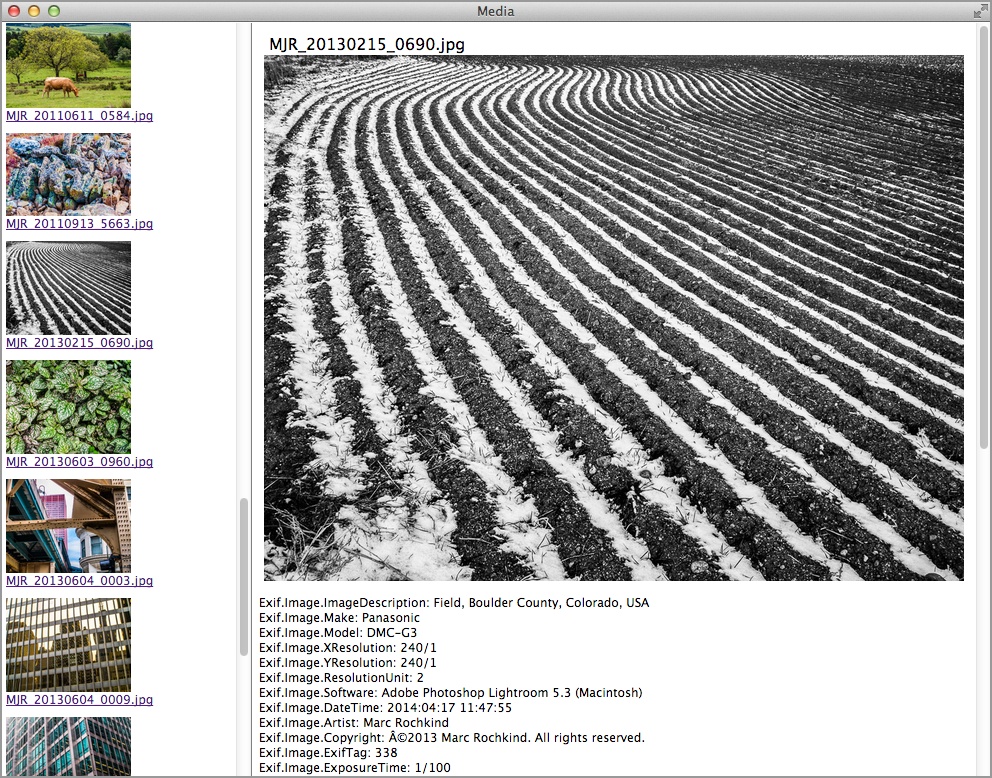
At this juncture, we can combine what we know about the mediaGalleries API, file and directory I/O, displaying images, and accessing metadata with the ExifData object to build an example app that provides navigation in a pane at the left of the window and the media itself in a pane on the right, as shown in Figure 5-21. Figures 5-22, 5-23, and 5-24 show an audio track, a video, and an image, respectively. For images only, the ExifData object from Accessing Image Thumbnails and Metadata is used to display thumbnails in the navigation (left) pane and metadata under the photo in the right pane.
As usual for most of our examples, the background.js file is nothing special. The manifest.json file requests permission to access all of the media galleries and to read what’s there. It also requests fileSystem permission, which is needed by ExifData:
{
    "app": {
        "background": {
            "scripts": [ "background.js" ]
        }
    },
    "manifest_version": 2,
    "name": "Media",
    "version": "1.0.0",
    "permissions": [
        {
            "mediaGalleries": [
                "read",
                "allAutoDetected"
            ]
        },
        "fileSystem"
    ]
}
The index.html file is somewhat lengthy, but all it really does is set up the two panes as cells in a table. The navigation pane on the left has an id of tdtoc, and the content pane on the right is assigned an id of
content. That pane has two divisions: view for the media, and, for images, metadata for the metadata:
<!DOCTYPE html>
<html lang="en">
<head>
    <meta charset="utf-8" />
    <title>Media</title>
    <link rel="import" href="lib/common.html">
    <script src="Media.js"></script>
    <style>
        body, html {
            width: 100%;
            height: 100%;
            margin: 0;
            font-size: 12px;
        }
        table {
            border-collapse: collapse;
            height: 100%;
            width: 100%;
            margin: 0 auto;
            position: absolute;
        }
        p {
            margin-bottom: 2px;
            margin-top: 2px;
            margin-left: 5px;
        }
        td, tr {
            height: 100%;
        }
        #toc {
            width: 250px;
            height: 100%;
            overflow: auto;
            border-right: 1px solid gray;
            /*margin-left: 5px;*/
        }
        #tdtoc {
            width: 250px;
            height: 100%;
        }
        #content {
            height: 100%;
            overflow: auto;
        }
        #view {
            padding: 10px;
            font-size: 16px;
        }
        #heading {
            margin-bottom: 8px;
            margin-top: 4px;
            font-size: 16px;
            font-weight: bold;
        }
        .thumbnail {
            vertical-align: middle;
            margin-right: 5px;
            display: block;
        }
        .de {
            font-weight: bold;
            font-size: 14px;
        }
    </style>
</head>
<body>
    <link rel="import" href="stuff.html">
    <table><tr>
        <td id="tdtoc"><div id="toc"></div></td>
        <td><div id="content"><div id="view"></div><p id="metadata"></p></div></td>
    </tr></table>
</body>
</html>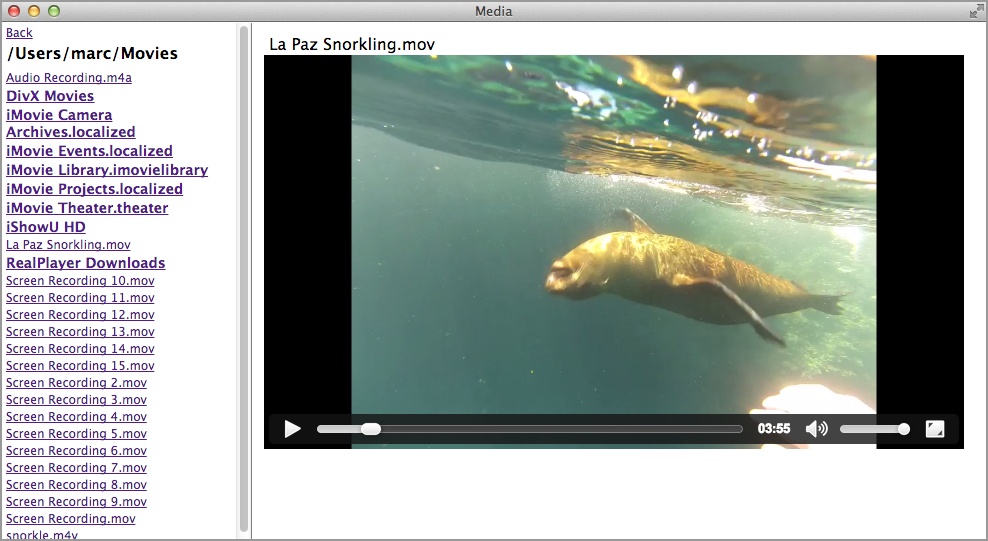
Note that some of the CSS, such as that for #heading, is for elements that aren’t present in the HTML but will be added dynamically from the JavaScript.
Now onto Media.js. The only tricky part is the implementation of the Back link at the top of the navigation pane (see Figure 5-22). To implement it, there is a global (global to the onload handler, that is) variable to hold a stack:
var stack = [];
Each time a directory is visited, the code calls the doDirectoryEntry function (which we’ll see in its entirety soon), and an object containing that DirectoryEntry and its name is pushed onto the stack:
function doDirectoryEntry(de, name) {
    stack.push({ item: de, name: name });
    // rest of function
}
Then, when the Back link is clicked, the DirectoryEntry for the directory being shown in the navigation pane is discarded from the top of the stack, and the one just under it, which represents the last one visited, is popped and then shown in the navigation pane:
stack.pop();
var x = stack.pop();
doDirectoryEntry(x.item, x.name);
We’ll see the stack-manipulation code in context as we review the entire implementation.
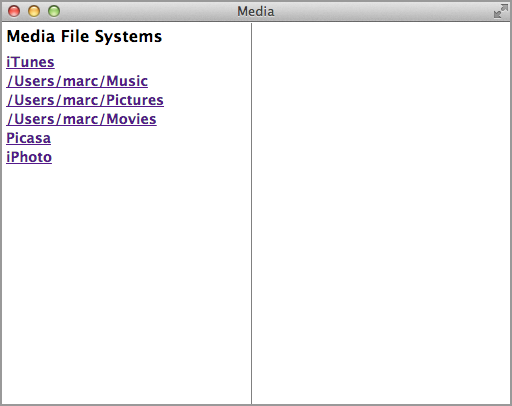
Here’s how the app begins, by showing the media galleries in the navigation page (refer to Figure 5-21):
window.onload = function () {

var entriesHolder;
var stack;

getMediaFileSystems();

function getMediaFileSystems() {
    stack = [];
    document.querySelector('#toc').innerHTML =
      '<p id="heading">Media File Systems</p>';
    chrome.mediaGalleries.getMediaFileSystems(
        {interactive: 'yes'},
        function (mediaFileSystems) {
            var id = 0;
            entriesHolder = [];
            mediaFileSystems.forEach(
                function(item, indx, arr) {
                    var mData =
                      chrome.mediaGalleries.getMediaFileSystemMetadata(item);
                    document.querySelector('#toc').insertAdjacentHTML(
                      'beforeend',
                      '<p><a href="" class="de" id=' + id++ + '>' +
                        mData.name + '</a>'),
                    entriesHolder.push(item.root);
                }
            );
        }
    );
}

// ... rest of app ...
};
Here’s a bit of narration to help you follow this code:
-
As we’ve done before, the entire application is in the
onloadhandler. -
The
DirectoryEntryfor each gallery (item.root, in the loop) is saved in theentriesHolderarray, so we can find it later when the user clicks the corresponding link. -
The index into
entriesHolder, represented by theidvariable, is set as theidof the<a>element for that item in the navigation pane. -
The
<a>elements have aclassofde, which will be important in detecting clicks, as we’re about to see.
When the user clicks anything in the navigation pane, the app must determine what was clicked and then take the appropriate action. The click might have been on the Back link, a directory, or a media file. That’s all done by the onclick event handler for the navigation pane:
document.querySelector('#toc').onclick = function (e) {
    if (e.target && e.target.nodeName == 'A') {
        if (e.target.id === 'back') {
            if (stack.length > 1) {
                stack.pop();
                var x = stack.pop();
                doDirectoryEntry(x.item, x.name);
            }
            else
                getMediaFileSystems();
        }
        else if (e.target.className === "de") {
            doDirectoryEntry(entriesHolder[parseInt(e.target.id)],
              e.target.innerText);
        }
        else if (e.target.className === "media") {
            showMedia(entriesHolder[parseInt(e.target.id)]);
        }
    }
    return false;
}
Because the click could be anywhere at all in the toc division, we need to access e.target to see if we’re on an <a> element and, if we are, what kind of element it is:
-
If its
idisback, it’s theBacklink. -
If its
classisde, it’s a directory. -
If its
classismedia, it’s a media file. - Otherwise, the click is ignored.
For directories, the id gives the index into entriesHolder, so the saved DirectoryEntry can be accessed, and the doDirectoryEntry function is called with that and the name that appeared as arguments. For media files, showMedia is called, although here the object in entriesHolder is a FileEntry.
Here’s doDirectoryEntry:
function doDirectoryEntry(de, name) {
    stack.push({ item: de, name: name });
    if (!name)
        name = de.name;
    document.querySelector('#toc').innerHTML = '';
    document.querySelector('#toc').insertAdjacentHTML(
      'beforeend',
      '<p><a href="" id="back">Back</a>'),
    document.querySelector('#toc').insertAdjacentHTML(
      'beforeend',
      '<p id="heading">' + name + '</p>'),
    var id = 0;
    entriesHolder = [];
    var dr = de.createReader();
    dr.readEntries(
        function (entries) {
            entries.forEach(
                function(item, indx, arr) {
                    if (item.isDirectory) {
                        document.querySelector('#toc').insertAdjacentHTML(
                          'beforeend',
                          '<p><a href="" class="de" id=' + id++ + '>' +
                            item.name + '</a>'),
                        entriesHolder.push(item);
                    }
                    else {
                        var toc = document.querySelector('#toc'),
                        var p = document.createElement('p'),
                        toc.appendChild(p);
                        // img as object so closure below will grab it
                        var img = document.createElement('img'),
                        img.className = 'thumbnail';
                        p.appendChild(img);
                        var a = document.createElement('a'),
                        a.className = 'media';
                        a.id = id++;
                        a.href = '';
                        a.innerText = item.name;
                        p.appendChild(a);
                        entriesHolder.push(item);
                        (new ExifData.Exif(item)).getMetadata(
                            function (metadata, thumbURL) {
                                if (thumbURL) {
                                    img.width = '125';
                                    img.src= thumbURL;
                                    p.style['margin-top'] = '10px';
                                    p.style['margin-bottom'] = '10px';
                                }
                                item.metadata = metadata;
                            }
                        );
                    }
                }
            );
        },
        function (e) {
            console.log(e);
        }
    );
}
This function basically adds appropriate HTML to the navigation pane. Each item in the directory is either another directory, for which an <a> element with a class of de is added, or a media file. The only strange part is that an img object is created and appended for every media file, even if it’s not an image. Then, an ExifData object is used to read its metadata, which produces a thumbURL only for images. The way the code is organized, if it’s not an image, the img won’t get a src attribute. (If you’re bothered by sourceless img tags, you can rework the code to avoid them. I’m not bothered by them.)
It was this example that motivated me to write code in ExifData to extract thumbnails. The first version used the actual, full-size image to display the thumbnails, but that was ridiculously slow, because some of my JPEGs are several megabytes in size, and some of my image directories have hundreds of images. Taking 10 minutes to display the contents of a directory in the navigation pane is obviously unacceptable. By extracting the thumbnails, the process takes only a few seconds, even for large directories. And, as you can see from the code, this is an asynchronous operation, so the user is free to click a link without having to wait for all the thumbnails to display.
All we have left is showMedia:
function showMedia(item) {
    var viewDiv = document.querySelector('#view'),
    var metadataDiv = document.querySelector('#metadata'),
    viewDiv.innerHTML = '';
    metadataDiv.innerHTML = '';
    viewDiv.insertAdjacentHTML('beforeend', '<p>' + item.name + '</p>'),
    item.file(
        function (file) {
            chrome.mediaGalleries.getMetadata(file, {},
                function (metadata) {
                    if (metadata && metadata.mimeType) {
                        var element;
                        var mediaType = metadata.mimeType.split('/')[0];
                        var elementName = mediaType === 'image' ? 'img' :
                          mediaType;
                        element = document.createElement(elementName);
                        element.setAttribute("controls", "controls");
                        viewDiv.appendChild(element);
                        element.style['max-width'] = '700px';
                        element.style['max-height'] = '700px';
                        element.src = URL.createObjectURL(file);
                    }
                }
            );
        },
        error
    );
    if (item.metadata)
        metadataDiv.innerText = item.metadata;
}
This function shows the media and its metadata, if any (only images have any). To show the media, an element is added to the right pane. The type of element is determined by these two magical lines of code:
var mediaType = metadata.mimeType.split('/')[0];
var elementName = mediaType === 'image' ? 'img' : mediaType;
The mediaType is given as the first part of the mimeType (audio/mpeg, video/mp4, image/jpeg, and so on). For images, we want an <img> element. Otherwise, we want a <video> or <audio> element, for which we use the mediaType directly.
For <video> and <audio> elements, we want controls, which we get with this line:
element.setAttribute("controls", "controls");Images don’t have controls, but setting that attribute does no harm, so we keep the code simple by setting it anyway.
What? That’s all? Indeed it is. From the functionality of this useful little app, you might have expected a lot more code, but there isn’t any more. Lots of little tricks—like using the id to hold the index into entriesHolder, going for metadata thumbnails even when there aren’t any, and using the mimeType to generate the correct media-showing element—have all kept things very simple.