
Chapter 11. Programming with Virtual Earth
Virtual Earth (http://virtualearth.msn.com) is the latest web product from the Microsoft MapPoint team. Even though there are currently no official APIs available, the openness of Virtual Earth allows some friendly “hackability.” Virtual Earth is implemented using a mix of both server-side and client-side technologies, including ASP.NET and AJAX (Asynchronous JavaScript and XML) .
In this section, I want to show you some of the interesting hacks that you can build around Virtual Earth.
Let’s get started!
Warning
This section is based on beta product and undocumented APIs; the APIs and the architecture may change significantly in future versions of Virtual Earth.
Anatomy of Virtual Earth
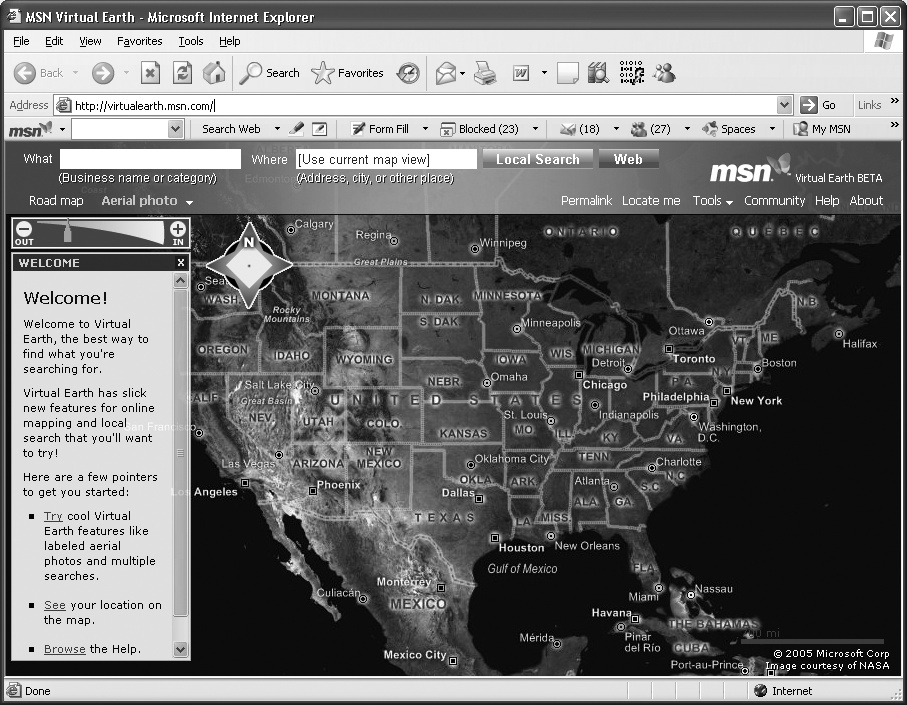
When you visit the Virtual Earth site at http://www.virtualearth.msn.com, you will see a site that looks similar to Figure 11-1. You will also notice a couple of interesting facts:
Map interaction is enabled using the mouse and keyboard.
Map interaction does not require a page-refresh.
Search, pan, and zoom are preformed asynchronously for a better user experience.
All this is made possible by using JavaScript on the client browser to communicate with the Virtual Earth servers asynchronously. One of the neat things about JavaScript is that you can look at the implementation, since the code exists on the client side. If you look at the source of the Virtual Earth site, you will notice the following JavaScript files:
- MapControl.js
Defines the Map Control object and all related properties and methods.
- VE.js
Contains the code to display the map, zoom, and pan controls. This is the core script that runs the Virtual Earth site.
- Configurations.js
Contains the configuration values, such as the search service, locate service, and the map image server endpoints.
If you want to use Virtual Earth map on your site, the JavaScript you need is the MapControl.js, which can be obtained from the Virtual Earth site at: http://virtualearth.msn.com/js/MapControl.js. Even though the Map Control is completely written in JavaScript, you can create an instance just like any other object using its constructor:
var map = new VE_MapControl(32.69, -117.13, 12, 'r', "absolute", 400, 10, 400, 300);
Don’t worry about the details of the parameters yet; we will
take a detailed look at these in the next section. The VE_MapControl class takes nine parameters to
create a map control instance that you can use to call the methods and
subscribe to its events.
Tables 11-1 and 11-2 provide a list of the important methods and events exposed by the Map Control.
Event Name | Description | Example |
onMouseClick | Fires an event when the mouse is clicked on the map. The event argument exposes the latitude and longitude where the mouse click occurred. | //Wire-up the event
map.onMouseClick=function(e)
{
alert(e.latitude+',
'+e.longitude);
};
// Disable the event
map.onMouseClick=null; |
onMapChange | Fires an event when the map has changed (such as when it has been zoomed, dragged, or panned). | //Wire-up the event
map.onMapChange=function(e){
alert('map changed'),
}
//Disable the event
map.onMapChange=null; |
Using this JavaScript control, you can build applications to show anything that you can layer on top of maps—a bunch of photographs that you want to show by location (where they were taken), or a group of friends blogging from different cities who you want to show on a map. The information integration scenarios that we discussed in MapPoint 2004 and MapPoint Web Service can be also be done with Virtual Earth. The integration of information on maps as a layer is also known as Mash-up .
Programming with MapControl.js
In this section, we’ll be displaying the map and changing map styles, as well as trying out Pan, Zoom, Mouse Clicks and more. Finally, we’ll add Pushpins, layering RSS/XML feeds. All of this can be accomplished using only HTML and JavaScript.
Map Control Basics
Displaying a map using Map Control is very easy in Virtual Earth. All you need is a plain HTML page with some script tags. To start, let’s create a new blank HTML page and add the mapcontrol.js as a reference from http://virtualearth.msn.com:
    <!DOCTYPE HTML PUBLIC "-//W3C//DTD HTML 4.0 Transitional//EN">
    <html>
        <head>
            <title>Virtual Earth Hacks</title>
               <script src="http://virtualearth.msn.com/js/mapcontrol.js"></script>
        </head>

        <body>
        </body>
    </html>
Next, to create an instance of the map control with proper parameters, use the following constructor:
    var map = VE_MapControl(CenterLatitude,
                           CenterLongitude,
                           DefaultZoom,
                           MapStyle,
                           ControlLayout,
                           PositionLeft,
                           PsotionTop,
                           MapWidth,
                           MapHeight);
Each of these parameters has a job to perform:
CenterLatitudeThe initial center point latitude for the map.
CenterLongitudeThe initial center point longitude for the map.
DefaultZoomThe initial zoom value with which the map control is loaded. Valid values are from 1-19 (1 is zoomed out all the way, and 19 is zoomed down to the street level).
MapStyleThe style to use when displaying the map. There are currently 3 style options: aerial, road, and hybrid. In order to indicate a style you need to pass the following values as a parameter to the constructor:
aDisplays an aerial satellite image of the map display.
rDisplays a road map-style map.
hDisplays a combination of aerial photos with street labels.
ControlLayoutThe way in which the control should be positioned on the page. The two options are relative and absolute. Use relative if you are using the map in a table or a
divthat you want it to wrap if someone resizes the html page. Use absolute if you don’t want your map to reposition itself on the page.PostionLeftThe position to the left of the control on the page. Use it only if you want an absolute layout. If you want a relative layout, pass an empty string (
'').PostionTopThe position on the top of the control on the page. Use it only if you want an absolute layout. If you want a relative layout, pass an empty string (
'').MapWidthThe width of the control in pixels.
MapHeightThe height of the control in pixels.
The following JavaScript statement shows how to create a new instance of the map control with a specific set of initial values:
          var map = null;
          map = new VE_MapControl(44, //Latitude
                                   -99, //Longitude
                                    3, //Zoom Level
                                   'r',  //Road MapStyle
                                    "absolute", //Layout
                                    10, //Left
                                    10, //Top
                                    700, //Width
                                    500); //Height
To display a map, you need to render this control by adding to the body of the HTML page. This can be done in two ways. Either add to the body using a script:
document.body.appendChild(map.element);
or add the map to a div
element inside another element (for example, a table cell named
mapholder) on the page:
document.getElementById("mapholder").appendChild(map.element);That’s it; when this script is placed in the body:
    <!DOCTYPE HTML PUBLIC "-//W3C//DTD HTML 4.0 Transitional//EN">
    <html>
        <head>
            <title>Virtual Earth Hacks</title>
            <script src="http://virtualearth.msn.com/js/mapcontrol.js"></script>
        </head>
        <body>
               <script type="text/JavaScript">
                var map = null;
                map = new VE_MapControl(44, -99, 3, 'r', "absolute", 10, 10, 700, 500);
                document.body.appendChild(map.element);
            </script>
        </body>
    </html>
A nice-looking map will be rendered on the page as shown in Figure 11-2.
Tip
If you are running Windows XP SP2 or Internet Explorer 7.0, you may get security warnings before running the page. You have to manually allow the script to run on your computer to show the map.
Alternatively, you can also display the map in a table cell:
    <!DOCTYPE HTML PUBLIC "-//W3C//DTD HTML 4.0 Transitional//EN">
    <html>
        <head>
            <title>Virtual Earth Hacks</title>
            <script src="http://virtualearth.msn.com/js/mapcontrol.js"></script>
        </head>
        <body>
            <table border=1px>
                <tr>
                    <td colspan=2 align=center>
                        <b>Map shown in a table</b>
                    </td>
                </tr>
                <tr>
                    <td width=40%>
                        This is my content part
                    </td>
                    <td width=50%>
                        This is the map part
                        <div id=mapholder></div>
                    </td>
                </tr>
            </table>
            <script type="text/JavaScript">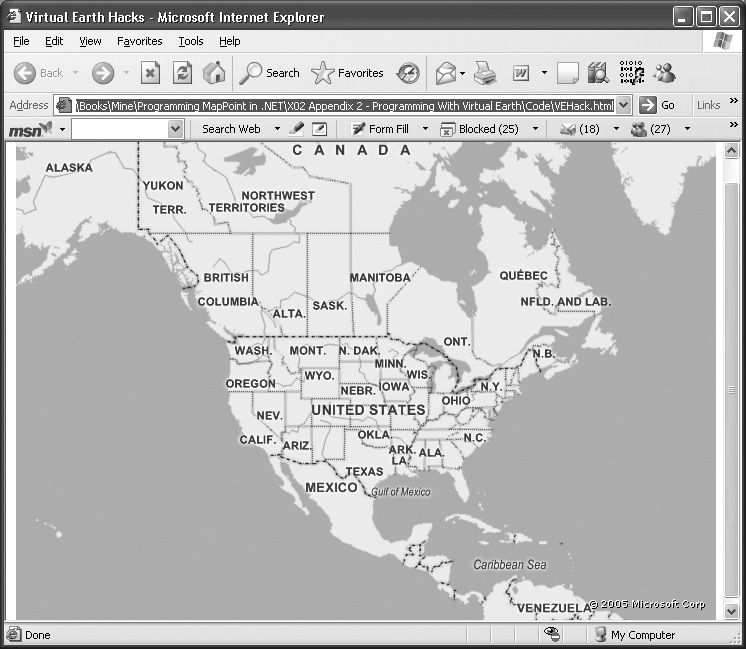
                var map = null;
                map = new VE_MapControl(44, -99, 3, 'r', "relative", '', '', 500, 300);
                document.getElementById("mapholder").appendChild(map.element);
            </script>
        </body>
    </html>
The resulting map is shown in Figure 11-3.
Tip
If you see the Internet Explorer Image Tool Bar menu on the map when the mouse hovers over the map, you can disable it by adding the following meta tag to the header of your HTML page:
<META HTTP-EQUIV="imagetoolbar" CONTENT="no">
Finally, you can also move the map initialization code into a
function that can be called by the HTML body element’s onLoad event:
    <!DOCTYPE HTML PUBLIC "-//W3C//DTD HTML 4.0 Transitional//EN">
    <html>
        <head>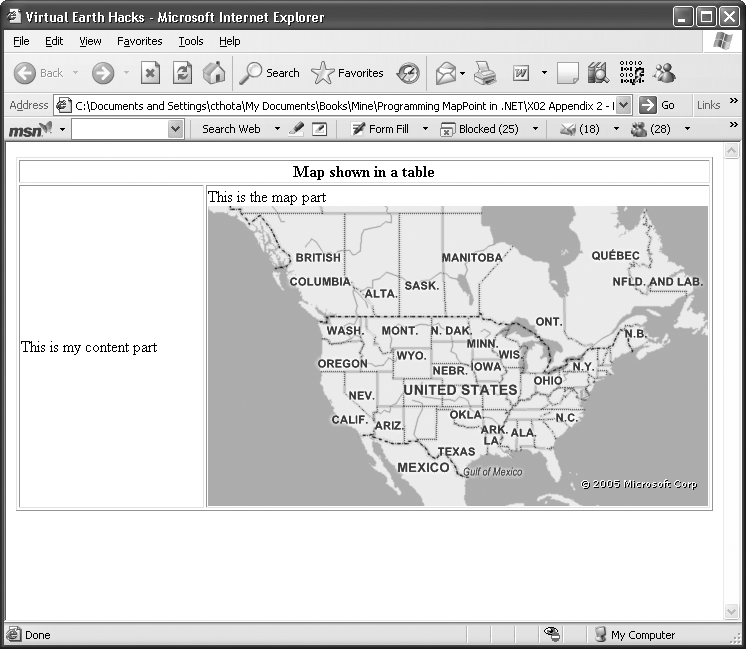
            <title>Virtual Earth Hacks</title>
            <script src="http://virtualearth.msn.com/js/mapcontrol.js"></script>
            <script type="text/JavaScript">
                var map = null;
                   function LoadMap( )
                {
                    map = new VE_MapControl(44, -99, 3, 'r', "relative",
                                            '', '', 500, 300);
                    document.getElementById("mapholder").appendChild(map.element);
                }
            </script>
        </head>
        <body onload="LoadMap( );">
            <table border=1px ID="Table1">
                <tr>
                    <td colspan=2 align=center>
                        <b>Map shown in a table</b>
                    </td>
                </tr>
                <tr>
                    <td width=40%>
                        This is my content part
                    </td>
                    <td width=50%>
                        This is the map part
                        <div id=mapholder></div>
                    </td>
                </tr>
            </table>
        </body>
    </html>
Tip
The default map generated by these scripts has pan and zoom functionalities tied to your mouse clicks and keyboard strokes.
Now that you have the map, let’s see how you can change the map style.
Changing the map style
Once you create a map control, you can change the
map style simply by calling the SetMapStyle method:
    //Show Hybrid mapstyle
    map.SetMapStyle('h'),
You can send r to see the
road style maps and a to see
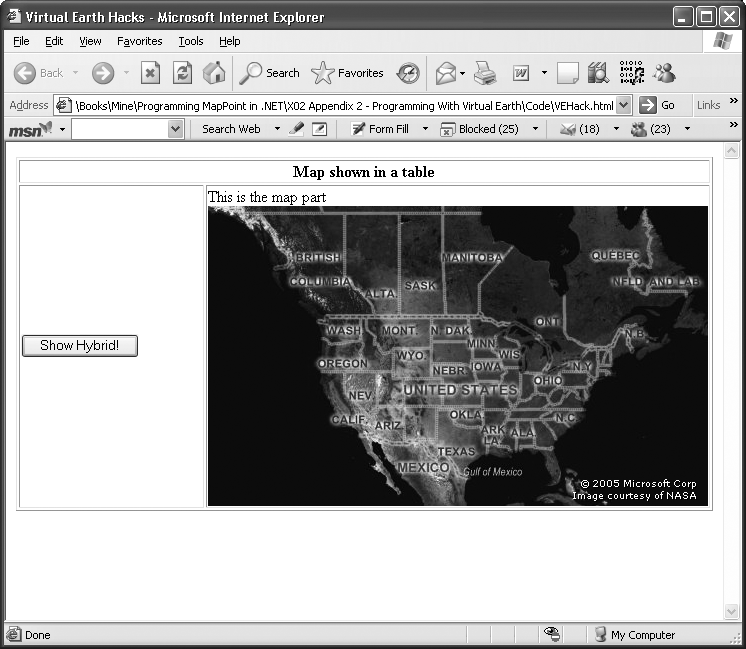
aerial maps with no labels. By adding a button to the previous
HTML page and using the SetMapStyle method, you can change the
map style to hybrid from road:
<!DOCTYPE HTML PUBLIC "-//W3C//DTD HTML 4.0 Transitional//EN">
<html>
<head>
<title>Virtual Earth Hacks</title>
<script src="http://virtualearth.msn.com/js/mapcontrol.js"></script>
<script type="text/JavaScript">
var map = null;
function LoadMap( )
{
map = new VE_MapControl(44, -99, 3, 'r',
"relative", '', '',
500, 300);
document.getElementById("mapholder").appendChild(map.element);
}
</script>
</head>
<body onload="LoadMap( );">
<table border=1px ID="Table1">
<tr>
<td colspan=2 align=center>
<b>Map shown in a table</b>
</td>
</tr>
<tr>
<td width=40%>
<input type=button onclick="map.SetMapStyle('h'),"
value="Show Hybrid!" ID="Button1" NAME="Button1"></input>
</td>
<td width=50%>
This is the map part
<div id=mapholder></div>
</td>
</tr>
</table>
</body>
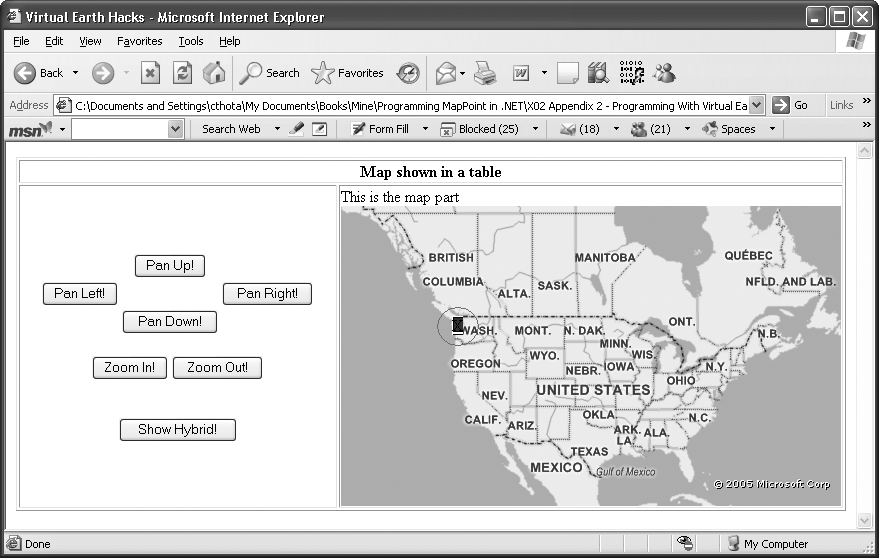
</html>The resulting page and map displayed when the button is clicked is shown in Figure 11-4.
Now that you know how to change the map style, let’s look at how to trap the map events.
Trapping the Virtual Earth Map Control events
Map Control exposes a set of events, including
onMouseClick and onMapChange. To wire up one of those
events, create a function that gets executed with the event
arguments:
map.onMouseClick=function(e){DisplayLatLong(e.latitude, e.longitude);};where the DisplayLatLong
function is defined as:
    function DisplayLatLong(latitude, longitude)
    {
        alert("You clicked on: " + latitude + ", " + longitude);
    }
The event argument e
contains the location contextual information, such as the latitude
and longitude of the event, so that you can use that information
to perform custom actions. The document HTML reads as
follows:
<!DOCTYPE HTML PUBLIC "-//W3C//DTD HTML 4.0 Transitional//EN">
<html>
<head>
<title>Virtual Earth Hacks</title>
<script src="http://virtualearth.msn.com/js/mapcontrol.js"></script>
<script type="text/JavaScript">
var map = null;
function LoadMap( )
{
map = new VE_MapControl(44, -99, 3, 'r',
"relative", '', '', 500, 300);
document.getElementById("mapholder").appendChild(map.element);
map.onMouseClick=function(e){
DisplayLatLong(e.latitude, e.longitude);};
}
function DisplayLatLong(latitude, longitude)
{
alert("You clicked on: " + latitude + ", " + longitude);
}
</script>
</head>
<body onload="LoadMap( );">
<table border=1px ID="Table1">
<tr>
<td colspan=2 align=center>
<b>Map shown in a table</b>
</td>
</tr>
<tr>
<td width=40%>
<input type=button onclick="map.SetMapStyle('h')," value="Show
Hybrid!" ID="Button1" NAME="Button1"></input>
</td>
<td width=50%>
This is the map part
<div id=mapholder></div>
</td>
</tr>
</table>
</body>
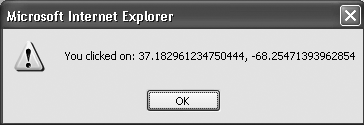
</html>When you click on the map, a message is displayed as shown in Figure 11-5; the numbers depend on the latitude and longitude coordinates that you have clicked on.
Along the same lines, you can also wire up events like
onMapChange, onMouseUp, and onMouseDown.
Map Interaction Using Map Control
Now that you know how to display a basic map, change
map styles, and trap map events, you can build some map interaction
around the map. The basic interactions that you would want to see on
a map are panning and zooming. Map Control exposes the PanMap, ZoomIn, and ZoomOut methods to control panning and
zooming.
Panning the map
You can use the PanMap
method to pan around the map. This method takes pixel position
difference as arguments for both x and y coordinates. For example,
if you want to pan the map to your left by 100 pixels, call the
PanMap method:
    //Pan left
    map.PanMap(-100,  0);
Along the same lines, calling this method with 100 and 0 parameters pans the map to the right by 100 pixels:
    //Pan right
    map.PanMap(100,  0);
Similarly, you can pan the map up and down by passing the y coordinates while keeping the x coordinate assigned to 0:
    //Pan Up
    map.PanMap(0,  -100);
    //Pan Down
    map.PanMap(0,  100);
You can also pan the map to corners such as southeast and northwest by passing both x and y coordinates:
    //Pan South East
    //(or Bottom-Right)
map.PanMap(100,  100);
Finally, to pan the map to specific latitude and longitude
coordinates, call the PanToLatLong method:
    map.PanToLatLong(
        47.6045,  // latitude
        -122.3305); // longitude
Zooming the map
To perform any zoom operations, you can use the
ZoomIn and ZoomOut methods. These methods don’t
take any parameters, and they increment or decrement the zoom
level by one depending on whether you are zooming in or zooming out.
To zoom in to one level below the current level, simply call
the ZoomIn method:
    //Zoom In
    map.ZoomIn( );
Similarly, to zoom out to one level above the current level,
simply call the ZoomOut
method:
    //Zoom Out
    map.ZoomOut( );
Finally, to set a specific zoom level, call the SetZoom method:
map.SetZoom(7); // zoom level
Displaying Your Data on Maps
One of the values of using maps is that you can use them to
visualize the data geographically; you can display a variety of
items, such as news, photos, blogs, etc. on a map once the location
is known. Since all these items are basically point information, you
can easily display them with Virtual Earth MapControl using the
AddPushpin method.
Adding a pushpin
The AddPushpin
method adds an icon on the map at the specified latitude and
longitude coordinate. A simple use of the AddPushpin method is shown in the
following example:
    map.AddPushpin(
        'myPushpin', // pin id
        47.6,        // latitude
        -122.33,     // longitude
        24,          // width
        24,          // height
        'bluepin',   // CSS class
        'X',         // pincontent
        25);         // z index
This method takes the latitude and longitude among the other
elements to add a pushpin at the specified location; one of the
most interesting parameters of all the above is the pincontent parameter. This parameter
contains the content that will be displayed as the pushpin. When
this code is executed, a pin is added to the map as shown in Figure 11-6.
Since each pushpin is a div element in Virtual Earth, and since
each div can have rich inner
HTML, you can pass any valid HTML code as part of this pin content
parameter; in the following example, see how an image thumbnail
can be passed as the pushpin content:
map.AddPushpin('myPushpin', // pin id
47.6, // latitude
-122.33, // longitude
24, // width
24, // height
'', // CSS class
"<img src='http://cache.corbis.com/CorbisImage/thumb/14/19/74/14197458
/IH212078.jpg'>",
// pincontent
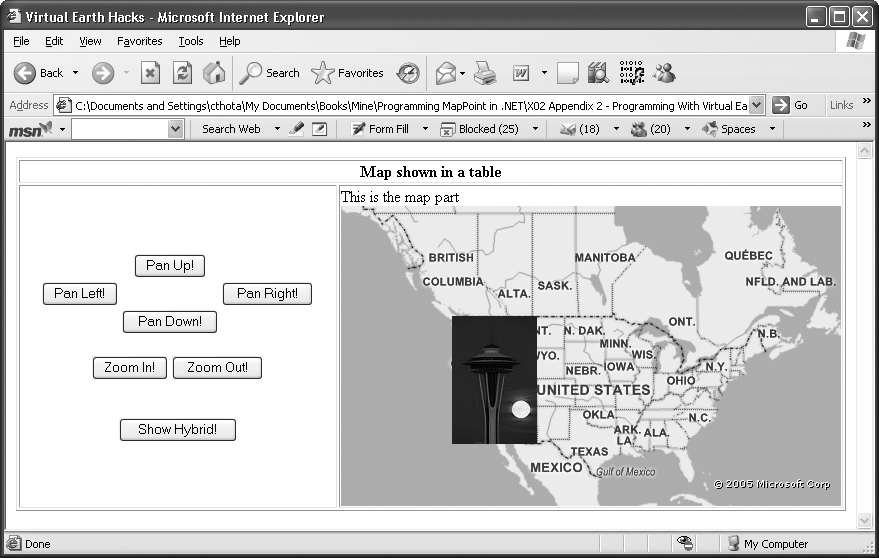
25); // z indexThis code adds a pushpin with the Space Needle thumbnail picture over Seattle, as shown in Figure 11-7.
As you can imagine, you can easily extend this inner HTML code to show pop-ups when a user’s mouse is hovered over the icon.
Removing pushpins
Once you add a pushpin, you can remove it with its
ID using the RemovePushpin
method:
map.RemovePushpin('myPushpinSimilarly, you can remove all pushpins on the map using the
ClearPushpins method:
map.ClearPushpins( );
As you can see, adding and removing a pushpin is easy in Virtual Earth; next, we’ll add several pushpins from a data source, such as an XML file.
Adding pushpins from RSS feed
Let’s say you have a bunch of points specified as an RSS feed (an XML file):
    <?xml version="1.0"?>
    <rss version="2.0" xmlns:geo="http://www.w3.org/2003/01/geo/wgs84_pos#">
    <channel>
        <title>Chandu's Fav Places</title>
        <link>http://www.csthota.com</link>
        <description>Chandu's Fav Places</description>
       <item>
            <title>Coffee Shop</title>
            <description>Starbucks Coffee. Umm, Caramel Machiato!</description>
            <geo:lat>37.757329</geo:lat>
            <geo:long>-122.399081</geo:long>
       </item>
       <item>
            <title>Video Store</title>
            <description>Hollywood Video - Love it!</description>
            <geo:lat>37.758051</geo:lat>
            <geo:long>-122.400984</geo:long>
       </item>
       <item>
            <title>Home</title>
            <description>Home, Sweet Home!</description>
            <geo:lat>37.758035</geo:lat>
            <geo:long>-122.397129</geo:long>
       </item>
       <item>
            <title>Sages Italiano</title>
            <description>Italian food in my hood!</description>
            <geo:lat>37.755929</geo:lat>
            <geo:long>-122.397881</geo:long>
       </item>
    </channel>
    </rss>
This XML file can be loaded and displayed on the Virtual Earth map using the following JavaScript function:
function LoadXml(xmlfile)
{
if(!documentSource)
return;
var doc = null;
doc=new ActiveXObject("msxml2.DOMDocument.3.0");
doc.async=false;
doc.resolveExternals=false;
doc.validateOnParse=false;
// Load the XML file into the DOM instance.
doc.load(xmlfile);
if(!doc)
{
return;
}
//Loop now
var nodeList = doc.selectNodes("//./item");
for(i=0;i<nodeList.length;i++)
{
if(nodeList.item(i))
{
var item = nodeList.item(i);
var title=item.selectSingleNode("title").text;
var description=item.selectSingleNode("description").text;
var latitude=item.selectSingleNode("geo:lat").text;
var longitude=item.selectSingleNode("geo:long").text;
//Add pushpin
map.AddPushpin(i, latitude, longitude, 24, 24, 'mypin', title, 25);
}
}
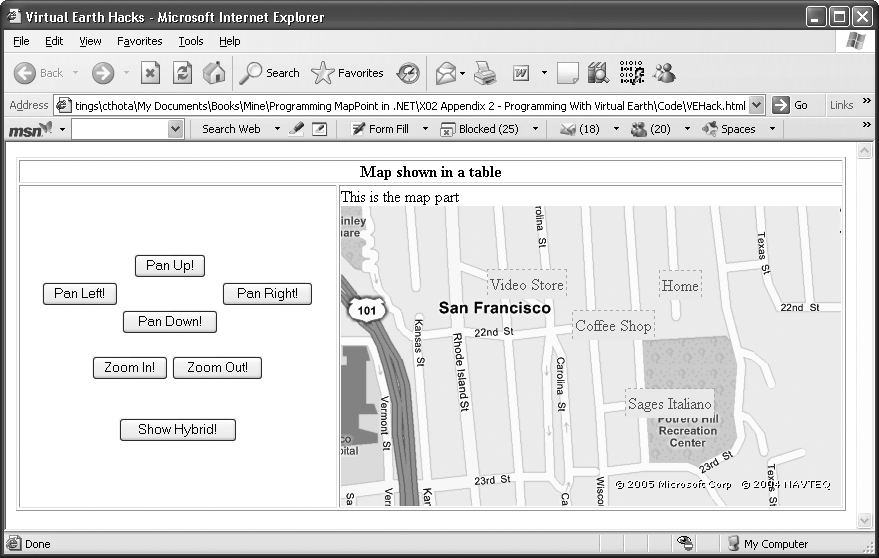
}When this function is called in the HTML page, the pushpins are added on the map as shown in Figure 11-8.
Adding pushpins on the map can be done directly on the
client side (browser) using JavaScript from an XML feed. You can
also extend this code to center the map on the pushpins that are
being added using the map.SetViewPort method.
Where Are We?
There are currently no official APIs provided by Virtual Earth, and the APIs discussed here are the undocumented APIs that can be used for noncommercial purposes only. If you are an enterprise in need of a mapping application, consider either MapPoint 2006 or MapPoint Web Service. Having said that, the MapPoint team is working hard to enable Virtual Earth experience in the MapPoint Web Service, and it is expected to be available early next year to the developer community.
So, there you have it: we have arrived at the tail end of programming an array of products and technologies with MapPoint using C# and .NET, ranging from MapPoint 2006 to MapPoint Web Service to Location Server to Virtual Earth, and including a wide variety of technologies to suit different needs and requirements. I would like to leave you with one final note: the world of web services is a fast-changing one—so, I will keep you posted with any new features or existing feature updates via articles and blog posts. If you have any questions in the meantime, please don’t hesitate to contact me at [email protected].