
When you build a C# application, you will have two options, debug mode and release mode. Debug mode helps you to step through each and every line of your code to check for errors and fix them if required. Release mode doesn't allow us to step into code. Visual Studio makes it easy for developers by providing more tools, which allows us to Step-in, Step-Over, and Step-Out when a debug point is hit by the runtime. These tools are highlighted in a blue box in the following screenshot:

Apart from these tools, Visual Studio also allows us to view stack trace, inspect variables, and much more. Let's explore this further in order to understand more about debugging.
Let's start with the basics. To place a breakpoint, just click on the left margin next to the line of code you want to debug or place your cursor on the line and press the F9 key on the keyboard. Another way to place a breakpoint is to select the Debug menu option and select a new breakpoint.
When you set a breakpoint, the entire line of code is highlighted in the color brown. When the program starts the execution with breakpoints, the control halts at the breakpoint and highlights the line in yellow, which means the highlighted line is set to execute next:

Observe the preceding screenshot; we have a breakpoint at line 13. When you start the program, the control halted at line 13 where the breakpoint is placed. When we step-over, the output is printed on the screen but the control stays at line 14 as shown in the following screenshot:

When a breakpoint is hit, though the application execution is halted, all the variables, functions, and objects remain in memory, allowing us to validate the values. When you want to debug an application, you build it in debug mode, which generates a .pdb file; this file is key for debugging. The .pdb file contains symbols (or source) that get loaded into memory to allow us to debug. If these symbols were not loaded, then you might see an error message stating that the symbols were not found. It is also important to maintain the versions of these pdb files, as any version mismatch between your assembly and the .pdb file will result in an assembly version mismatch error.
Let's jump into an example code and examine the different actions we can perform while debugging, as well as the features that Visual Studio provides us with.
The following is an example program that accepts two numbers and calculates the addition and subtraction of those numbers, and then invokes another method where 10 is added to the result. Let's debug this application by placing a couple of breakpoints in the code block:
internal void Method2()
{
    Console.WriteLine("Enter a numeric value");
    int number1 = Convert.ToInt32(Console.ReadLine());

    Console.WriteLine("Enter another numeric value");
    int number2 = Convert.ToInt32(Console.ReadLine());

    int number3 = number1 + number2;
    int number4 = number1 - number2;
    int number5 = Method3(number4);

}

internal int Method3(int number4)
{
    return number4+10;
}
Here, two breakpoints were placed on lines 18 and 21. When the program starts executing, it stops at line 18 for user input and when you select continue program execution, the control stops at line 21. One of the important things to observe in the following screenshot is that when the control stops at line 21, you can view the value of the number1 variable by just hovering the cursor over it. You can see that the number1 variable has a value of 23:

Visual Studio debugging tools allow us to watch a variable while the program is being executed in debug mode. You can right-click on a variable and select Add Watch to add the variable to the watch window. As you see can see at the bottom of the screen, there is a watch window where variable number3 has been added, and we can see the value of 43, which is the output of the sum of number1 and number2. The watch window allows you to view the values after the line of code executes. This comes in really handy when your application logic is performing complex calculations:

Another window that comes in handy with debugging is Immediate Window (Ctrl + Alt + I), which can be opened by using the keyboard shortcut or the Debug menu. In contrast to the watch window, this window helps you to perform operations before executing the line of code. As you can see in the following screenshot, the control is at line 25 where the breakpoint was hit; however, if you look down, the Immediate Window was open where we performed the number1 - number2 operation to check the value before executing the line:

When you place a breakpoint and hover your cursor over the breakpoint in the left margin, the system displays a cogwheel, which allows you to add conditions to your breakpoint; for example, your program has a for loop, but you want your breakpoint to hit when the loop variable is, say, 5:

When you click on the cogwheel, you will be presented with the condition wizard where you can configure the condition of when the breakpoint should hit. By default, the condition is set to true, which can be changed by the developer. In the following screenshot, we selected number4=3, which means that this breakpoint will be hit when the number 4 value is equal to 3:

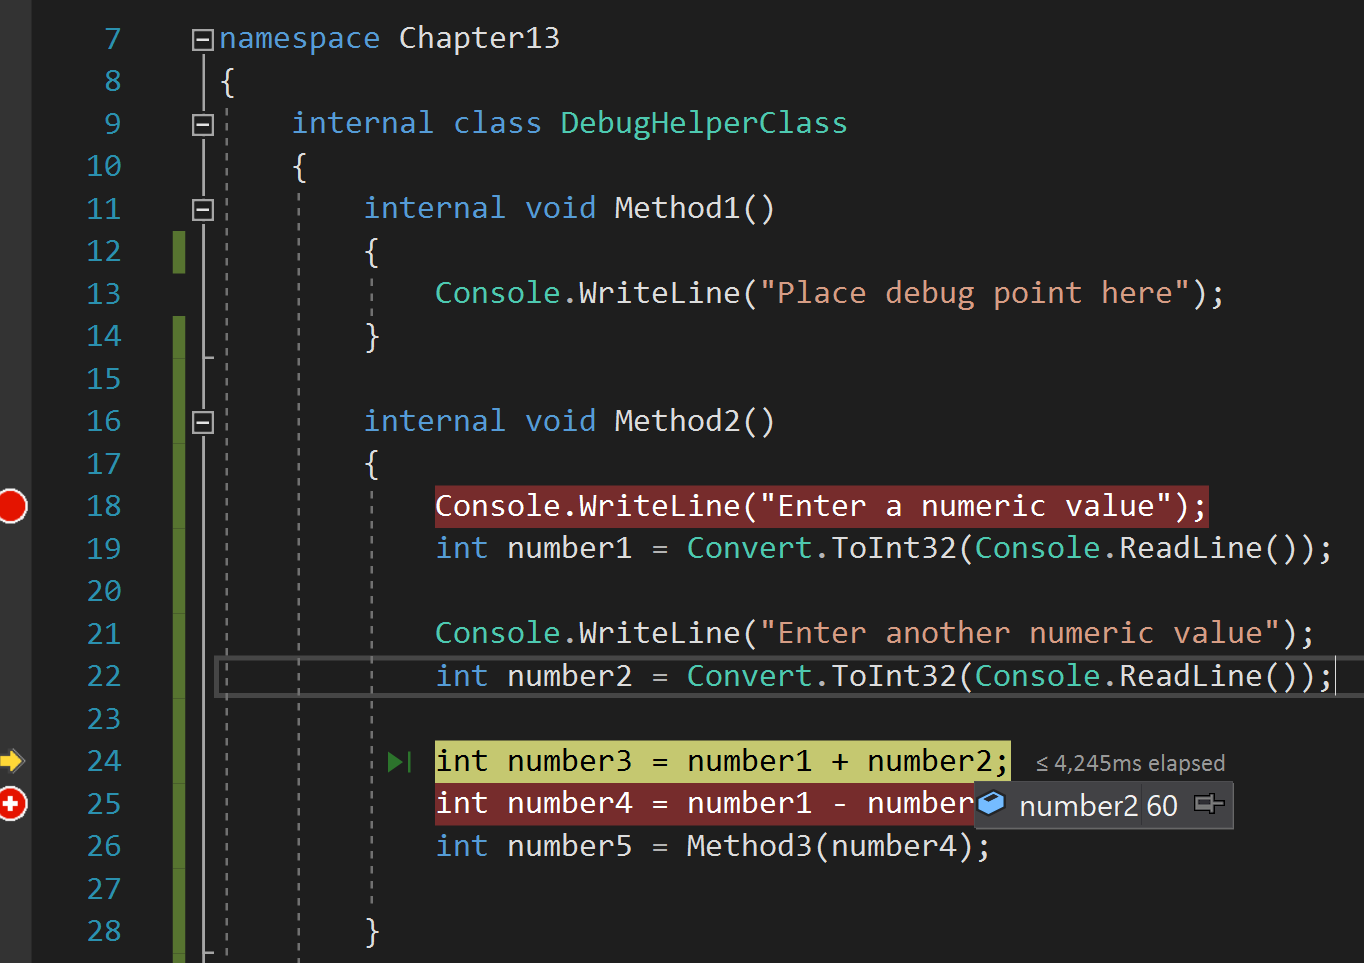
Another important feature to understand while debugging is that certain types of projects in Visual Studio allow you to change the variable values at runtime while debugging the application. When the following program was executed, we entered 60 as a numeric value to variable number2. You can see the value of variable 2 as follows:
Now, when you select the displayed value, the system allows you to change it (we changed it to 40), and then continue the execution of the block with the modified value. Please remember that not every project type will allow you to change values at runtime:

As discussed earlier, there are many tools available while debugging a C# application using Visual Studio and some of them are highlighted in the following screenshot. The Continue and Stop Debugging buttons enable the developer to continue executing once a breakpoint is hit, or to stop the execution.
There are buttons to Step Into, Step Out, and Step Over. These buttons allow you to step into each and every line of code once a breakpoint is hit, or skip the execution of a method and continue the execution in the same context, or step into an external method.
Once you debug your program block and fix all the issues you found, you can disable or delete all the breakpoints at once by using the Delete All Breakpoints or Disable All Breakpoints option in the Debug menu:

A few more options are highlighted in the following screenshot, such as Attach to Process, QuickWatch..., Save Dump As..., Parallel Stacks, Immediate, and Watch windows, Call Stack, and many more:

We structure our project in such a way that multiple assemblies are created, be it a helper or a dependent assembly. While debugging, it is important to load the symbols by attaching the process running those assemblies to the current debugging process using the Attach to Process... command. Otherwise, the system prompts that the source code is not available, so control cannot step into the code block.
In a real-project scenario, sometimes your application crashes suddenly; in such scenarios, you can save the memory dump and analyze the memory registers on what's happening. This might require you to have special skills to read and understand such dumps.
We read about parallel tasks and multithreading in previous chapters; when your code block is running a multithreaded application of parallel tasks, the Debug menu can help you understand the parallel stack and tasks.