

APPENDIX
Schedule Computations
Once a suitable network has been drawn, with durations assigned to all activities, it is necessary to perform computations to determine the longest path through the project. If start and finish dates for the project have already been dictated, these calculations will tell whether the required dates can be met. On the other hand, if a start date is given, the computations will provide the earliest completion date for the project.
The simplest computation that can be made for a network will determine the total working time on the longest path through the project and will reveal whether any latitude exists on paths parallel to the longest path. The longest path is called the critical path, since a slip on this path will cause a corresponding slip in the completion of the project. This computation specifies how many weeks (or days or hours, depending on the time units being used) it will take to complete the project if no holidays or vacation periods exist. Naturally, holidays and/or vacations will intervene during certain parts of the year so that the actual calendar time for the project is likely to exceed the working time.
It is also important to note that the conventional way to compute project working times is to ignore resources initially. In other words, activities are treated as though they have fixed durations, based on the assumption that certain levels of resources will be available when the work begins.
Furthermore, these durations are estimated from historical data and are based on the assumption that a person who possesses the skill level to do the required work is available. As was pointed out in previous chapters, if these conditions are not met, the actual working times will deviate from estimated times, sometimes considerably.
NETWORK RULES
In order to compute project working times, two universal rules apply to defining how networks function. (The software you use may impose additional rules, which will be presented in the user manual.) These universal rules are as follows:
Rule l: Before a task can begin, all tasks preceding it must be completed.
Rule 2: Arrows denote logical precedence. Neither the length of the arrow nor its angular direction have any significance. (It is not a vector but a scalar.)
BASIC SCHEDULING COMPUTATIONS
Although no one is likely to do manual network computations in this day of abundant scheduling software, it is important to understand how the computer makes these computations. Otherwise, it is easy to fall into the garbage-in, garbage-out problem. Furthermore, the computer output is not easily understandable unless the computation method is understood. What does float really mean, for example?
The following material will explain how the basic computations are performed, with no concern for resource limitations. That is, these computations all are based on the assumption that the required resources will indeed be available when the time comes to do the work. This is equivalent to saying that the organization has an unlimited pool of people, which of course is never the case. For this reason, a schedule that assumes unlimited resources is considered to be the ideal or best-case situation, and provides a starting point for resource-constrained project scheduling. Chapter 9 deals with the allocation of resources to yield a realistic working schedule.
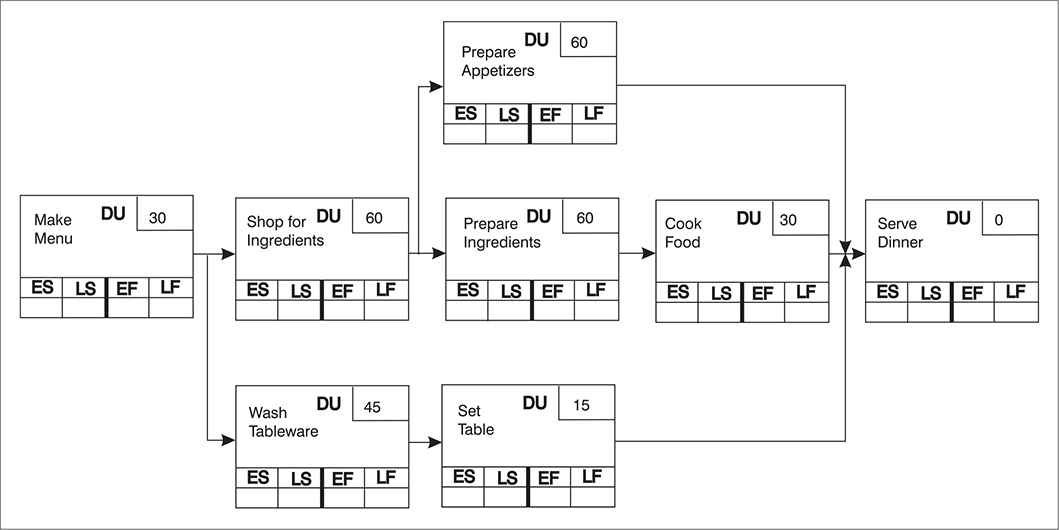
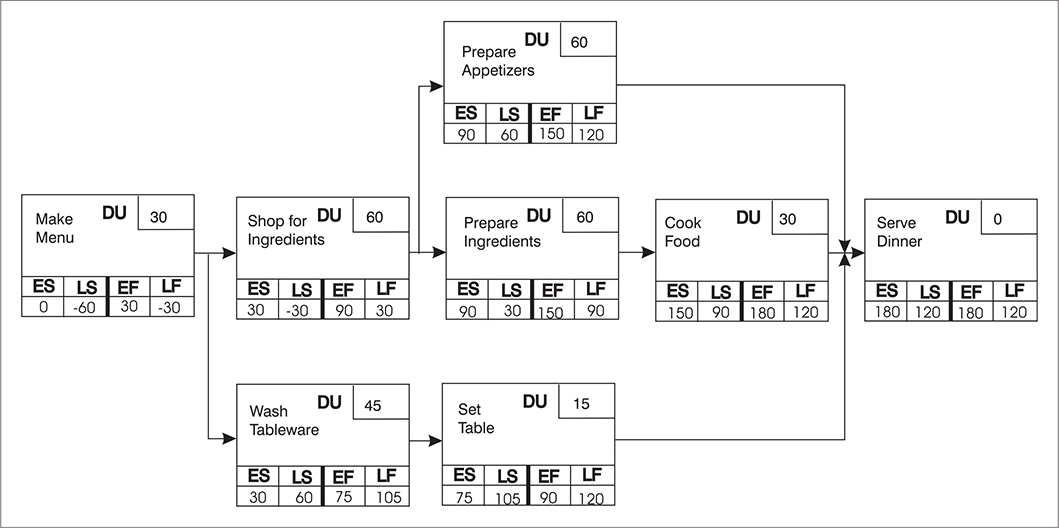
We will use the example given in Chapter 8 of preparing a meal to illustrate scheduling computations. That network is shown in Figure A.1, using activity-on-node (AON) notation. A solution using activity-on-arrow (AOA) notation will be presented later. The numbers in the duration (DU) cells are working durations in minutes. Each activity contains cells in which we can enter the earliest start and earliest finish as well as the latest start and latest finish for the activity. Other notation schemes are used in other books and with various software packages, but this one seems to me to be very simple to understand.
Figure A.1 AON Network for Preparing a Meal
In order to locate the critical path and compute the earliest and latest start and finish times for noncritical project activities, two sets of computations are necessary. These are called forward-pass and backward-pass calculations.
Forward-Pass Computations
A forward pass is made through the network to calculate the earliest achievement times for each activity in the network. If we remember that each activity has a start and a finish, then we can talk about early start and early finish times, as mentioned previously. This really amounts to having start and finish events for each activity, but they are not usually shown in activity-on-node diagrams. As was stated previously, the durations for the activities in Figure A.1 are working minutes. The project is shown as starting at time T = 0. For schedules spanning several days or weeks, once activity start and finish times are determined, they can be converted to calendar dates, but that step will be omitted in this appendix. For our simple project, we will compute the total project time in minutes and then convert that to hours.
Figure A.2 shows the first steps in the forward-pass computation. “Make Menu” starts at T = 0. It takes 30 minutes. That means it has an early finish 30 minutes after it starts, or at T = 30. As soon as “Make Menu” is finished, two activities can start—“Shop for Ingredients” and “Wash Tableware.” This means that the early finish for “Make Menu” becomes the early start for these two succeeding tasks.
Figure A.2 First Step: Forward-Pass Computation
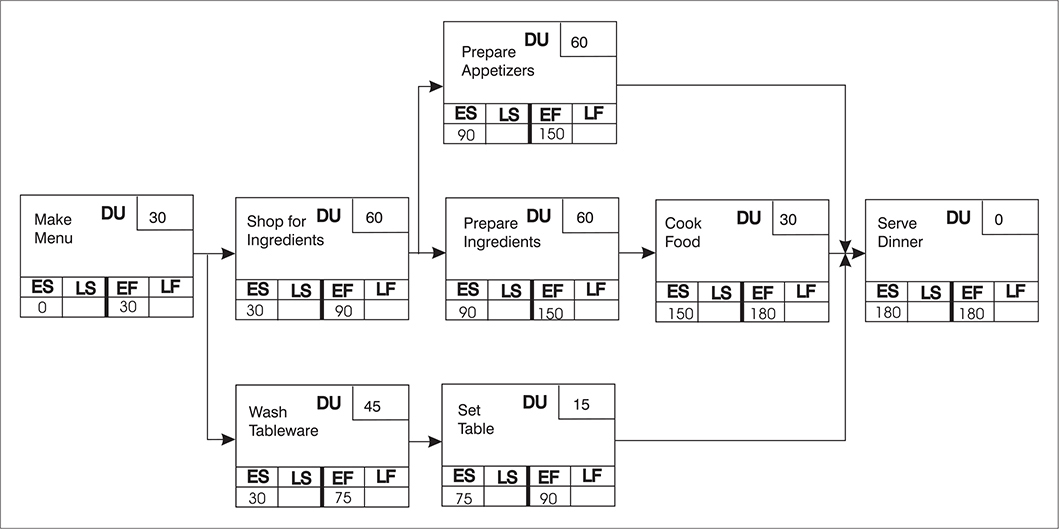
It takes 60 minutes to do the shopping, so the early finish for that task is 90 minutes. You simply add its duration to its early start time to get its early finish. The same is done for “Wash Tableware.” Again, the early finish for each task becomes the early start for succeeding ones. We continue this process until we get to “Serve Dinner.”
At this point, “Prepare Appetizers” has an early finish of 150 minutes, “Cook Meal” has an early finish of 180 minutes, and “Set Table” has 90 minutes for its early finish. Which one becomes the early start for “Serve Dinner”? Remember, Rule 1 presented earlier says that you can’t start a task until all tasks preceding it have been completed. Since “Cook Meal” ends the latest (has the largest early finish time), its early finish becomes the early start for the serving task.
Given the activity durations shown and the sequences detailed by the network, the project has a completion 180 minutes after it begins. Because we are usually trying to meet an imposed completion time for most projects, this working time can now be compared to the target to see if that target can be met, given an anticipated start date or time. If it cannot, then either the project must start earlier, the end date must slip out, or the network must be changed to compress (shorten) the critical path.
For our example, suppose we had planned to come home from work at 5 p.m. and have dinner prepared to serve at 7 p.m. Since we have found that it will take three hours to prepare the meal, this won’t work. We will have to either shorten the time of some tasks, start the process at 4 p.m., or revise the network in some way. Naturally, we could shave 30 minutes off the project by preparing the menu the day before. For many projects, however, such a solution would not be an option, so we will say for now that this option is not available and see what our other approaches are.
In that case, the question is, how will the network have to change in order to finish in two hours? The answer to this question is never obvious in a complicated network (although it is fairly obvious in this one). As a general rule, in order to see what else in the network might have to change, more information is needed. Specifically, we need to know the latest times by which each activity can be achieved and still meet the 180-minute completion.
You might ask, “Why not use the 120-minute completion, since that is what is required?” The answer is that a best-case computation is made first, so that we can see which paths have latitude and which one(s) is critical. The best case is considered to be that 180 minutes is acceptable. A shorter time is a worse case because you will have to squeeze time out of something. A longer time is also a worse case, as you are stretching the project out unnecessarily.
For that reason, we assign a 180-minute late finish to “Serve Dinner,” which means that it has the same early finish and late finish times and zero duration, making it actually an event. This is an example of the only kind of event that is actually shown in activity-on-node networks, and it is called a milestone.
Now that the late finish time has been set for “Serve Dinner,” we do a backward-pass computation to determine the latest event times on all activities that will permit achievement of the 180-minute completion.
Backward-Pass Computations
Beginning with “Serve Dinner,” and assigning a late finish time of 180 to it, we subtract its duration of zero from that time to get its late start (see Figure A.3). Naturally, that gives a late start of 180. This late start time must be the late finish for all the predecessors to “Serve Dinner,” so that time is entered into the cells for each activity. In the case of “Prepare Appetizers,” we subtract its duration of 60 minutes from its late finish of 180, to get 120 minutes. This number becomes its late start time. For “Cook Meal,” we do the same and get a late start of 150. In turn, we use 150 as the late finish for “Prepare Ingredients,” subtract its duration, and get 90 minutes for its late start.
Figure A.3 Backward Pass to Determine Latest Times
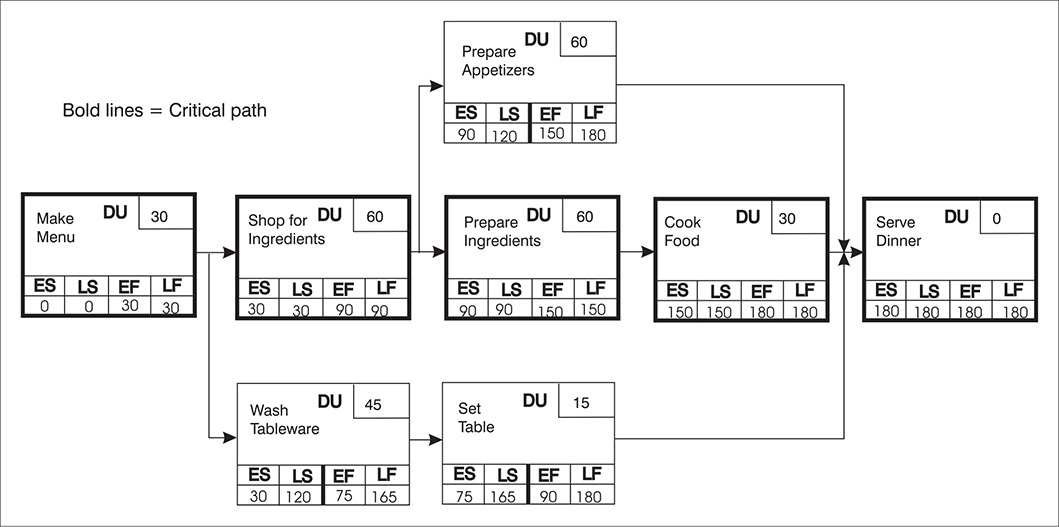
Notice the junction at the beginning of “Prepare Appetizers” and “Prepare Ingredients.” The late start for “Prepare Appetizers” is 120 minutes, and that for “Prepare Ingredients” is 90 minutes. Which one of these should we use for the late finish of the predecessor, “Shop for Ingredients”? If we allowed shopping to finish as late as 120 minutes, “Prepare Ingredients” could not start until that time, and if you work forward from there to the end of the project, you will see that this will push the end time out to 210 minutes instead of 180. We can now offer the following rules for assigning early and late times to activities that have multiple predecessors or successors.
Rule: When two or more activities follow a predecessor, the latest finish for the predecessor will be the earliest late start for the successors.
Rule: When two or more activities precede another, the earliest start for the successor will be the latest of the late finish times for the predecessors.
Continuing in this way, you arrive at the late activity times shown in Figure A.3.
Activity Maximum Float
Now examine “Prepare Appetizers.” Note that its early start is 90 and its late start is 120. The difference of 30 minutes is called the activity float. This float represents latitude for the activity. So long as this activity starts no later than 120 minutes and takes no longer than its duration of 60 minutes, the project can be finished within 180 minutes.
Note the activities that run through the center of the diagram. They all have the same early and late start and the same early and late finish times. These activities have no float and are called critical. The path containing those activities is, in turn, called the critical path. What we have done is apply the critical path method to locate that path. By making the final activity late finish the same as its early finish, we have forced one path to have no float. As you can see, it is the longest path.
The term float derives from the fact that “Prepare Appetizers” can start as early as 90 minutes and as late as 120 minutes, so we say that it can float around for the difference of 30 minutes. Note that float is always calculated by taking the latest start minus the earliest start, or the latest finish minus the earliest finish. In equation form:
Max. float = LF – EF
or
Max. float = LS – ES
where LS means late start, LF means late finish, ES means early start, and EF means early finish.
The Value of Float
It is tempting to think that float is undesirable. The first suggestion that people sometimes make is to finish a task that has float as early as possible and move resources onto the critical path to shorten it, so that you wind up with no float anywhere. To see why this is not a good idea, we must remember that the durations for all tasks are estimates, that they have 50–50 likelihoods if averages have been used, and that we often have made those estimates using poor history, so they are suspect to begin with. Given those facts, it is highly advisable to have float on all but the critical path to compensate for unforeseen problems, estimating errors, and so on.
What about the critical path itself? That series of activities must be managed in such a way that all tasks are completed on time, or the project will be delayed (unless lost time on one activity can be recovered on a later one). It is very risky to allow a critical path task to slip under the assumption that you will recover the time later. Murphy’s Law invariably prevails when you do this. In fact, the best working rule I know is, do whatever is necessary to stay on schedule.
CALCULATIONS FOR AN AOA NETWORK
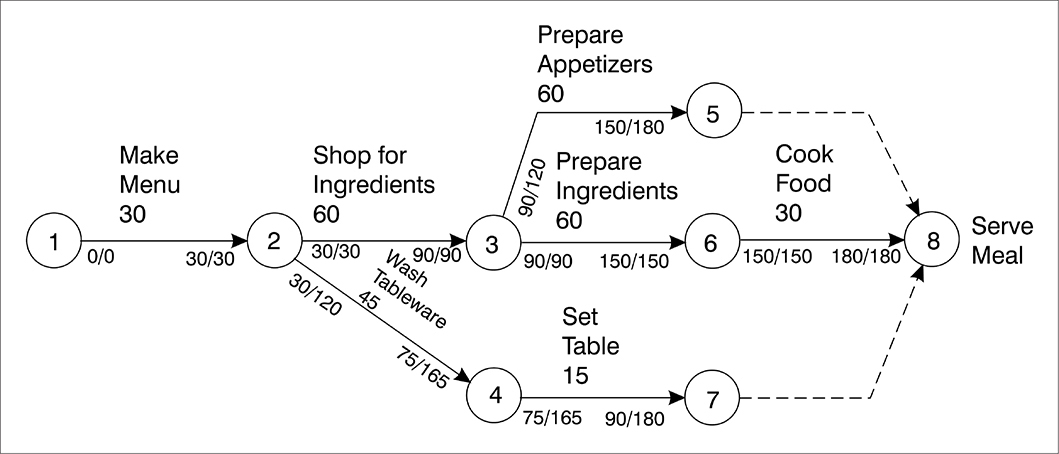
The calculations for AOA networks are done in exactly the same way as those for AON networks. The only real problem is with notation. Figure A.4 is the same diagram for preparing a meal in AOA format. In the first edition of this book, I learned that people were confused by the notation, as I had split each node in half and placed an early time on the left side and a late time on the right. However, as was pointed out earlier, each node contains at least two events, and if several activities enter or leave, there will be several events contained. I have looked at a number of systems of notation, and no single one is unambiguous. For that reason, I have placed the early and late times on each end of all arrows. On the left end will always be the early start and late start, and on the right end will always be the early finish and late finish. Each node is numbered for easy reference. See Figure A.4.
Figure A.4 AOA Diagram for Preparing a Meal
CONSTRAINED END DATE SCHEDULING
As was mentioned earlier, the usual situation for most projects is that an end time (or date) has been imposed, either by contract with the customer or by management, based on business considerations. This end date may be earlier than the earliest completion date determined by the forward-pass computation, in which case the project must be started earlier or the schedule must be shortened somehow.
In many cases, as was mentioned previously, the start date for a project is also dictated by the availability of resources or some other factor, so that the start date cannot be moved up. When this is true, the critical path must be shortened. When this is done, other paths may become problems as well.
For the network just analyzed, suppose the end time was established as 120 minutes (you want to serve dinner at 7 p.m. and start preparations at 5 p.m.). What would be the overall impact on the project? To answer that question, we will impose a late finish of 120 minutes on the project and do a new backward-pass calculation. Note that there is no need to do a new forward-pass computation yet, since the forward pass determines only the early times, and these will not change until an activity duration is changed or the network is redrawn.
Figure A.5 shows the network with the latest project completion constrained to 120 minutes. When the backward-pass computations have been completed, we find a strange thing. The float on the former critical path is now negative! When the float is negative, the activity or path is called supercritical. Note also that “Prepare Appetizers” now has negative 30 minutes of float, whereas before it had positive 30 minutes. Thus we have two supercritical paths. (“Wash Tableware” and “Set Table” still have 30 minutes of float, because originally this path had 90 minutes of float.)
Figure A.5 End Date Constrained
It is also interesting to examine the late times on “Make Menu” and “Shop.” These times are now negative. In the case of “Make Menu,” this is telling us that the activity needs to start 60 minutes before it is planned to start, which we already knew.
If we cannot start the project early, we will have to shorten the critical path by at least 60 minutes to meet our deadline. Let’s suppose we can do this by taking 30 minutes off the time of “Prepare Ingredients” and another 15 minutes each out of “Make Menu” and “Shop for Ingredients.” We might get time out of “Prepare Ingredients” by buying frozen vegetables rather than fresh, so that they don’t have to be chopped. If these adjustments are made, we have the result shown in Figure A.6.
Figure A.6 Network with Times Reduced
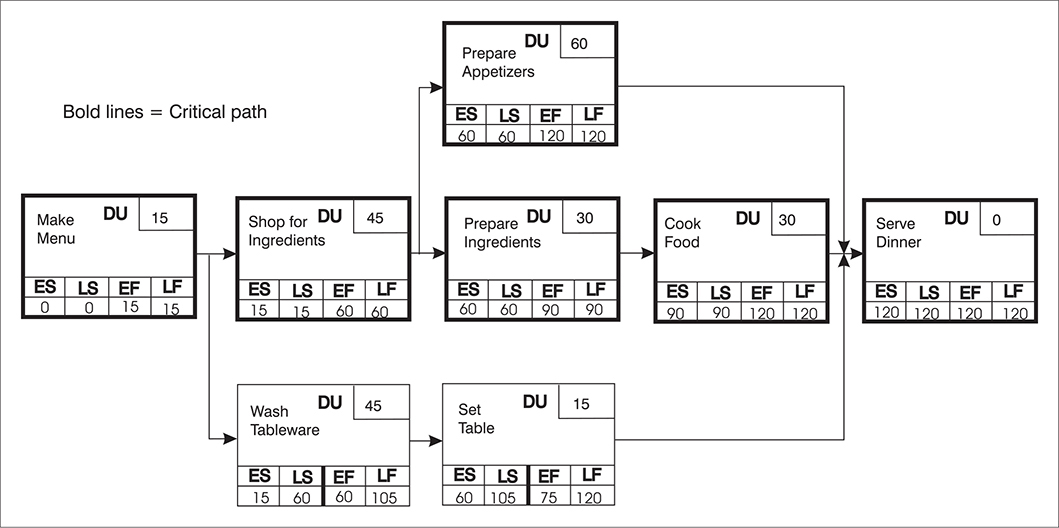
We now have a situation that is not desirable as a general rule. We have two critical paths. “Prepare Appetizers” is critical, as are “Prepare Ingredients” and “Cook Food.” For this particular project, we might not be concerned about having two critical paths, but most of the time this would be very undesirable. The reason is that when you have no float, anything that goes wrong with the task and increases its duration will cause your overall project finish time to slip by the amount of the increased duration (unless you can reduce the times taken by subsequent tasks). The presence of two critical paths increases the risk.
For this reason, you should try to get rid of all but one critical path. This can be done only by changing the duration of one or more activities, allowing the end date to be extended or redrawing the network into a new configuration.
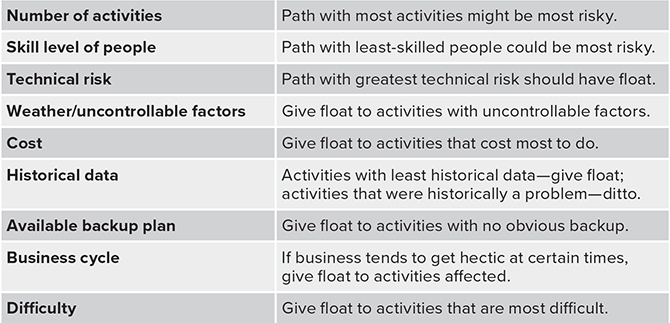
The issue is how to decide which critical path to eliminate. There is no single answer to this problem. Float is only one kind of risk involved in a project. There are also risks from technical problems, poor estimates, weather and other uncontrollable factors, and so on. Table A.1 lists some of the factors that should be considered in making a decision. The comments that follow each factor explain the rationale for deciding what to do.
TABLE A.1 Factors to Consider in Eliminating a Dual Critical Path
REDUCING ACTIVITY DURATIONS
When it is necessary to reduce the duration of a critical path, we usually try to reduce activity durations rather than redrawing the network. That is because we usually feel that the logic is more or less sound, so changing sequences might not be an option. When it is, techniques like lead-lag networks, for example, can be used first.
Whether activity durations can be reduced depends on three factors. Can the work be done faster by increasing efficiency (perhaps by using a more productive person)? Can the scope of the work be reduced? Can extra effort be applied to the job to get it done faster (by increasing resources)? It is not always possible to reduce activity time by adding more resources, since a point of diminishing returns is reached, often because people simply get in each other’s way.
There are, of course, two ways to increase human resources applied to a project. One is by adding bodies. The other is by working the same number of people more hours per day, which we call working overtime. In both cases, you tend to get diminishing returns very quickly. I know of one company that measured the impact on productivity of working overtime. It measured productivity for a normal 40-hour week and then again at the end of three weeks in which people worked 50 hours per week. Productivity after working overtime was back down to the normal 40-hours-per-week level, and errors had increased.
When productivity declines without errors increasing, it is often because people are pacing themselves. They think like a marathon runner who knows that if she runs too fast at the beginning and uses up her energy, she will be unable to finish the race. On the other hand, when error rates increase, it is usually because people are truly fatigued.
We also find that people doing knowledge work suffer the same kind of problems. One study found that when people put in 12 hours of overtime on knowledge work, you probably get an increase in output from them equivalent to what you would expect in 2 normal working hours!
CONVERTING ARROW DIAGRAMS TO BAR CHARTS
While an arrow diagram is essential to do a proper analysis of the relationships between the activities in a project, determine activity float, and identify the critical path, the best tool for the people who are actually doing the project work is the bar chart. People find it much easier to see when they are supposed to start and finish their jobs if they are given a bar chart. The schedule shown as an arrow diagram in Figure A.4 has been portrayed as a bar chart in Figure A.7, making use of what we’ve learned about the schedule from the network analysis.
Figure A.7 Bar Chart for Project to Prepare a Meal
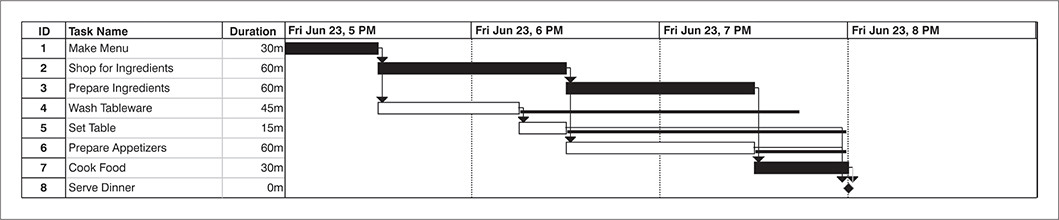
In this figure, critical path activities are shown as solid bars, while those with float are shown as hollow bars with dots trailing to indicate the amount of float allowed each activity. Note that each activity is shown starting at its earliest possible time, so that float is reserved to be used only if absolutely necessary. This is the conventional method of displaying bar charts.
Note that both “Wash Tableware” and “Set Table” have 90 minutes of float. Naturally, it is the same float, and initially, before the project begins, there are 90 minutes of float available for either activity. However, if all of the float is used up on “Wash Tableware,” there will be none left for “Set Table,” and it would therefore be critical.
This illustrates a real pitfall of bar charts. Assume that different individuals are doing two sequential activities that share a common amount of float. Since the chart does not show the interrelationships of activities, it is hard for the people performing the work to tell that the float is shared. They look at the chart and think that they each have the designated float. Then, if each tries to make use of the float, the project is in trouble.
In fact, Parkinson’s Law can be applied to project float. Parkinson’s Law says that work always expands to fit the time allowed. When applied to float, this means that when you allow float, people will use it! For this reason, some software can be set up so that float is not displayed. The implication of such a schedule is simply that the work should be done as shown.
I personally do not like this approach. I prefer to explain to team members that float is shared, and I encourage them to keep float in reserve, to be used only if necessary. Indeed, it is always a good idea to keep float in reserve, to be used if an estimate turns out to be wrong or if an unforeseen problem causes the work to be delayed. As someone told me recently, every project should be planned as if there will be at least some percentage of the total time when the entire city will have a power blackout and nothing will get done.
McGregor formulated a management model some years ago stating that some managers see workers as undependable, wanting only a paycheck from the job, and so on. He called this a Theory-X outlook, and he postulated that a manager with such an outlook would tend to get the expected results.
The opposite outlook, which is more positive, he called a Theory-Y view. This would naturally be the more desired view, as a manager would tend to get the more positive result. It is easy to see Parkinson’s Law and Lewis’s Law for Float as Theory-X outlooks. However, I don’t see them that way. In today’s downsized, right-sized, understaffed organization, people simply have to do their work in priority order, and this leads to putting things off until they absolutely have to be done. Thus, if people have float, they tend to take it, but unfortunately they may take it at the beginning of an assignment; if they encounter a problem with the work later on, no float is left to help get the work done on time.
LIMITATIONS OF THE CRITICAL PATH METHOD
It is important to remember that conventional critical path analysis, which has been used for this network, assumes that unlimited resources exist in the organization, so that all activities can be done as planned. As the bar chart shows, however, there are a number of points at which activities are running in parallel. If those activities require the same resources, then there may not be enough to get the job done as shown, and the schedule cannot be met. This subject is addressed in Chapter 9.
Multiple Calendars
One final subject must be considered in doing basic network computations. It is possible that not all project activities will follow the same working schedule. Does everyone work Monday through Friday? Do some people work only weekends?
Some projects may include activities that require actual working days to complete; others do not. Pouring concrete must be done during the workweek. However, that concrete may cure over a weekend. For this reason, it is important that multiple calendars be considered in scheduling.
For example, a situation in which one group works a conventional Monday–Friday schedule and another group works only weekends is shown in Figure A.8.
Figure A.8 Multiple-Calendar Network
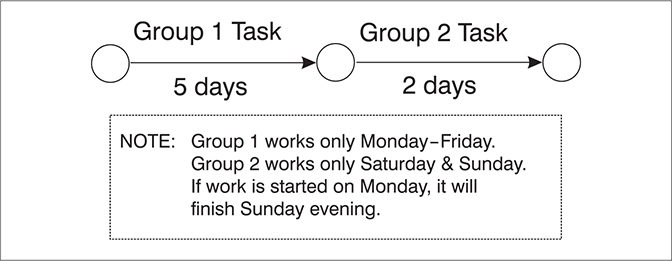
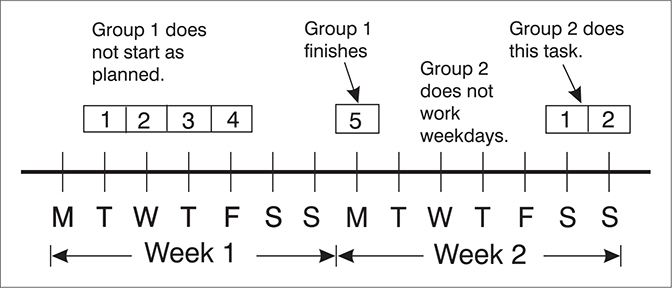
Now, suppose the two groups are scheduled to do two sequential tasks, with Group 1 working exactly one week (M–F), followed by the people in Group 2, who are supposed to finish their work over the weekend. However, Group 1 gets behind on their work by one day. How much is the schedule affected? As Figure A.9 shows, the work will slip an entire week because Group 1 gets behind only one day!
Figure A.9 A One-Week Slip
This kind of problem highlights the occasional need for multiple calendars in scheduling. They are called calendars because holiday and overtime dates differ for the two groups. If the software being used does not permit the use of multiple calendars, it may still be possible to “fake it” and force the schedule to reflect correct working dates, but this may be difficult to do. For this reason, software should be selected with this potential requirement in mind.