
5
Splitting the Monolith
In the previous chapter, we created a monolithic application to serve as an assistant; we did so rapidly, concentrating on adding features rather than long-term architecture. There is nothing wrong with that approach—after all if the application never needs to scale up then the engineering effort is wasted.
But let us assume that our service is very popular, and the number of requests it receives is growing. We now have to make sure it performs well under load, and also ensure that it is easy to maintain for a growing team of developers. How should we proceed from here? In this chapter, we will:
- Examine how to identify the best components to migrate to a new microservice based on code complexity and data we collect about usage
- Show techniques for preparing and performing that migration, as well as checking on its success
Identifying potential microservices
For an application that is familiar to us, we might have a lot of intuition about which components are overloaded or unreliable. After all, either we wrote it, or have rewritten large parts of it, and tested it, along with making decisions about its architecture. It's also natural to have made notes about the database growing larger, or noticing that one particular function takes a long time to run during testing.
Our own intuition may lead us astray, however, and it is a good idea to let our decisions be informed by the data we collect. Developers and operations people will have specific questions that should be answered to make a decision about the future direction of a service. Product management and other business-oriented people will also have questions that need answering, which are often not specific to the technology. Questions a developer may ask include:
- How fast are responses to HTTP requests?
- What are the success and error rates on HTTP requests for different endpoints?
- Which parts of the system are troublesome when making changes?
- How many active connections does a component have to deal with, on average, at peak use?
Some non-technical business questions to consider are:
- Does a slow response mean a user will stop checking with our Slack bot and start using other tools instead?
- In a web-based shop, what is the conversion rate—that is, how many customers viewed items, compared to how many bought something?
- How accurate and up to date is the information we provide through the service?
For our discussion, we will focus on technical questions, but it is always worth remembering why software exists, and how best to answer the questions put forward by the people who need an application—as well as the people who produce it. To make our decisions about splitting our monolithic application, we will keep two questions in mind:
- Which components are the slowest and cause the most delays when they are run?
- Which components are tightly coupled to the rest of the application, and so fragile when changed?
There are many aspects to software and what it does—network connections, reading files, querying databases, and so on. It is tempting to think that collecting everything and looking for patterns in the data will be the best way to monitor the application. There is often too much data to sift through, however, and too many variables to account for. Instead, we should start with a qualitative question.
However, the question should not be, "which parts of the application would work as a microservice?"; instead, we should consider questions such as "which parts of the application are having the most impact on performance?" and "which parts of the application are difficult to change?" The answer might be a microservice—and since this book is about that option, we will investigate it in depth—but there are other performance problems that can arise, and other solutions, such as optimizing a database or caching common query results.
Let us look at some ways that we can identify the parts of an application that need refactoring, and that would make good microservices.
Code complexity and maintenance
As we discussed in Chapter 1, Understanding Microservices, as the size of a project increases it becomes more difficult to reason about, especially for people new to the team. Keeping different logical parts of the system separate and having a clean interface between them helps us think more effectively about the interactions between all the different components—making it easier to understand where to make changes—without having to worry about accidentally breaking something in code that seems unrelated.
Many of the decisions made when looking at maintenance will be based on experience: when reading the code, developers get a sense of what areas they understand well, and which areas they do not, as well as how risky it is to change various parts of a project.
We can also take a data-informed approach by using tools that assess the cyclomatic complexity of the code. Cyclomatic complexity is a software metric, developed in the 1970s, to assess how many branches and paths of code execution a program has. Understanding the mathematics is outside the scope of this book, so for our purposes we should understand that a higher score indicates more complex code, and code that scores 1.0 has no decisions in it at all.
Radon (https://pypi.org/project/radon/) is a Python tool for quickly assessing code complexity; it also groups the complexity scores into bands, similar to academic grades such as A through F. Since our examples so far have been simple, let's run Radon against Quart itself.
Here, we tell Radon to calculate the cyclomatic complexity and only report on those areas that have a complexity rating of C or worse:
$ git clone https://gitlab.com/pgjones/quart
$ cd quart
$ radon  cc .  --average --min c
asgi.py
    M 205:4 ASGIWebsocketConnection.handle_websocket - C
blueprints.py
    M 510:4 Blueprint.register - D
cli.py
    F 278:0 routes_command - C
    M 48:4 ScriptInfo.load_app - C
app.py
    M 1178:4 Quart.run - C
helpers.py
    F 154:0 url_for - C
    F 347:0 send_file - C
testing/utils.py
    F 60:0 make_test_body_with_headers - C

8 blocks (classes, functions, methods) analyzed.
Average complexity: C (15.125)
It's easy to think that a high-complexity function is always bad, but that's not necessarily the case. We should strive for simplicity, but not over-simplification to the point where we lose usefulness in the software. We should use scores like these as guides for our decisions.
Now, we will look at other sorts of data we can collect about our code, to help us make informed decisions.
Metrics and Monitoring
It is easy to think of monitoring tools as being useful to alert us when something is broken, but there are other valuable uses. Operational health monitoring relies on a wide range of high-resolution metrics that arrive with low latency to allow us to notice and fix problems with the system. To determine if a change in architecture is needed, we might look at the operational health of a service, but we also want to look at the service's quality: quality assurance discovers whether or not the service is meeting our standards.
How is this different from operational health? In a complex system, there can be components that are unreliable or slow, but the overall performance of the system is acceptable to the people using it. If we ask software to send an email for us, and it arrives ten seconds later, then most people would consider that quality of service acceptable, even if behind the scenes there are numerous failed nodes, connection timeouts, and retrying operations. Such a service is working but needs maintenance, or it will continue with a higher risk of a large outage or lack of burst capacity.
Gathering data about what our application is doing leaves us more informed about which components need attention, which are slow, and which are responding well. What does it mean to take a measurement? It has historically been tricky to pin down a good definition. Psychologist Stanley Smith Stevens, however, describes it in a useful way:
Measurement, in the broadest sense, is defined as the assignment of numerals to objects and events according to rules.—On the Theory of Scales of Measurement, S. S. Stevens (1946)
What is a good measurement to make? Giving a firm answer to this is difficult too, although for our purposes, there are three main categories of data we could collect. The first is gauges, which are an absolute measure at a certain point in time. A fuel gauge in a car will tell you how much fuel is remaining, and a tool such as netstat will tell you how many open network connections a server has. Inside a service, a measurement, such as the number of active connections, is a gauge.
Counters are measurements that continue to grow incrementally and cumulatively—you will often see measurements about the amount of network traffic or disk I/O as a counter. Whenever you ask the kernel how many bytes have been transferred out of a network interface, you will get a number that doesn't mean much by itself, as it will be the total amount of traffic since counting started. But ask again one second later, subtract one number from the other, and now you have a value that is bytes per second. Unix tools such as iostat and vmstat do this for you, which is why the first set of numbers they display is often very high and should be discounted.
It is important to understand what your gauges and counters are collecting, as it changes the ways in which they can be used. Taking an average value—mostly the mean, but sometimes a median—usually gives us a meaningful number. If we record that, in the last second, our laptop's six CPU cores have used 0, 0, 0, 1, 1, and 1 seconds of CPU time, it makes sense to say our average CPU usage is 50%. It is also reasonable to say that we have used a sum of three seconds of CPU time in the last one second. However, if we are measuring the temperature of our laptop and its three sensors tell us the values of 65, 70, and 75°C, the average value is still useful, but it would be meaningless to say the total temperature is 210 degrees!
Ratios are the third category of data we are concerned about. These describe how the other measurements relate to one another. We have already seen a useful ratio when discussing counters, as "the number of bytes transferred" divided by "the time it took" gives us a ratio, as does "the number of bytes transferred" divided by the number of API calls.
Choosing what metrics to collect is often a difficult choice, as there are so many possibilities. It is best to start with specific questions and work toward answering them, rather than trying to collect everything at once. If people report that our application is slow, then we need to discover what parts are slow to respond, and why. Thankfully we can start with two of the easiest things to monitor in a web application:
- Counting how many times each endpoint is visited
- How long each endpoint takes to finish processing a request
Once we have information about these two things, this will hopefully direct us to a specific endpoint that is overloaded, or that takes too long to process requests and falls behind. If it doesn't help, then we need to start investigating similar high-level information about other components of the system, such as the database or network throughput. To investigate this in a cloud-agnostic way, we will turn to a common tool for operational monitoring, called Prometheus (https://prometheus.io/). Prometheus operates by scraping endpoints—we configure it with some URLs to query, and it expects some metrics to be returned when it sends a request. To easily integrate metrics into our application, we can use the aioprometheus library. Its documentation can be found at https://aioprometheus.readthedocs.io/en/latest/.
To begin with, we will have to set up the metrics that we want to collect. For now, let's assume that we are interested in how many concurrent requests an endpoint is responding to, and how long each request takes. We can use aioprometheus to set up a Registry object to store these until a Prometheus server asks for the information. The number of active requests is a gauge, since it is a snapshot of the current state at a single point in time. The duration of each request is recorded as a Summary object, as once the data is in Prometheus, we will want to aggregate it, and perhaps look at the distribution of values. We can create both registries and then add them to our application:
    app.registry = Registry()
    app.api_requests_gauge = Gauge(
        "quart_active_requests", "Number of active requests per endpoint"
    )
    app.request_timer = Summary(
        "request_processing_seconds", "Time spent processing request"
    )
    app.registry.register(app.api_requests_gauge)
    app.registry.register(app.request_timer)
We also need to add an endpoint for Prometheus to reach our application and ask for the metrics that have been collected. aioprometheus also provides a render function to generate this data for us, and so the metrics handler is short:
@app.route("/metrics")
async def handle_metrics():
    return render(app.registry, request.headers.getlist("accept"))
Once that is done, we can make use of some helper functions provided by aioprometheus to record the duration of a function, and also to automatically increment and decrement a gauge. The contents of the function here are just to provide some content that takes some time—we will sleep for between 1 and 1.5 seconds to generate a set of values for how long the response takes. Let's add it all together into a working example:
# quart_metrics.py
import asyncio
from random import randint
from aioprometheus import Gauge, Registry, Summary, inprogress, render, timer
from quart import Quart, request
app = Quart(__name__)
app.registry = Registry()
app.api_requests_gauge = Gauge(
    "quart_active_requests", "Number of active requests per endpoint"
)
app.request_timer = Summary(
    "request_processing_seconds", "Time spent processing request"
)
app.registry.register(app.api_requests_gauge)
app.registry.register(app.request_timer)
@app.route("/")
@timer(app.request_timer, labels={"path": "/"})
@inprogress(app.api_requests_gauge, labels={"path": "/"})
async def index_handler():
    await asyncio.sleep(1.0)
    return "index"
@app.route("/endpoint1")
@timer(app.request_timer, labels={"path": "/endpoint1"})
@inprogress(app.api_requests_gauge, labels={"path": "/endpoint1"})
async def endpoint1_handler():
    await asyncio.sleep(randint(1000, 1500) / 1000.0)
    return "endpoint1"
@app.route("/endpoint2")
@timer(app.request_timer, labels={"path": "/endpoint2"})
@inprogress(app.api_requests_gauge, labels={"path": "/endpoint2"})
async def endpoint2_handler():
    await asyncio.sleep(randint(2000, 2500) / 1000.0)
    return "endpoint2"
@app.route("/metrics")
async def handle_metrics():
    return render(app.registry, request.headers.getlist("accept"))
if __name__ == "__main__":
    app.run(host="0.0.0.0")
For a production service, the metrics collection service is another component that needs to be deployed and managed; however, for our own experiments while developing, a local copy of Prometheus is enough, and we can run it in a container. If we set up a basic configuration file, we will need to make sure that the targets match the IP address of the computer we are running our application on—it cannot be localhost, as Prometheus is running inside its own container, and so traffic to localhost will never leave that container. Here is our configuration, which we can place in a file called prometheus.yml, which we will then include in the container:
# prometheus.yml
---
global:
  scrape_interval: 15s
  external_labels:
    monitor: 'quart-monitor'
scrape_configs:
  - job_name: 'prometheus'
    scrape_interval: 5s
    static_configs:
      - targets: ['192.168.1.100:5000']  # Replace with your app's IP address
        labels:
          group: 'quart'
Now we run Prometheus and visit the web interface, which, if you are running the container on your laptop, will be at http://localhost:9090/:
docker run
    -p 9090:9090
    -v /path/to/prometheus.yml:/etc/prometheus/prometheus.yml
    prom/prometheus
Figure 5.1 shows the data we collect after running a series of queries against our running application, using the Boom (https://github.com/tarekziade/boom) tool that we introduced in Chapter 3, Coding, Testing, and Documentation: the Virtuous Cycle, when discussing load testing. Because we randomized which endpoints we call in the test, we can see the different rates of use in the graph. The Prometheus query asks for the rate of the number of active requests each minute, using the name of the gauge we set above in quart_metrics.py.
More information about querying Prometheus can be found here: https://prometheus.io/docs/prometheus/latest/getting_started/.

Figure 5.1: An example of Prometheus showing how many active requests each endpoint is serving
Now we have a much clearer picture of how many times each endpoint in our API is queried, and how long those requests take. We could also add extra metrics, such as how much CPU time is used, how much memory is consumed, or how long we are waiting for other network calls to complete. Data like this helps us pinpoint exactly which parts of our application consume the most resources, and which have trouble scaling up.
Logging
Numbers can tell us a lot about what's going on in an application, but not the whole story. We also need to use logging, which is the act of producing some text or data that will be recorded, but is not part of the essential operation of the software. This does not mean that logging isn't important—it is—but the application could run happily without any messages being written out.
Once we have an idea of which parts of a system are operating slowly, the next question is going to be "what, exactly, is it doing?" Reading the code will only give us part of the answer—logging will give us the rest, by recording which decisions were taken, what data was sent, and what errors were encountered.
Recording absolutely everything will increase the I/O requirements of the application, either sending those messages across the network or using up disk resources writing the files locally. We should carefully consider what gets written out, and why. This is especially true when log messages might contain sensitive information, such as personal details about people or passwords. For a service running in production, logs should be sanitized whenever possible, removing anything that might leak personal data.
Python has powerful logging options that can automatically format messages for us, and filter the messages based on their severity. The log message's severity is graded on a scale of debug, info, warning, error, and critical, which allows us to easily change how many messages our application produces with one setting, instead of changing each line that produces a message.
Quart provides an interface that allows the use of Python's built-in logging with ease, within the application. Let's take a look at a basic example where we use app.logger to produce log messages whenever hello_handler is called:
# quart_logging.py
import logging
from quart import Quart, request
app = Quart(__name__)
app.logger.setLevel(logging.INFO)
@app.route("/hello")
def hello_handler():
    app.logger.info("hello_handler called")
    app.logger.debug(f"The request was {request}")
    return {"Hello": "World!"}
if __name__ == "__main__":
    app.run()
When we run our application and the /hello endpoint is queried, Quart will display one extra message in the terminal where it is running:
    [2021-06-26 21:21:41,144] Running on http://127.0.0.1:5000 (CTRL + C to quit)
    [2021-06-26 21:21:42,743] INFO in quart_logging: hello_handler called
    [2021-06-26 21:21:42,747] 127.0.0.1:51270 GET /hello 1.1 200 18 4702
Why only one message? The second call is using the "debug" severity, and we set the log level to INFO so that only messages of informational importance and above are produced. If we want our debugging messages to appear, we can change app.logger.setLevel(logging.INFO) to app.logger.setLevel(logging.DEBUG).
While there is a specific format to our log messages so far, what gets produced is still a single text string. This can be awkward to process if you have a program that wants to examine the log entries for important errors or find patterns in what is happening.
For log messages that should be readable by a computer, structured logging is the best option. Structured logging is commonly a log message produced in JSON format, so that the date, text description, source of the message, and any other metadata are all separate fields in the JSON. Python's structlog library does a good job of formatting the output correctly, and also makes it easy to add processors to the log message to censor names, passwords, and other similar private information: https://www.structlog.org/en/stable/index.html.
Using it with Quart involves setting up structlog, and replacing the functions used to create log messages:
# quart_structlog.py
import logging
from quart import Quart, request
import structlog
from structlog import wrap_logger
from structlog.processors import JSONRenderer
app = Quart(__name__)
logger = wrap_logger(
app.logger,
    processors=[
        structlog.processors.add_log_level,
        structlog.processors.TimeStamper(),
        JSONRenderer(indent=4, sort_keys=True),
    ],
)
app.logger.setLevel(logging.DEBUG)
@app.route("/hello")
def hello_handler():
    logger.info("hello_handler called")
    logger.debug(f"The request was {request}")
    return {"Hello": "World!"}
if __name__ == "__main__":
    app.run()
Using the code above, we now get structured log entries—still surrounded by human-readable text, but now there are entries that a computer can easily parse:
[2021-06-26 21:54:24,208] INFO in _base: {
    "event": "hello_handler called",
    "level": "info",
    "timestamp": 1624740864.2083042
}
[2021-06-26 21:54:24,211] DEBUG in _base: {
    "event": "The request was <Request 'http://localhost:5000/hello' [GET]>",
    "level": "debug",
    "timestamp": 1624740864.211336
}
Further configuration of structlog allows you to send the JSON directly to a central logging server, such as Graylog (https://www.graylog.org/), which will be useful for collecting logs from multiple different copies of your software running on different computers.
With all this information about code complexity and how well each component in our monolith is working, we should have a good idea as to which areas need the most work, and which would benefit the most from being extracted into their own microservice. Once we have identified those components, we can begin this process.
Splitting a Monolith
Now that we know which components are consuming the most resources and taking the most time, how should we split them up?
It's already possible to move several components in our service to separate servers. RabbitMQ, Celery, and the database all communicate over the network, and so while there are a lot of steps to setting up new servers and configuring them, it is a well-understood process to install those hosts and update our application to use new URLs. This lets our API concentrate on handling network connections and moves the larger tasks to their own workers.
A developer must also consider setting up network security, accounts, access control and other concerns relating to running and securing a service.
The parts of our own application are trickier: we call functions to invoke our own features, and we will need to call a REST API instead. Should this be done using one large deployment and all the changes in one go? Should we run the old and new versions side by side for a while?
A cautious, measured change is always safer. Being cautious does not mean you have to be slow, but it does involve planning. How do we tell if the migration is successful? What happens if we need to reverse the changes? Asking these questions lets us discover difficult situations in the migration before they happen—although things may not always go according to plan. There is an old saying that plans never survive contact with the enemy, but there's an important nuance, attributed to former US President Dwight D. Eisenhower:
Plans are worthless, but planning is everything.—Dwight D. Eisenhower, 1957
It doesn't matter if the plans you make don't end up being useful. The act of making those plans helps you to better understand a situation and leaves you with the tools to deal with the changing situation in front of you.
An excellent first step with any approach is to return to our service-oriented architecture principles and define a clear interface between the future microservice and the rest of the application. Let's look back at our monolithic application, at the function that works out which action to perform, and the other that gets chosen if the user wants to look up the weather. This code has plenty of issues, but we will address the relevant ones:
# Decide which action to take, and take it.
async def process_message(message, metadata):
    """Decide on an action for a chat message.
    Arguments:
        message (str): The body of the chat message
        metadata (dict): Data about who sent the message,
                         the time and channel.
    """
    reply = None
    for test, action in ACTION_MAP.items():
        if message.startswith(test):
            reply = await action(message[len(test):] metadata)
            break
    if reply:
        post_to_slack(reply, metadata)
# Process the weather action
async def weather_action(text, metadata):
    if text:
        location = text.strip()
    else:
        with user_dal() as ud:
            user = ud.get_user_by_slack_id(metadata[metadata["sender"])
            if user.location:
                location = user.location
            else:
                return "I don't know where you are."
    return await fetch_weather(location)
We see that our weather_action function gets all the information it needs from the process_message, but it also needs to understand how to parse the text received as part of the message, and how to interpret the metadata about replying. Ideally only the function that replies needs to understand that metadata. If we wanted to turn the weather feature into a microservice, then we would need to have some way of understanding the messages from different sources, which would require reading the User table to learn where someone is if they haven't told us during the query. We can refactor this to make the function call very clear with regards to what data it needs.
First, it's not easy to test the way in which the location is extracted from the received message. Two new specialist functions should help with that, and ensure that these are more easily tested—the text processing in extract_location only relies on its inputs, and fetch_user_location is now just a database lookup, which we can mock in testing:
async def extract_location(text):
    """Extract location information from free-form text."""
    return re.sub(r'^weather (in )?', '', text)
async def fetch_user_location(slack_id):
    location = None
    with user_dal() as ud:
           user = ud.get_user_by_slack_id(metadata[metadata["sender"])
        location = user.location
    return location
The ability to generate a more complex analysis of the text to find a location within it is now easier too, as it can be done without affecting any other code. What should call these two functions? The answer is a new pre-processor that can accept the freeform text of a message written by a human and try to structure the data within it. We will also adjust our weather action so that it is now very simple and calls a function that performs the web request we need, and passes that text on to the component that sends messages back to Slack:
async def process_weather_action(text, metadata):
    potential_location = await extract_location(text)
    if not potential_location:
        potential_location = await fetch_user_location(metadata["sender"])
    if potential_location:
        await weather_action(potential_location, metadata)
    else:
        await send_response("I don't know where you are", metadata)
async def weather_action(location, metadata):
    reply = await fetch_weather(location)
    await send_response(reply, metadata)
Now, when the time comes to move to a microservice, we have a clear model of what the microservice should accept and what data it needs to return. Because the function call can be replaced with one that will perform a web-based query with the same well-structured data, we can incorporate this data into our tests and become more confident that the new microservice will operate as expected. We are also changing the way responses are sent, so that we do not rely on the code that called weather_action, but can instead pass a message on to a dedicated handler. Once we swap to a microservice, the calling code no longer needs to wait for a reply.
Feature Flags
Changing a large codebase often involves multiple large patches, which in professional environments will be reviewed by peers before they are accepted and merged. With large changes, it can be confusing when you must determine exactly which set of patches must exist in order for a new feature to work. Even worse, if something goes wrong and the changes need to be reverted, this can cause problems in a fast-moving environment where others may have already made new changes that make assumptions about what is already there.
A feature flag is a configuration option that exists purely to turn a specific feature on or off. They operate in a similar way to normal configuration options, letting you choose the behavior of the software, but they primarily exist to help with new features, fixes, and migrations. Instead of coordinating multiple large software patches, those changes can arrive in production whenever is most convenient, and they will not be used unless a new configuration option is turned on.
Turning a new feature on is then simply a case of adjusting the configuration file—whether that's through a new release, some configuration management software, or updating a service discovery tool such as etcd (https://etcd.io/), which we discuss in Chapter 10, Deploying on AWS. There will also be situations—despite all the careful planning—in which you need to turn off a new behavior in a hurry. A feature flag means that this is a simple operation, easily understood by anyone who has to review and understands the change.
A feature flag does not have to be an all-or-nothing switch. Given a choice between either a "call a local function" or "make a web request" path, it could be told to send 99% of the traffic to the first path and 1% to the second to let you examine how successful those queries are. A migration can continue slowly, gradually increasing the proportion of traffic going to the new code. You could also choose to duplicate calls and send real traffic to a test system to see how it copes under the load.
Implementing a feature flag should not be complicated—the code only exists while the migration is happening, after all. A simple on/off flag and a router for a proportion of traffic can be as simple as the following examples. The first example will swap to the new worker completely when the configuration value changes, and the second is configured to send a percentage of the traffic to the new worker to allow a controlled rollout of the new code:
@app.route("/migrating_endpoint")
async def migration_example():
    if current_app.config.get("USE_NEW_WORKER"):
        return await new_worker()
    else:
        return await original_worker()
@app.route("/migrating_gradually")
async def migrating_gradually_example():
    percentage_split = current_app.config.get("NEW_WORKER_PERCENTAGE")
    if percentage_split and random.randint(1,100) <= percentage_split:
        return await new_worker()
    else:
        return await original_worker()
Using Prometheus, we can monitor the migration. Figure 5.2 is an example of a graph showing how the rate of the original_worker and new_worker calls that our application performs change over time with respect to the number of requests they process, as we steadily increase the percentage of calls that should use the new function.
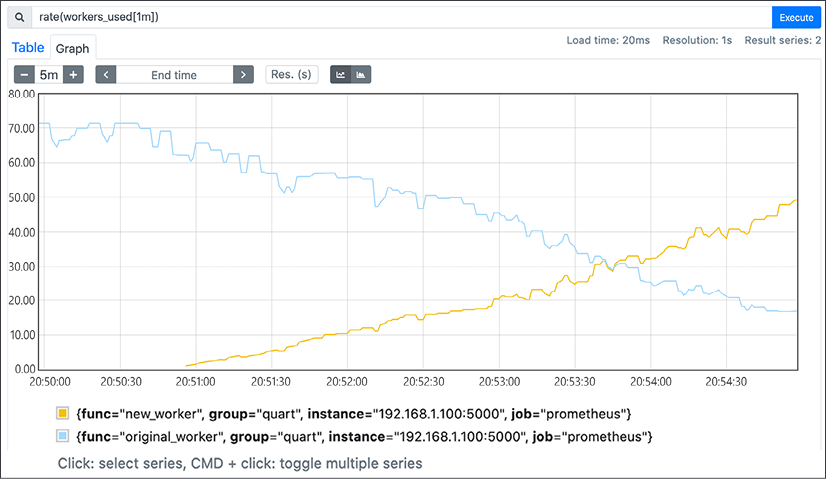
Figure 5.2: Using Prometheus to track how a gradual feature migration is progressing
Once a new feature is stable, the default state for the configuration option can be changed—until now, if the option is missing, the feature is off. By now it should be safe to assume that if the option is missing, it should be turned on. This should catch any piece of the code that is not using the configuration properly! It will let you remove the feature flag, and also let you remove the old version of the feature and any code that checks the flag, finishing a migration.
Refactoring Jeeves
Examining Jeeves to see what aspects could be improved as a microservice, we might discover some external queries are slowing down our responses or using too many resources.
However, we also discover a more fundamental change to the architecture. Responding to an incoming message is purely for the benefit of Slack's infrastructure, as the user does not see that message. Sending messages to Slack is independent of receiving messages, and so those two elements could be separate services. Instead of a monolithic application, we could have a microservice that simply accepts incoming messages, and routes them appropriately to other microservices that perform the actions the user has asked for. Then those services can all contact a microservice that specializes in sending messages to Slack.
Some of these services will need to contact the database, and if we were to keep our current database architecture then each of these new microservices would need the database models. This is a tightly coupled design, meaning that any change in the database schema will need to be duplicated in all these new services, and the deployment managed so that the old and new versions are not running at the same time. To prevent this, we can convert our database into its own microservice, and set it up to answer the questions we know it will get.
No other service needs to know the internal structure of the data, as it must simply know where to ask, and that the answer will always be structured the same way—or be obvious through a version marker in the data that it should read differently.

Figure 5.3: Our new microservice architecture; the Celery workers are left out for simplicity
This has an additional benefit: All these microservices can be used by any other tool. We could have a service that receives email, or messages through Signal and Telegram, or reads an IRC channel, and each of those could parse and understand the incoming messages, package up some instructions on how to reply, and send them on to the right service to perform the actions.
With the microservice version of the architecture, we can respond quickly to the needs of the organization and start controlling services, while also processing data in a consistent way, and allowing people flexibility in how they make automated requests and get notified of the results.
Let us look at the workflow in more detail.
Workflow
Everything looks the same from Slack's perspective. When a user types a message, the URL we have configured will be sent some JSON-formatted information. This data is received by our Slack Request API, which is where all the Slack message processing happens, and where we choose the right microservice as a destination. We also build a data structure that can contain information about where to send a reply that will act as an envelope for our message. The action processing services don't need to understand it, but the tools that post a reply to Slack do—and in the future, other ways to reply can be added with their own information in this metadata.
If our Slack Request service then makes a web request to the microservice, we must wait for it to respond, accounting for the time it has to wait for all the calls it makes. This can make our API very slow; its toleration of faults is also poor, as in the event of components breaking the entire chain falls apart and the message is lost.

Figure 5.4: How messages traverse the new microservices architecture
Thankfully, we have a message queue! Instead of directly calling each step in sequence, we can pass a message to RabbitMQ and immediately return an appropriate status code to Slack's infrastructure. It will accept the messages and ensure that they are delivered to workers that can perform the actions we need.
If one of our workers has a failure, the messages will queue up and still be there when we come back online—unless we tell them to expire after a certain period of time.
Once a reply has been created, we can then use RabbitMQ again and send a message to the Slack Posting service. We gain the same reliability improvements using the message queue as we do for the incoming messages, only now they are more resilient in the event of any failures.
Summary
In this chapter, we have discussed how to examine a monolithic service and determine which components should be converted to microservices, along with what sort of metrics to collect to allow us to gain a good understanding of a service's operational health and capacity.
This splitting process should be conservative and iterative, otherwise it is quite easy to end up with a system where the overhead for building and maintaining microservices outweighs the benefits of splitting an application up.
However, we have moved from a single application to many that need to interact with each other. Every link in Figure 5.4 can be a weak point for your application. What happens, for instance, if RabbitMQ goes down, or if there is a network split between the message processor and the Slack Posting service? We also need to consider how quickly our application responds to external requests, so that if a caller does not need to wait around for a response then they do not have to.
The same question goes for every new network link that was added to our architecture. We need to be resilient when something goes wrong. We need to know where we are and what to do when a service that was down is back online.
All these problems are addressed in the next chapter.